
 1,2,3,2,4,
- 1University of Victoria, Department of Physics and Astronomy, (meduardo@uvic.ca)
- 2Northern Arizona University, USA
- 3Herzberg Astronomy and Astrophysics Research Centre, Canada
- 4University of Pennsylvania, USA
- 5Harvard-Smithsonian Center for Astrophysics, USA
- 6Space Telescope Science Institute, USA
- 7Lowell Observatory, USA; Northern Arizona University, USA
- 8University of Michigan, USA
Trans-Neptunian Objects (TNOs), which are the small bodies beyond the orbit of Neptune, are regarded to be the most primitive members of the Solar System, and as such, provides valuable insights into both history and the current state of the outer Solar System.
Their size distribution (SD), which can be inferred from their observed magnitude distributions, has remained relatively unaltered since the formation of the Solar System. This physical property is crucial for testing theoretical models of planet formation because it reflects the outcomes of accretion, collisional processes, and dynamical evolution over the history of the Solar System [1]. Therefore, comparing the observed size distribution with those predicted by models helps to constrain the proposed physical processes and underlying initial conditions that shaped the current Solar System. However, the relative faintness and distance of TNOs limits ground-based searches to only about m(r)~27 magnitude [2], while the lack of observations on the SD of TNOs smaller than m(r)~28 (D~20km) leaves theoretical models poorly constrained [3,4].
Using images obtained from our JWST Cycle 1 program #1568 we searched for ultra-faint TNOs to further constrain planet formation models. With this program’s NIRCam images, and simultaneous HST imaging, we detect and characterize TNOs as faint as m(r)~29.8 mag and as small as ~7 km (assuming 15% albedo) in diameter to explore never-before probed regions of the TNO size distribution. This is by far the deepest Solar System survey to date, with at least a visible magnitude deeper than the landmark survey by Bernstein et al. (2004) that used the Hubble Space Telescope (HST).
Program #1568 is a 3-epoch pencil beam sky survey conducted using NIRCam filters with effective wavelengths of ~1.5µm (F150W2) and 3.2µm (F322W2), centered on a region of the sky near 13h RA, -10° Dec. The observations are near the ecliptic plane, where the sky density of cold classical TNOs is maximal. The observations were taken from Jan 24 - Feb 4, 2023, at solar elongation of ~100 degrees, where the TNOs are near their turnaround points and are least likely to move off of the NIRCAM field of view. Figure 1 shows the observation layout of this program. A deep combined background image is subtracted from individual exposures, which are then digitally tracked and stacked at different rates of motion to search for TNOs.
The probability with which a TNO will be detected as a good track during a single epoch, whether it falls on a detector during both dithers, is quantified using the implanted artificial moving objects. It is well fit by the functional form ![]() , with the bright-end efficiency p0=0.96, the magnitude of half that efficiency at m0=28.92 (F150W2), and transition width w = 0.61 mag (see Figure 2).
, with the bright-end efficiency p0=0.96, the magnitude of half that efficiency at m0=28.92 (F150W2), and transition width w = 0.61 mag (see Figure 2).
We present our preliminary set of candidate sources detected with a total SNR of 15. By constraining their orbital parameters, we measure the faint end of the luminosity function for both the dynamically cold and hot components, and present their implications to the TNO SD down to diameters of 7 km. In future work, we will conduct a detailed analysis to determine which functional form of the size distribution best characterizes the observed population. This will offer deeper insights into the physical mechanisms governing the formation and evolution of the cold and hot populations, as well as the Kuiper Belt as a whole.
Figures:
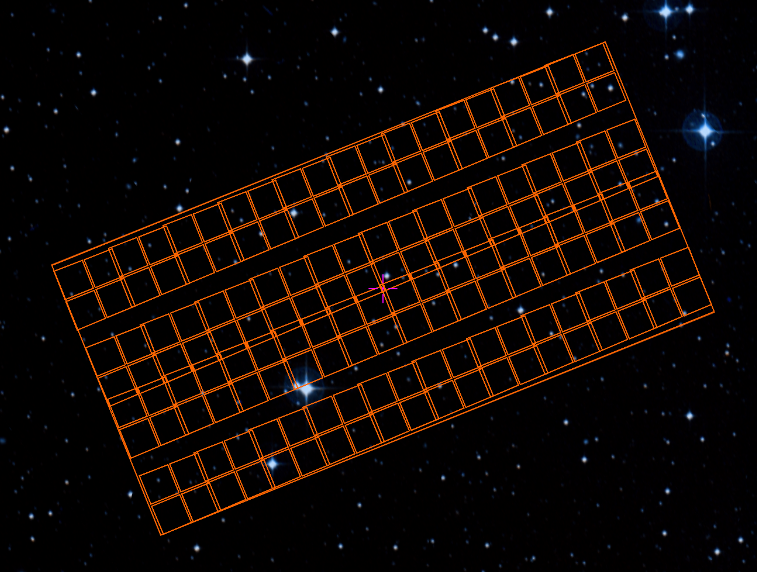
Figure 1. Observation footprints of the survey, consisting of 10×2 mosaic tiles. Each tile was observed with eight short-wavelength detectors (small squares with a 64″×64″ FOV) and two long-wavelength detectors, each equivalent in size to four short-wavelength detectors, covering 129″ × 129″. Two exposures were taken at each of the 20 mosaic tiles. Each of the two exposures consisted of three 215s integrations, and were acquired at dither positions <1" apart. The total exposure time per tile was thus 1290 sec.
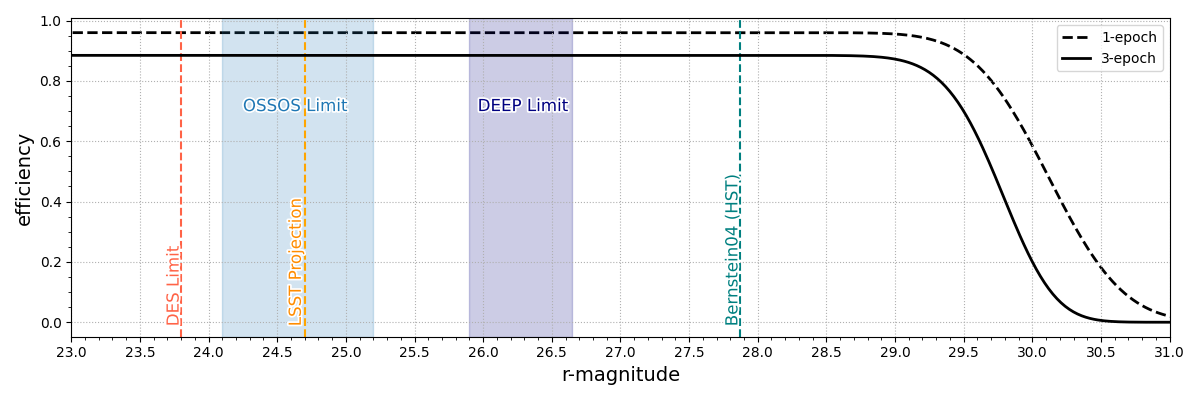
Figure 2. Recovery efficiency for implanted sources in the JWST survey as a function of r-band magnitude, assuming a nominal color r-F150W2=~ 1.2 mag. The dashed curve represents the efficiency from a single-epoch observation, while the solid black curve shows the cube of the upper completeness function, which is the expected probability of detection in all three epochs, and agrees with the implant results. The vertical lines represent the (range of) 50% completeness levels in several previous and upcoming TNO surveys: DES [6], OSSOS [7], LSST [8], DEEP [4] and [5]. This plot was inspired from Figure 10 of [4].
References:
[1] Fraser, W. C., Brown, M. E., Morbidelli, A., Parker, A., & Batygin, K. 2014, Astrophys J, 782, 100 [2] Fraser, W. C., & Kavelaars, J. J. 2009, Astron J, 137, 72
[3] Kavelaars, J. J., Petit, J.-M., Gladman, B., et al. 2021, Astrophys J Lett, 920, L28
[4] Napier, K. J., Lin, H. W., Gerdes, D. W., et al. 2024, Planet Sci J, 5 (IOP Publishing), 50
[5] Bernstein, G. M., Trilling, D. E., Allen, R. L., Brown, M. E., & Holman, M. 2004, 128
[6] Bernardinelli, P. H., Bernstein, G. M., Sako, M., Yanny, B., Aguena, M., et al. 2022, ApJS, 258, 41.
[7] Bannister, M. T., Gladman, B. J., Kavelaars, J. J., et al. 2018, ApJS, 236, 18
[8] Ivezić, Ž., Kahn, S. M., Tyson, J. A., et al. 2019, ApJ, 873, 111
How to cite: Eduardo, M., Morgan, A., Fraser, W., Trilling, D., Bernstein, G., Holman, M., Stansberry, J., HIlbert, B., Grundy, W., and Napier, K.: The Luminosity Function Of Ultra-Faint Trans-Neptunian Objects Detected By James Webb Space Telescope, EPSC-DPS Joint Meeting 2025, Helsinki, Finland, 7–12 Sep 2025, EPSC-DPS2025-1132, https://doi.org/10.5194/epsc-dps2025-1132, 2025.