MITM15
Solar System Science from JWST
Co-organized by OPS/SB
Convener:
Leigh Fletcher
|
Co-conveners:
Imke de Pater,
Thierry Fouchet,
Stefanie Milam,
Heidi Hammel
Orals WED-OB2
|
Wed, 10 Sep, 09:30–10:30 (EEST) Room Venus (Veranda 3)
Orals THU-OB2
|
Thu, 11 Sep, 09:30–10:30 (EEST) Room Mercury (Veranda 4)
Orals THU-OB3
|
Thu, 11 Sep, 11:00–12:27 (EEST) Room Mercury (Veranda 4)
Posters THU-POS
|
Attendance Thu, 11 Sep, 18:00–19:30 (EEST) | Display Thu, 11 Sep, 08:30–19:30 Finlandia Hall foyer, F107–124
Wed, 09:30
Thu, 09:30
Thu, 11:00
Thu, 18:00

Solar System observations have accounted for 4-6% of all JWST time allocated during the first three cycles, with almost every major body being viewed at least once in JWST’s major instrument modes, as well as >100 small bodies across the Solar System. This has generated a host of new discoveries, from the atmospheres and ionospheres of giant planets; to the distribution of ices on ocean moons; the hydration properties of small bodies; the chemical composition of comets; and the taxonomy of Trans-Neptunian Objects to tell the story of Solar System evolution. These exceptional new insights will set the scene for the next generation of planetary missions beyond Mars, both those en route to their destinations (e.g., Lucy, Psyche, JUICE, Europa Clipper and others), and those preparing for the next steps in our exploration of the Solar System.
This interdisciplinary session welcomes papers spanning the entire planetary science community, reporting new discoveries using JWST in any discipline.
Session assets
JWST Giant Planet Systems
09:42–09:54
|
EPSC-DPS2025-959
|
On-site presentation
09:54–10:06
|
EPSC-DPS2025-1210
|
On-site presentation
10:06–10:18
|
EPSC-DPS2025-813
|
ECP
|
On-site presentation
10:18–10:30
|
EPSC-DPS2025-817
|
On-site presentation
09:30–09:42
|
EPSC-DPS2025-447
|
ECP
|
On-site presentation


09:42–09:54
|
EPSC-DPS2025-1275
|
On-site presentation
09:54–10:06
|
EPSC-DPS2025-1254
|
ECP
|
On-site presentation
10:06–10:18
|
EPSC-DPS2025-1816
|
ECP
|
On-site presentation
10:18–10:30
|
EPSC-DPS2025-909
|
On-site presentation
JWST Small Bodies
11:12–11:24
|
EPSC-DPS2025-521
|
On-site presentation
11:24–11:39
|
EPSC-DPS2025-1132
|
ECP
|
On-site presentation
11:39–11:51
|
EPSC-DPS2025-1796
|
On-site presentation
11:51–12:03
|
EPSC-DPS2025-1159
|
On-site presentation
12:03–12:15
|
EPSC-DPS2025-1062
|
ECP
|
On-site presentation
12:15–12:27
|
EPSC-DPS2025-897
|
ECP
|
On-site presentation
F108
|
EPSC-DPS2025-622
|
On-site presentation
F109
|
EPSC-DPS2025-651
|
On-site presentation
 Figure 1 NIRCam images of Saturn at 3.23 µm (left, with rings saturated to show atmospheric detail) and 2.12 µm (right), acquired in GTO1247 in June 2023.
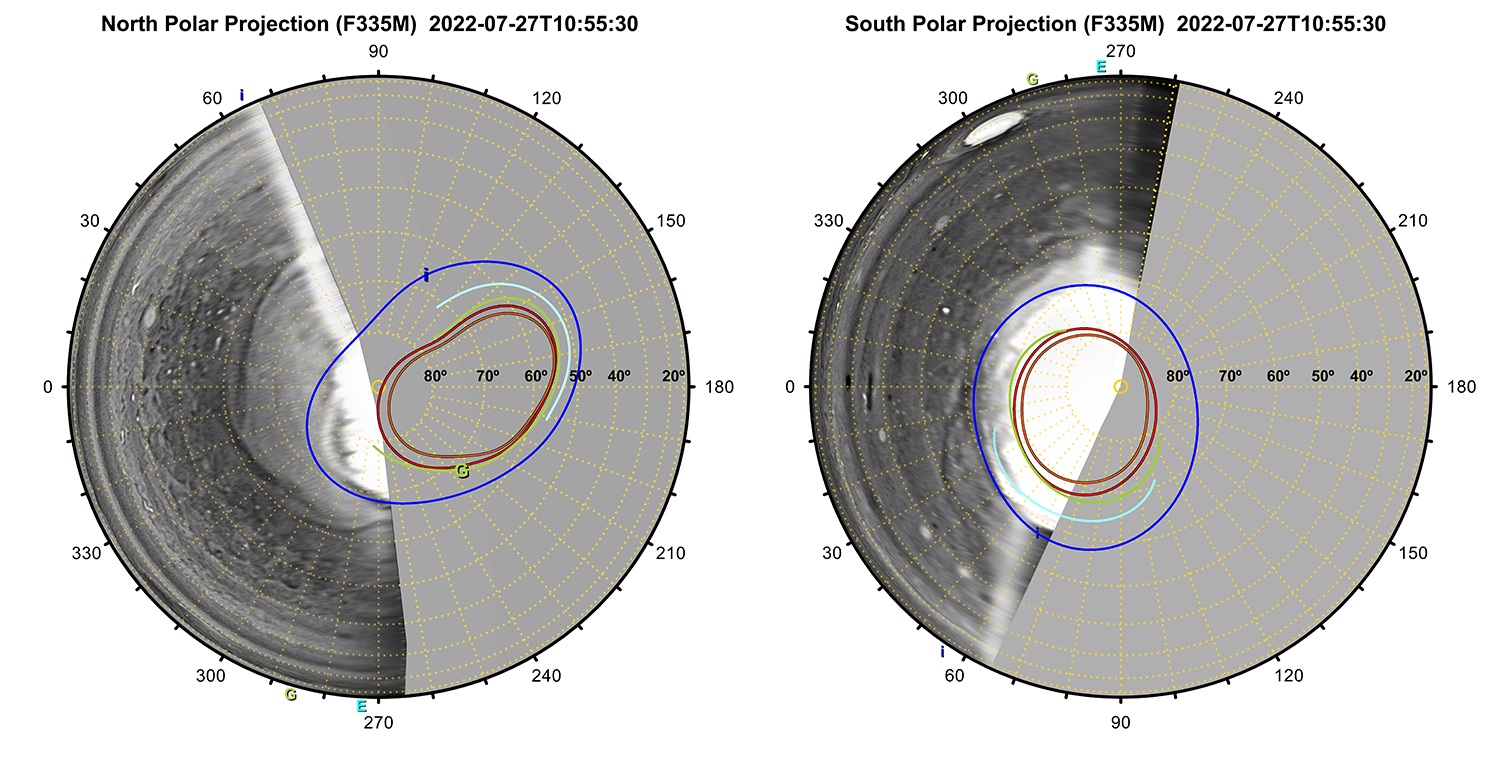
 Figure 2 Polar projections of NIRCam data at 3.23 µm (top row) and 2.12 µm (bottom row), for northern and southern hemispheres. The auroral oval is evident at 3.23 µm (top left); and small vortices, the hexagon and ribbon can be seen at 2.12 µm (bottom left). Zonally-averaged brightnesses (and their poleward gradients) are shown on the right, compared to the locations of Saturn’s prograde jet peaks (vertical dashed lines).
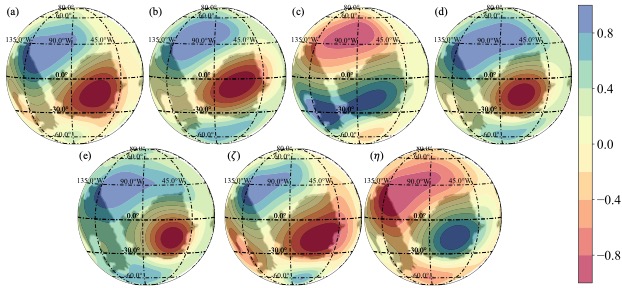
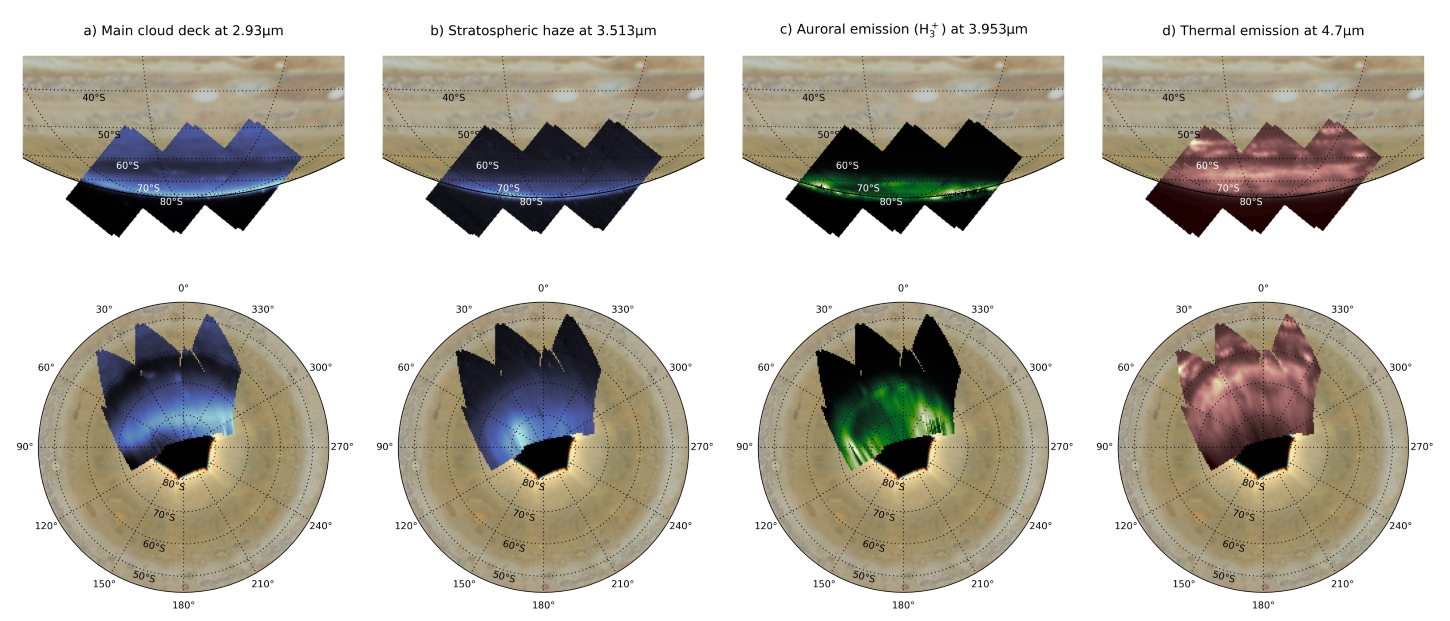
 Figure 3 Polar projections of NIRSpec data in November 2024, showing brightness (top row) and residual from the zonal mean (bottom row) at 5.1 µm (showing deep thermal emission), 3.0 µm (showing aerosol reflection), and 3.32 µm (a blend of CH4 fluorescence and aerosol reflection).
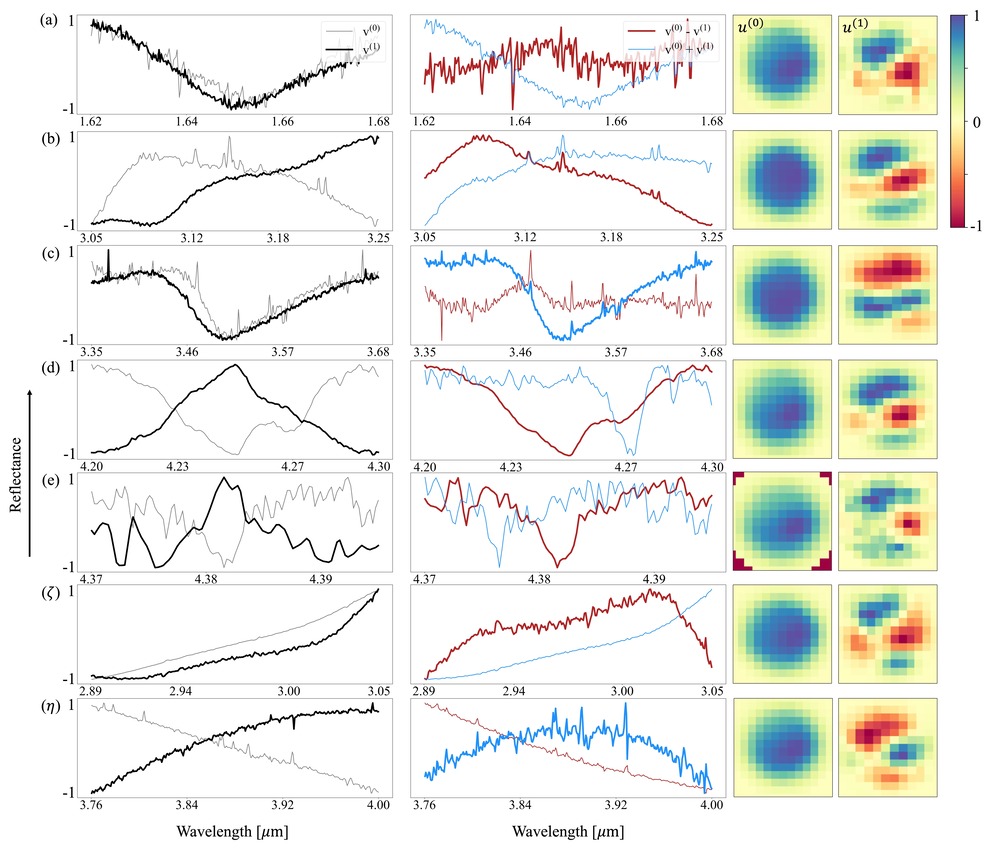
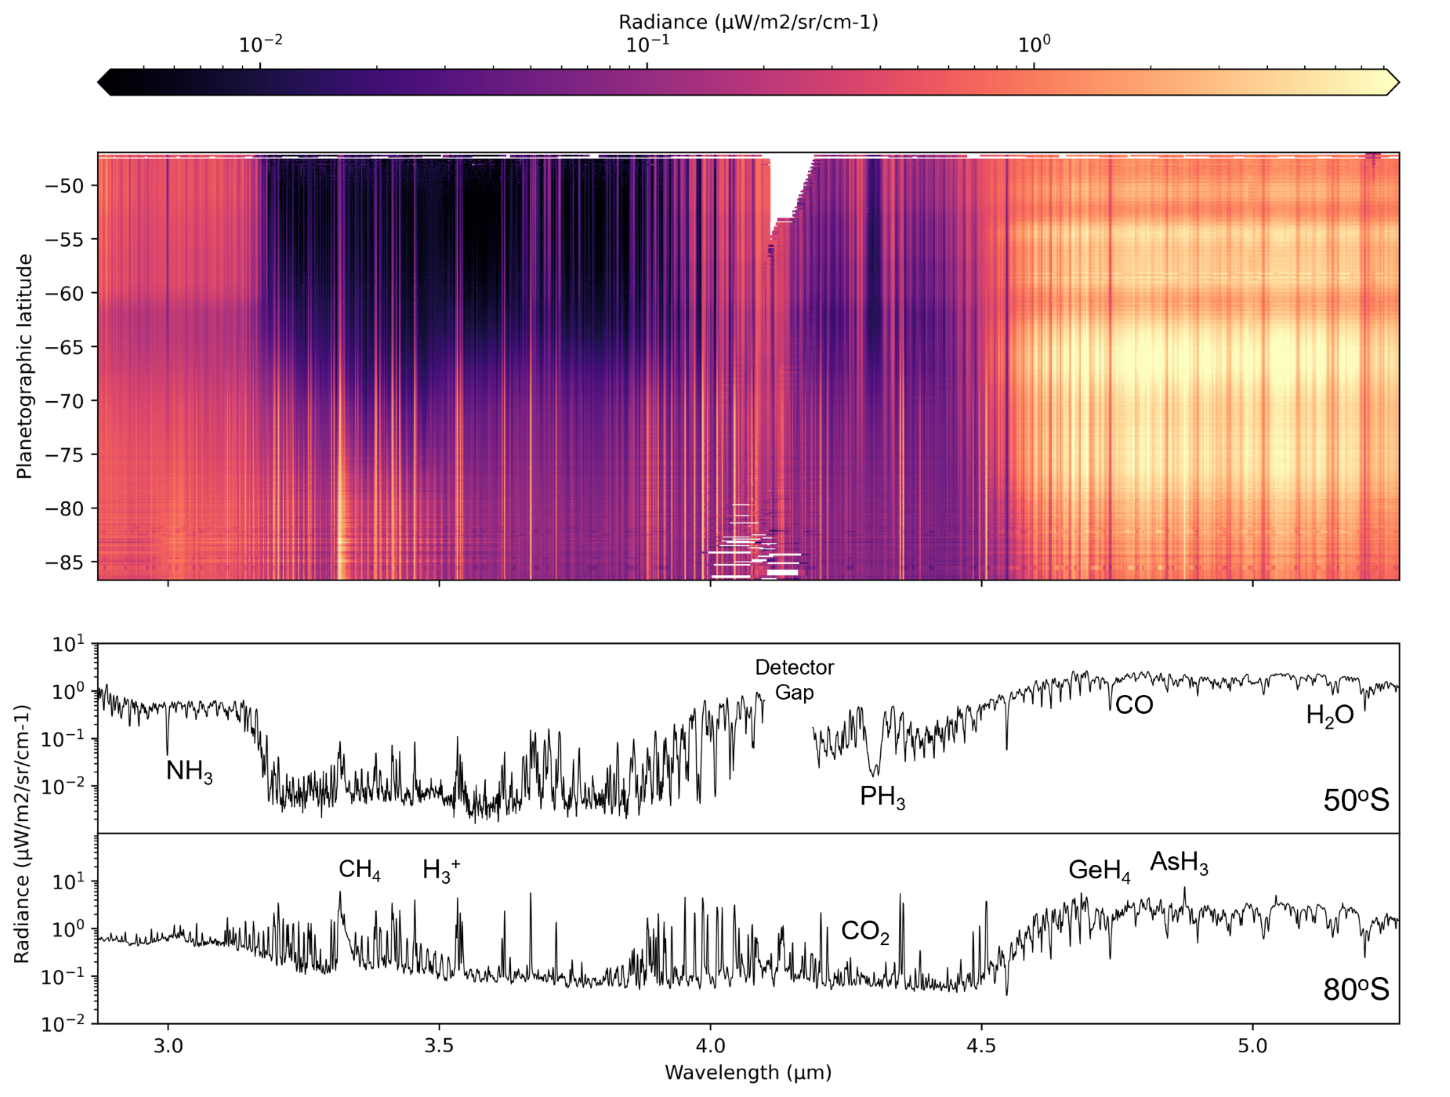
 Figure 4 Zonally-averaged NIRSpec spectra at 55 and 75oN, with key gaseous absorptions (and fluorescent emission) labelled.
F110
|
EPSC-DPS2025-805
|
ECP
|
On-site presentation
F111
|
EPSC-DPS2025-820
|
ECP
|
On-site presentation
F112
|
EPSC-DPS2025-938
|
ECP
|
On-site presentation
F113
|
EPSC-DPS2025-416
|
On-site presentation
F115
|
EPSC-DPS2025-1532
|
On-site presentation
F117
|
EPSC-DPS2025-1261
|
On-site presentation
F119
|
EPSC-DPS2025-404
|
ECP
|
On-site presentation

F120
|
EPSC-DPS2025-488
|
Virtual presentation
F121
|
EPSC-DPS2025-761
|
On-site presentation
F122
|
EPSC-DPS2025-1004
|
ECP
|
On-site presentation
F123
|
EPSC-DPS2025-1109
|
Virtual presentation
F124
|
EPSC-DPS2025-1219
|
On-site presentation