
 1,2,3,4
- 1RIKEN (Institute of Physical and Chemical Research), Japan (tatsuro.iwanaka@riken.jp)
- 2Graduate School of Frontier Sciences, The University of Tokyo, Japan
- 3Laboratoire Atmosphères, Observations Spatiales (LATMOS) / IPSL, Université de Versailles Saint-Quentin, France
- 4Faculty of Science, Kyoto Sangyo University, Japan
Background
The cloud layer of Venus, composed of sulfuric‑acid aerosols, plays a key role in controlling the solar energy input of the atmosphere through its effect on planetary albedo. To clarify the sequence of processes whereby sulfur dioxide (SO2), the chemical precursor of the clouds, is transported to the cloud‑top region and photochemically converted to sulfuric acid, it is essential to understand the detailed temporal and spatial distribution of SO2 in detail. Observations have been conducted with both ground‑based telescopes [1] and spacecraft [2, 3]; however, these measurements are spatially sparse and temporally sporadic. As a result, the relationship between SO2 variability and atmospheric activities, as well as the evaluation of sulfur cycle and cloud formation scenarios, remains unresolved. The ultraviolet imager (UVI) onboard the Japanese Venus orbiter Akatsuki [4, 5] captures full‑disk images of Venus in two narrowband filters: 283 nm, centered on a SO2 absorption band, and 365 nm, where absorption by an unidentified UV absorber dominates. UVI acquires nearly simultaneous two‑wavelength disk-resolved images every two hours, and its temporal and spatial resolution offers the potential to relate the variation of SO2 and atmospheric dynamics from planetary‑scale waves down to mesoscale phenomena. However, the absorptions of SO2 and the unidentified absorber are mixed in these two‑wavelength images, making it difficult to analyze the detailed variation of SO2 so far. In this study, we separated the absorption contributions of SO2 and the unidentified absorber.
Dataset and Retrieval methods
In this study, we analyzed over 15,000 pairs of 283 and 365 nm UV images taken by Akatsuki/UVI. These UV images are Level 3b data products, which are calibrated radiance maps in the longitude-latitude coordinate (0.125 degree grid). To reduce computational cost, the data were spatially binned to a resolution of 1 degree. We compared the observed reflectance distributions at 283 and 365 nm with simulated reflectance generated by the radiative transfer calculations, and drive the best-fitted pair of the mixing ratio of SO2 and the imaginary part of the cloud refractive index (ni) as a proxy of the unidentified absorber by an iterative algorithm. Additionally, we performed sensitivity tests to examine the effects of cloud altitude and wavelength dependence of ni on the retrieved results.
Results
We first composited all the data from 2015 to 2022 and found that the SO2 mixing ratio peaks at the equator, decreases toward mid-latitudes, and exhibits a local maximum at 14–15 h local time. We interpret this distribution as a result of the equatorial upwelling in the Hadley-type meridional circulation and vertical movement caused by thermal tides with wavenumber 2, which lifts SO2-rich air from the lower altitudes to the cloud top. This pattern is consistent with the results of a general circulation model coupled with photochemistry [6] and previous Venus Express/SPICAV-UV observations [3], at least with respect to latitude.
The longitude-time Hovmöller diagram (Figure 1) shows a consistent feature that moves with a period of 4 days, suggesting the dynamical influence of the Kelvin wave. On a multi-year time scale, the mean SO2 mixing ratio increased from 2016 to 2019 and decreased by 2022 (Figure 2), in agreement with ground-based infrared observations [1]. The long-term variations of the unidentified absorber show a similar trend to those of SO2. These variations are also correlated with changes in the mean zonal wind derived from Akatsuki cloud tracking data [7]. Because the effect of absorption by the unidentified absorber extends into the visible wavelengths where solar irradiance is strong [8], these variations suggest that enhanced solar heating may intensify thermal tides, leading to dynamical feedback that further amplifies wind speeds and further enhances SO2 transport.
In this presentation, we highlight these newly analyzed variations across multiple temporal and spatial scales.
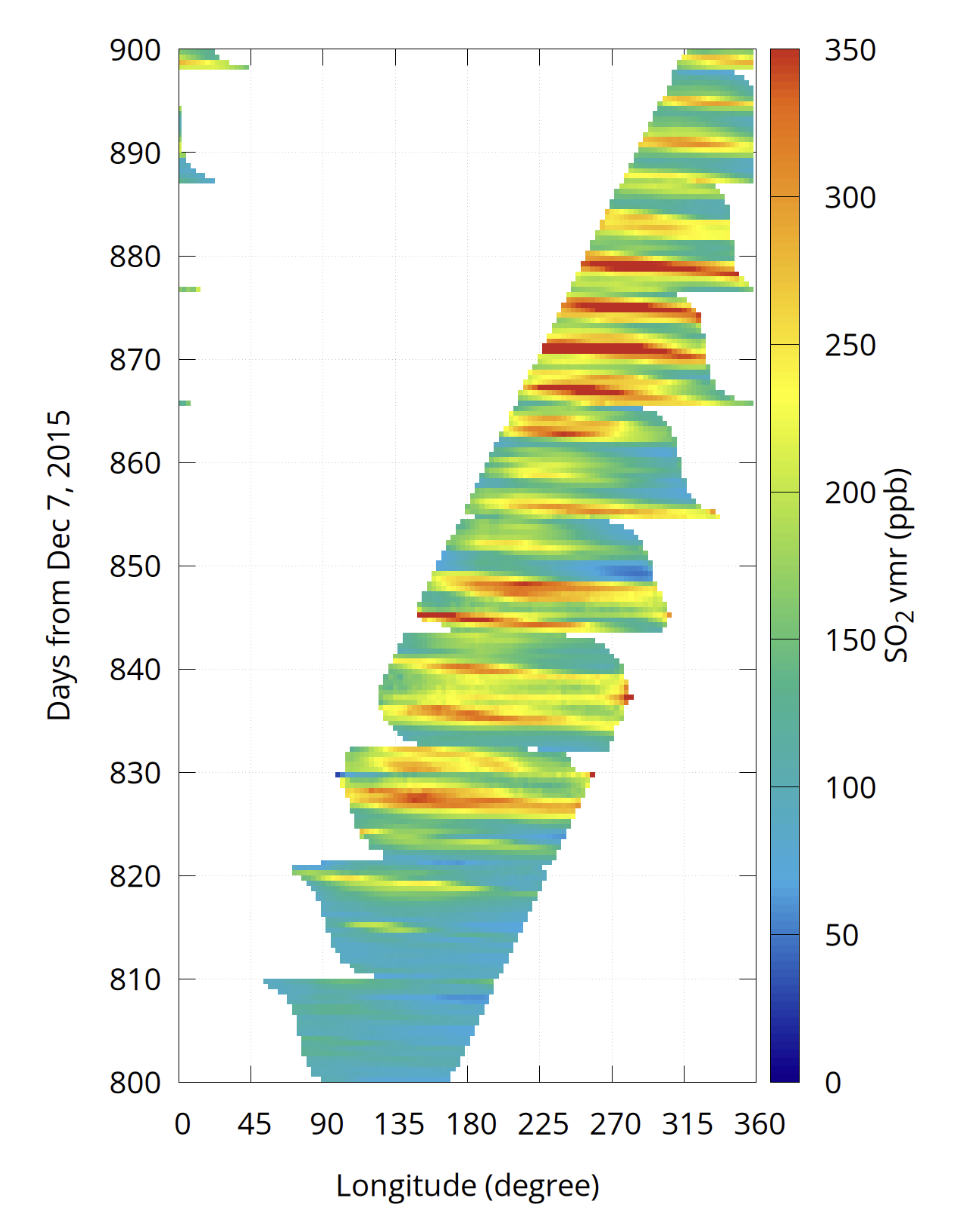
Figure 1: Hovmöller diagram of SO2 mixing ratio from Feburuary 22 to Jun 2, 2018.
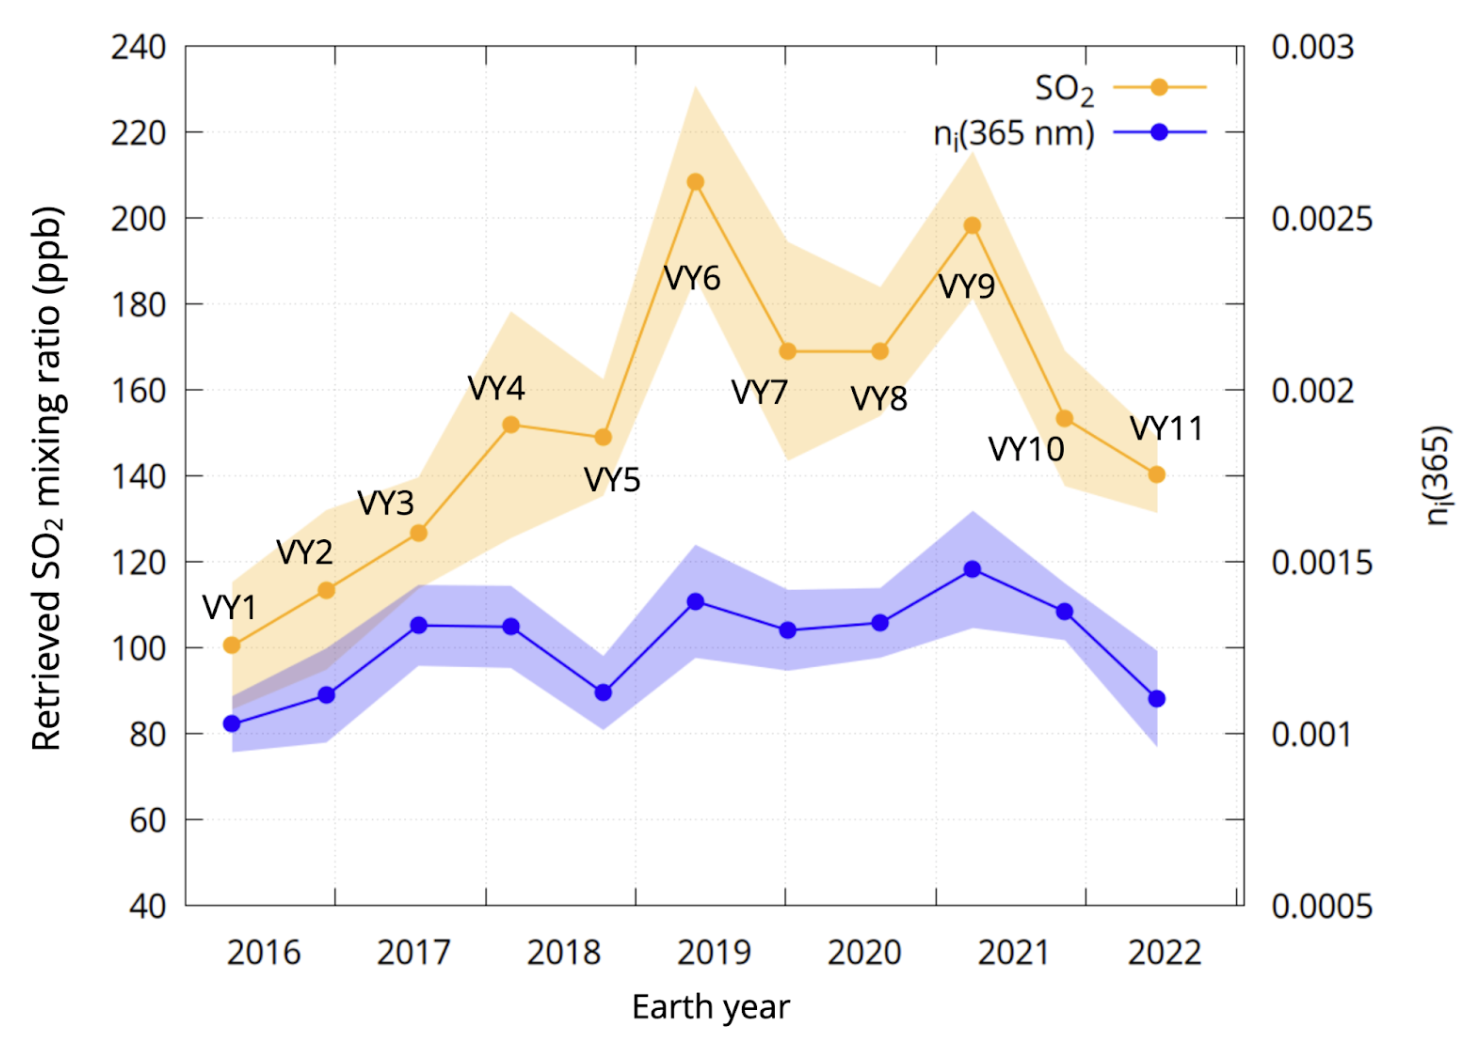
Figure 2: Long-term variation of the mean SO2 mixing ratio (orange) and ni (blue) with 1-σ standard deviations (shaded). VY stands for the Venusian year from December 15, 2015
References
[1] Encrenaz T. et al., A&A, 674, A199 (2023)
[2] Esposito LW et al., JGR-Atmospheres, 93, 5267 (1988)
[3] Marcq E. et al., Icarus, 335, 113368 (2020)
[4] Nakamura M. et al., Earth Planet. Space, 68, 75 (2016)
[5] Yamazaki A. et al., Earth Planet. Space, 70, 23 (2018)
[6] Stolzenbach A. et al., Icarus, 395, 115447 (2023)
[7] Horinouchi T. et al., JGR–Planets, 129, e2023JE008221 (2024)
[8] Moroz VI et al., Sov. Phys. Usp., 28, 524 (1985)
How to cite: Iwanaka, T., Imamura, T., Aoki, S., Marcq, E., and Sagawa, H.: Multiple temporal and spatial scales variation of sulfur dioxide at the Venusian cloud-top, EPSC-DPS Joint Meeting 2025, Helsinki, Finland, 7–12 Sep 2025, EPSC-DPS2025-1141, https://doi.org/10.5194/epsc-dps2025-1141, 2025.