
 ,,,
,,,- Purdue University, Earth, Atmospheric, and Planetary Sciences, United States of America
Introduction:
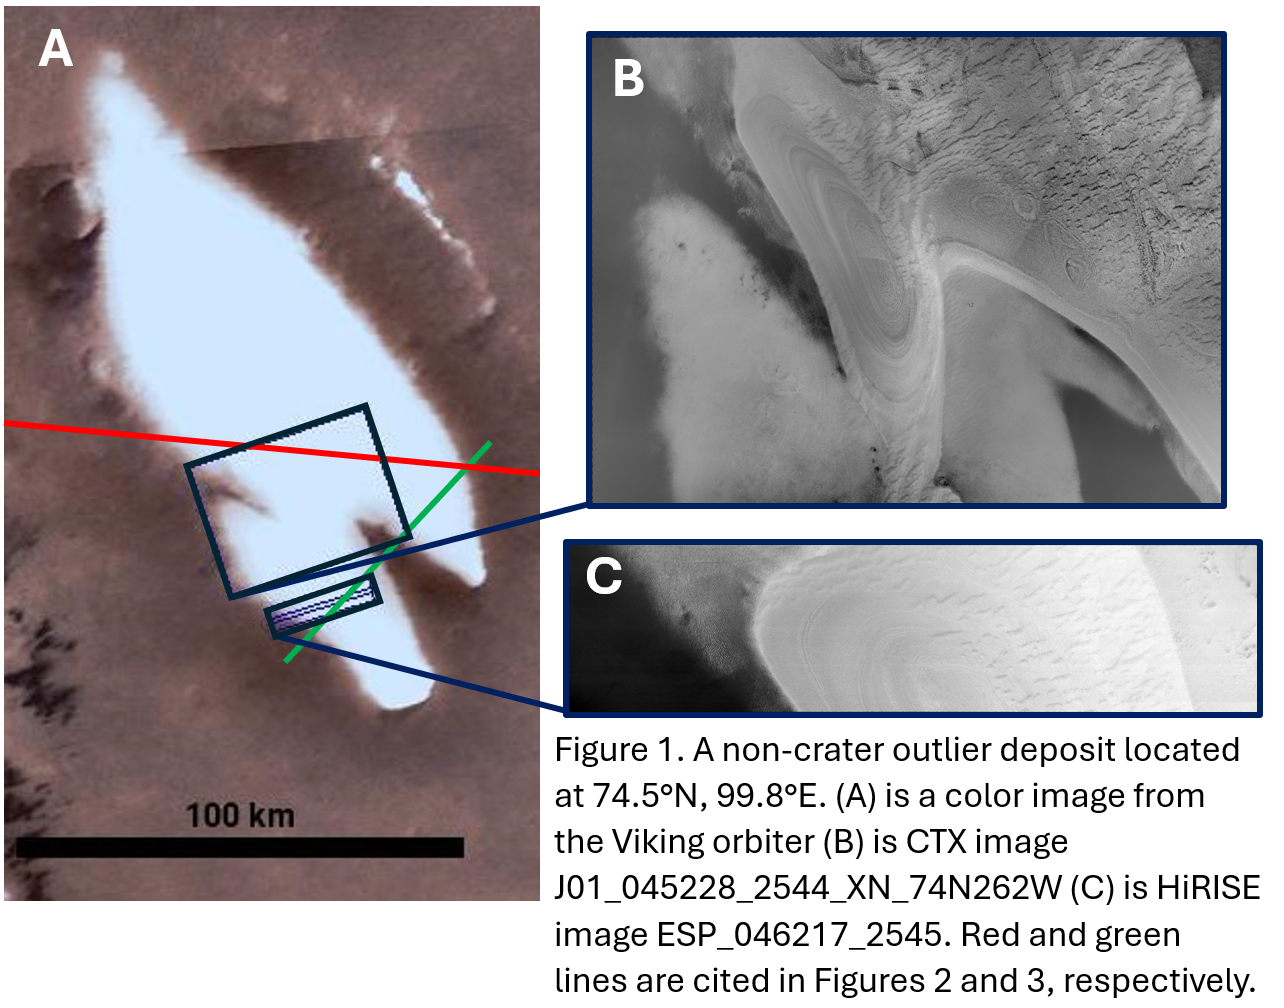
The Polar Layered Deposits (PLDs) at the poles of Mars are believed to preserve a paleoclimate record that reflects the climate at the time of their formation [1]. Due to Mars' large obliquity and precession cycles, orbital forcing is thought to be the dominant driver of climate change [e.g., 2]. The PLDs and ice mounds in craters have been studied for evidence of this record, though interpretations remain debated [e.g., 1]. However, there are also layered, non-crater, outlier ice deposits located at the poles but lower latitudes, which may be more sensitive to obliquity variations. We propose that these outlier deposits could preserve a similar paleoclimate record as the PLDs. These deposits are understudied, but they may provide new insights into Mars' climate history. Here, we identified these deposits in both hemispheres, examined their surface and subsurface structure, and compared them to the PLDs.
Visible Image and Topographic Examination:
We searched both hemispheres for evidence of icy outlier deposits with positive topographic relief in MOLA data. In visible images some features look like ice deposits, but parts of the features did not have any resolvable elevation, indicating it is a surface frost. We referenced some geological maps of the poles [3, 4], but ultimately our criterion of topographic relief was the deciding factor for a feature to be considered an outlier deposit.
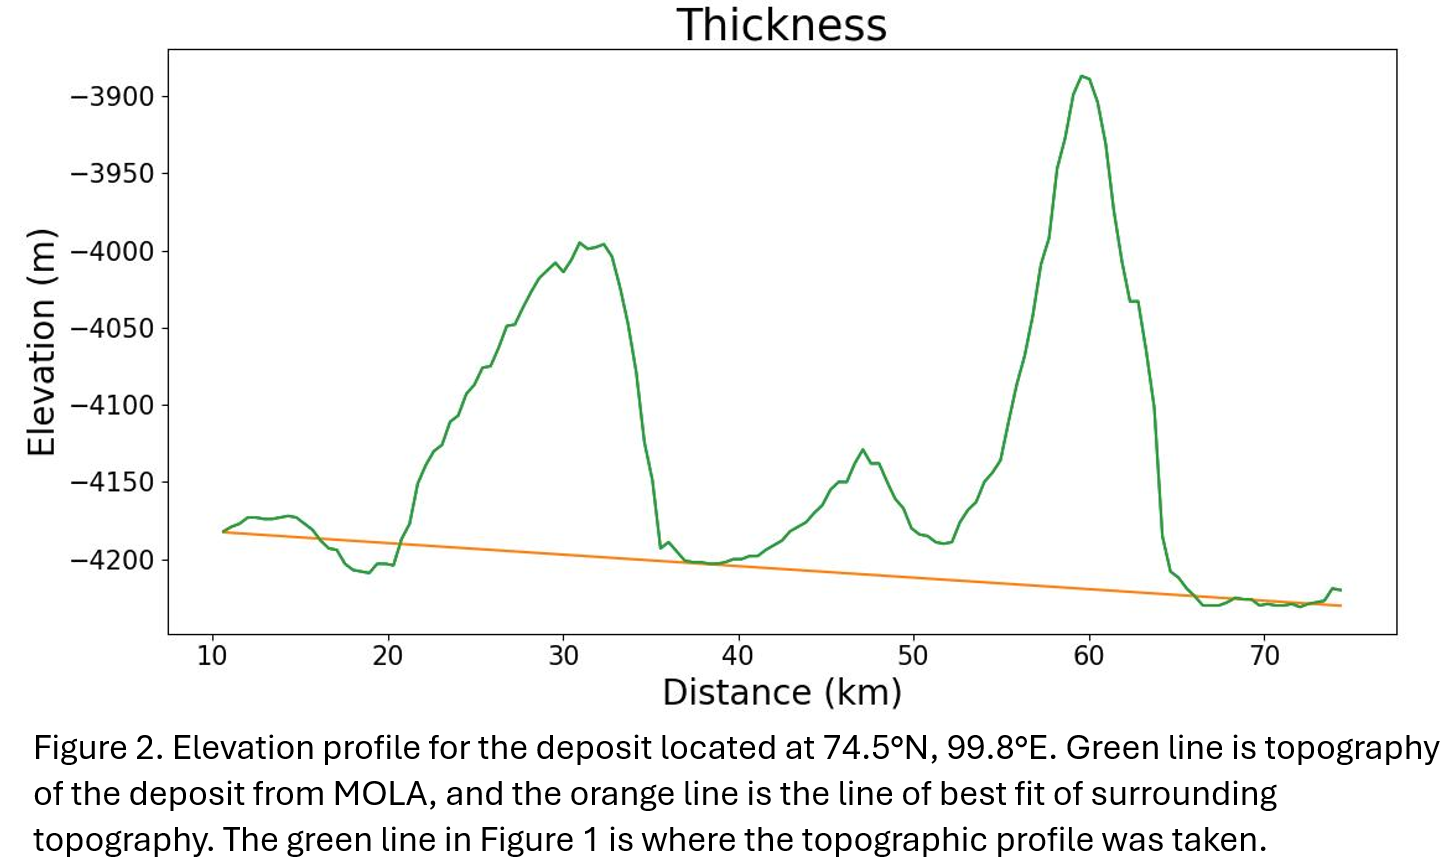
We located 5 deposits in the southern polar region and 8 deposits in the northern polar region. For each deposit, we calculated the surface area, average thickness, and volume. To find the average thickness, we took a topographic profile (using MOLA elevation) of the deposit and created a line of best fit of the surrounding topography. We took the difference between the topography of the deposit and that line (see Figure 2) to find the thickness. We did this for several profiles across the deposit and averaged them together for the average thickness. We recorded the presence of any exposed layering of these deposits for future paleoclimate analysis. We found the total volume of all the deposits to be 2104.8 km3, with 442.0 km3 in the southern hemisphere and 1661.8 km3 in the northern hemisphere.
Radar Analysis:
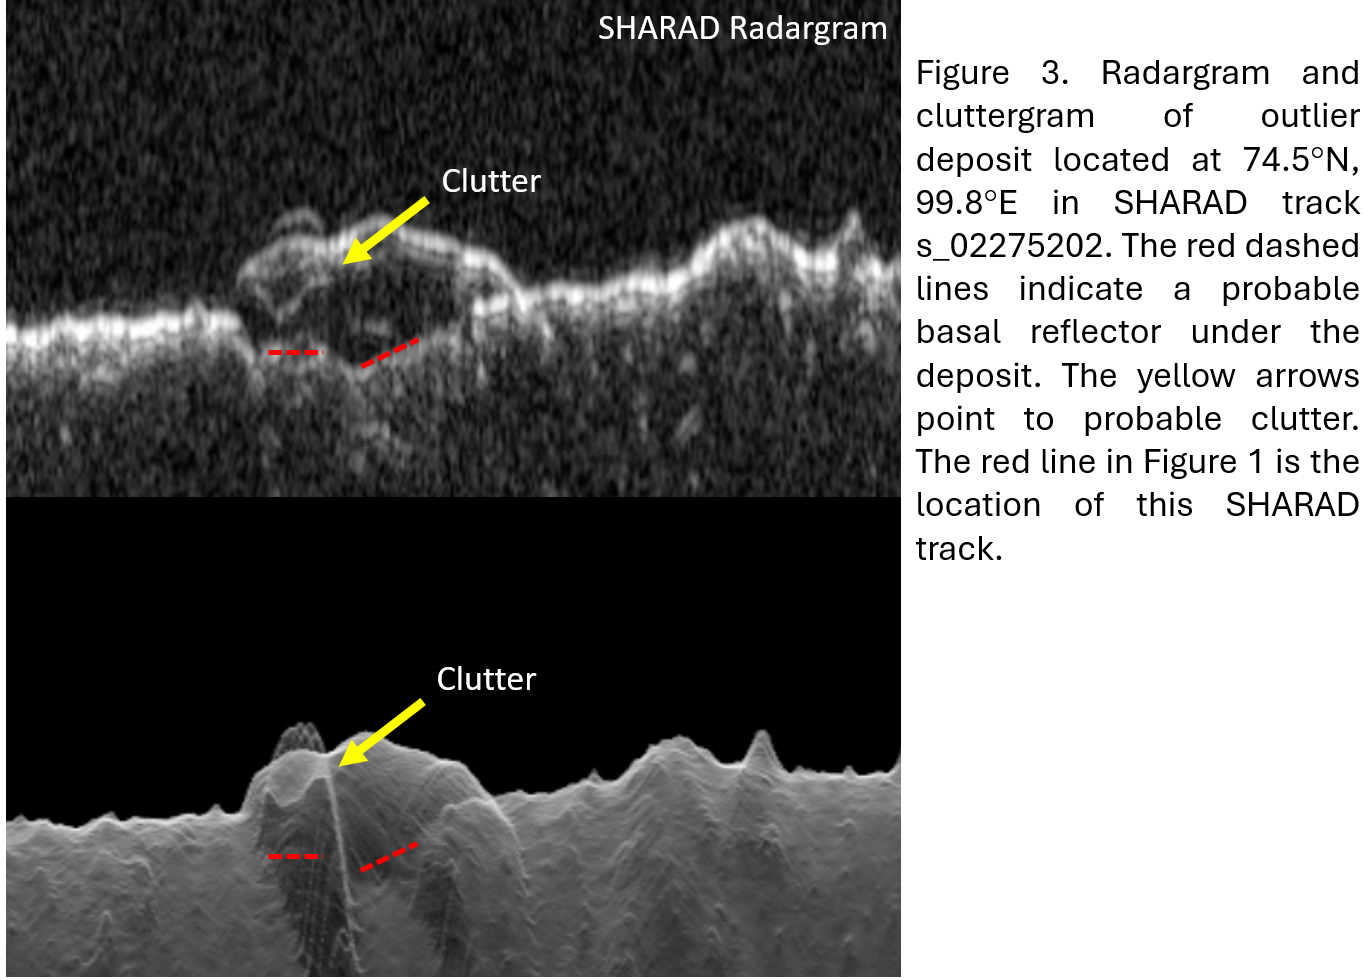
To examine the interior structure and composition of these deposits, we used SHARAD radargrams [5]. Radargrams reveal subsurface reflections due to contrasts in dielectric properties, but surrounding surface topography can also reflect the radar signal and create “clutter” in the radargram at similar delay times as subsurface targets, making it difficult to distinguish reflectors due to real subsurface interfaces. For each deposit, we compared the SHARAD radargrams to simulated cluttergrams (Figure 3). Cluttergrams are simulated radargrams that are created from surface topography showing expected clutter. After comparing SHARAD radargrams and cluttergrams, we found the time delay from the top of the deposit to the potential base of each deposit. We then used the thickness, d, to find the real permittivity, ![]() , of these deposits using the equation
, of these deposits using the equation ![]() , where c is the speed of light and t is the two-way delay time. We found real permittivity values for 8 of the deposits. We could not confidently identify the base for the other 4 deposits; thus, we do not have permittivity calculations for them. We also calculate the loss tangent for these 8 deposits using the methods of [6], which is dependent upon the imaginary permittivity. While the real permittivity relates to how long it takes for the radar wave to propagate through the material, the imaginary permittivity relates to how a material attenuates the radar, which is also sensitive to composition.
, where c is the speed of light and t is the two-way delay time. We found real permittivity values for 8 of the deposits. We could not confidently identify the base for the other 4 deposits; thus, we do not have permittivity calculations for them. We also calculate the loss tangent for these 8 deposits using the methods of [6], which is dependent upon the imaginary permittivity. While the real permittivity relates to how long it takes for the radar wave to propagate through the material, the imaginary permittivity relates to how a material attenuates the radar, which is also sensitive to composition.
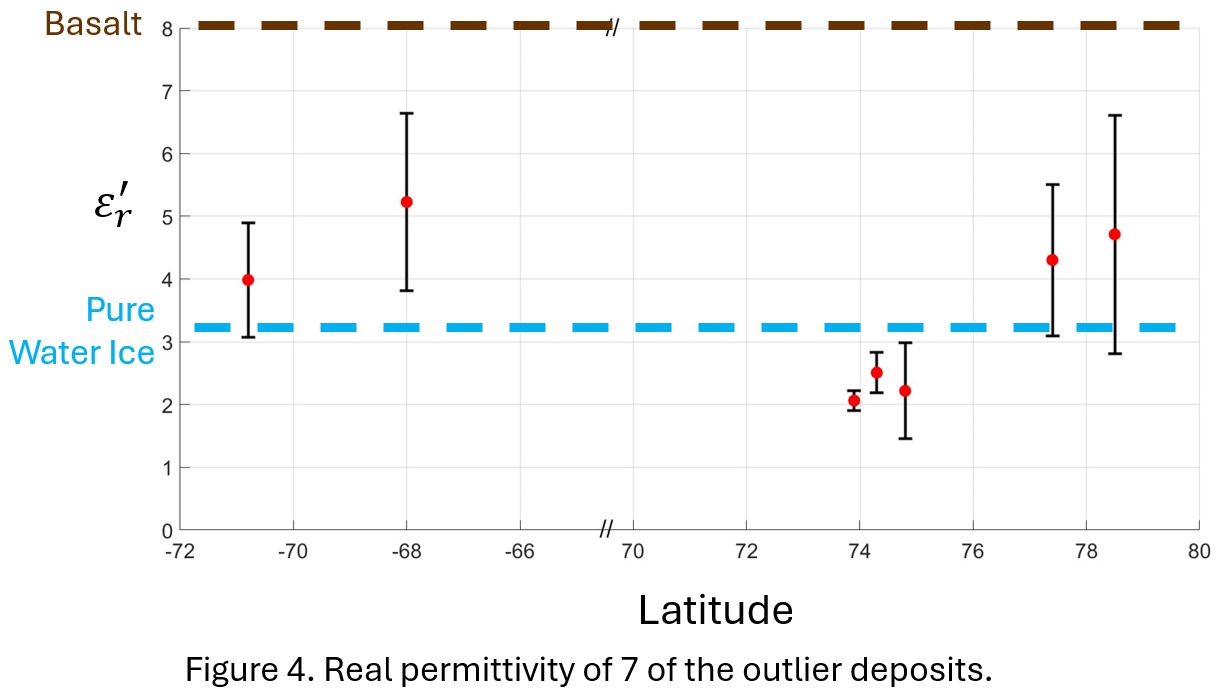
We found that the real permittivity for the 5 of the 8 deposits are consistent with dirty water ice, slightly dirtier than the PLDs, as shown in Figure 4. Using the power relation law in [7], a deposit with ![]() = 4.5 could be 70% ice and 30% dust. There were 3 outlier deposits in the northern hemisphere with unusually low real permittivities, in a range of 2 – 2.5. Loss tangent values for all eight deposits fall within 0.001– 0.005, consistent with NPLD values [8, 9].
= 4.5 could be 70% ice and 30% dust. There were 3 outlier deposits in the northern hemisphere with unusually low real permittivities, in a range of 2 – 2.5. Loss tangent values for all eight deposits fall within 0.001– 0.005, consistent with NPLD values [8, 9].
Discussion:
Our results suggest that five of the deposits consist of dirty water ice, with slightly higher dust content than the PLDs, possibly due to enhanced sublimation at their lower latitudes. Most of the identified outlier deposits had exposed layering, and at least 3 of them also have internal layering that could be seen with radar.
We have four hypotheses to explain the unusually low real permittivity of the 3 northern deposits:
- The deposits are highly porous water ice (>30% porosity)
- The deposits are CO2 ice
- The deposits are CO2 clathrate hydrate ice
- We incorrectly identified the basal reflectors
Because permittivity values map non-uniquely to compositional mixtures, we cannot determine composition solely from radar data. However, 30% porosity could be plausible given the deposits’ small thickness (tens of meters), which may limit compaction. Furthermore, thermal inertia values [10] for these three deposits are lower than those of the NPLD and other outliers, supporting the porous ice hypothesis. If correct, this could constrain their maximum age to ~380 Kyr [11], implying that these three deposits are among the youngest perennial climate records on Mars. Future work can employ paleoclimate analyses to read this climate record of these deposits.
References: [1] Byrne, S. (2009) Annu. Rev. Earth Planet. Sci. 37. [2] Murray et al. (1973) Science. 180. [3] Krasilnikov et al. (2018) Sol Syst Res. 52. [4] Tanaka, K., Scott, D., (1987) U.S.G.S., 3292. [5] Seu, R., et al. (2007) JGR: Planets, 112, E05S05. [6] Campbell et al. (2008) JGR: Planets, 113, E12. [7] Stillman, D. et al. (2010) J. Phys. Chem B. 114. [8] Grima et al., (2009) Geophys Res Let 35, 3. [9] Watters et al. (2007) Science 318, 5853. [10] Putzig, N., Mellon, M. (2007) Icarus 191, 1. [11] Arthern, R., et al. (2000) Icarus 144.
How to cite: Checketts, B., Sori, M., Bramson, A., and Horgan, B.: Outlier ice deposits at the poles of Mars as young climate records, EPSC-DPS Joint Meeting 2025, Helsinki, Finland, 7–12 Sep 2025, EPSC-DPS2025-1171, https://doi.org/10.5194/epsc-dps2025-1171, 2025.