
 1,2,3,4
- 1Independent Researcher, Denver, Colorado, USA
- 2University of Oxford, Oxford, UK
- 3British Astronomical Association, London, UK
- 4University of Leicester, Leicester, UK
Introduction
Jupiter’s northern Equatorial Zone (EZn) and southern North Equatorial Belt (NEBs) are dominated by three features: five-micron hotspots (seen as North Equatorial Dark Features, NEDFs, in the optical), white cloud plumes, and complex local circulation. These features are influenced by the NEBs jet, which is modulated by a meridionally trapped Rossby wave, in conjunction with the high concentration of ammonia in the EZ and the ammonia depletion in the NEB. Numerous measurements have been made of the temperature, aerosol, and ammonia distributions in this region (c.f. Fletcher et al., 2020). And a number of models have been partially successful at explaining the interrelationships between the observed features (c.f Showman & Dowling, 2000). Here we explore the ammonia and cloud height distribution during 2024-25, when NEDFs and five-micron hotspots were prominent, using the optical band-average technique (Hill et al., 2024, Irwin et al., 2025). We show that while many sensing methods highlight the ammonia and aerosol depletion in five-micron hotspots, this band average method highlights enhancements in ammonia to the south of the hotspots.
Observations
Multiple observations on 2025-01-06 were made allowing coverage of a wide range of longitudes and coverage of a given longitude at several zenith angles. Figure 1 shows maps constructed using the method of Hill et al. (2024). An empirical limb correction is applied in addition to a weighted averaging scheme for overlapping observations. The data clearly show that enhanced ammonia regions lie to the south of NEDFs (labeled 1-4 in order of ascending longitude). For the ammonia enhancements we observe a planetary wave number of nine, within the range of hotspot and NEDF wavenumbers typically observed.
Discussion
The NEBs jet speed peaks at about 7° N, which in fact marks the boundary between the NEDFs and the ammonia enhancements. Anticyclonic gyres are a known feature seen in the same location as we show ammonia enhancements (c.f. Choi et al., 2013). We hypothesize that these gyres are regions of uplift and outflow, bringing up ammonia rich air from deeper levels of the atmosphere. The NEDFs are thought to be areas of subsidence, with cyclonic flow, where dryer air descends from above and results in a clearing of aerosols. Figure 1D shows this schematically with upwelling occurring at the gyres, horizontal winds carrying condensates from the upwelling source to the east and northeast as the visible cloud plumes, and descending clear air in the NEDFs.
To further support this hypothesis, we analyze the ammonia mole fraction and cloud pressure at the NEDFs, gyres, and in the plumes through a regions-of-interest (ROI) approach. Figure 2 shows a longitudinal subset of the data in Figure 1, focusing on ammonia regions 3 and 4. Rectangles outline the ROIs which are analyzed for three observation times in Figure 2A. Figure 2B shows a time series of average values at each observation time for cloud pressure and ammonia mole fraction along with statistical errors. Finally, 2C shows scatter plots of the average cloud pressure versus the ammonia abundance. Note the very clear clustering of points where the NEB sample provides a consistent reference with relatively high pressure and very low ammonia abundance. Following the upwelling ammonia, eastward advection of plume aerosols, and NEDF subsidence from Figure 1, we can trace an ammonia cycle between its gaseous source and sink, with an intermediary aerosol state.
Future Work
Hundreds of observations of NEDFs and ammonia enhancements in the EZn have been made in 2024-25 using the Hill et al. (2024) technique. This data set will be analyzed and assessed for the statistical consistency of the results presented here. In addition, this data set will be compared to complementary multispectral observations to help discriminate why the optical method seems to so clearly detect ammonia enhancements at the 1-2 bar pressure level and why these enhancements appear broad enough to overlap NEDFs.
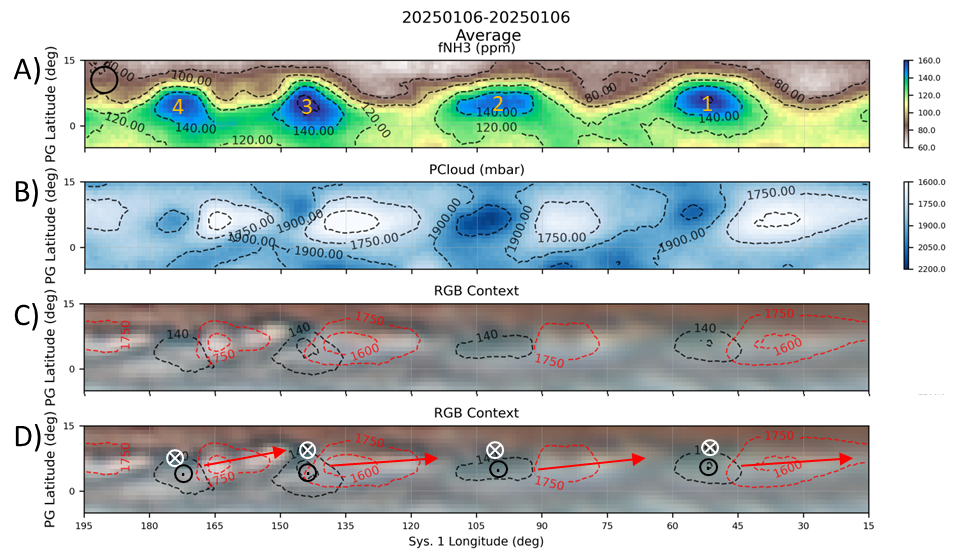
Figure 1. Ammonia mole fraction, cloud pressure, and visual context maps created from observations on 2025-01-06 using an 11 inch Schmidt-Cassegrain telescope. A) Ammonia mole fraction (ppm) with enhanced areas labeled 1-4 in order of ascending longitude. The black circle at left shows the approximate spatial resolution of the data. B) Cloud pressure (mbar). C) Visual context image with selected contour overlays to show enhanced ammonia mole fraction and lowest pressure (highest) clouds. D) Same as C), but with arrows indicating presumed upwelling (black ⊙), downwelling (white ⦻), and horizontal flow (red arrows).
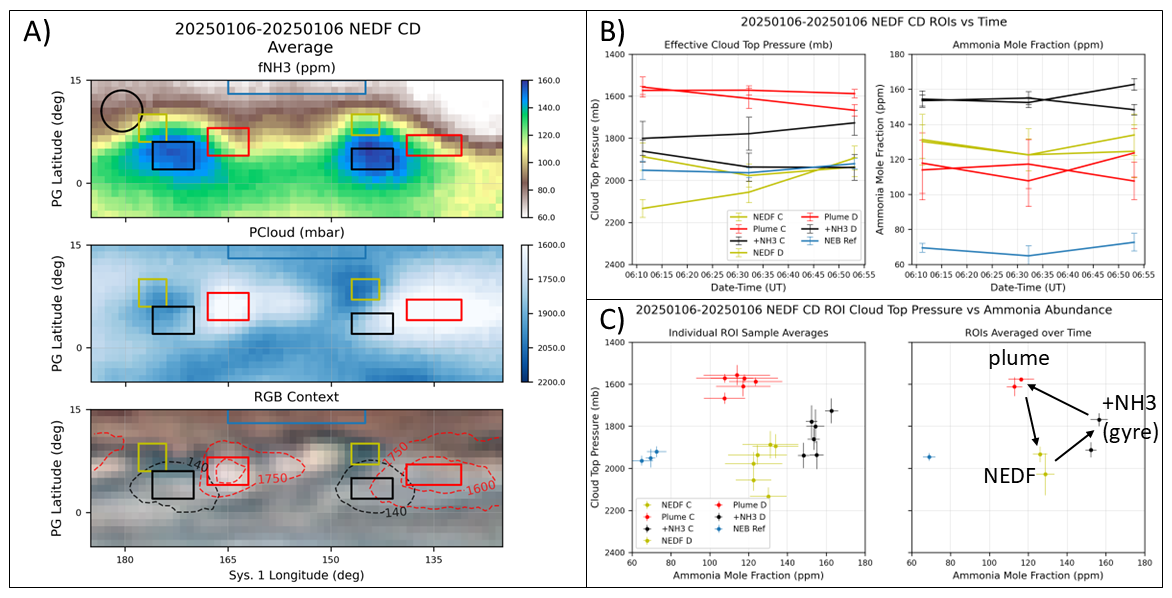
Figure 2. Two ammonia enhancements (4 & 3 from Figure 1), associated plumes, and NEDFs are analyzed for cloud pressure and ammonia abundance. Three observations are assessed with the targets near nadir viewing. A) Ammonia mole fraction, cloud pressure, and visual context image with overlaid rectangles indicating regions-of-interest (ROIs). B) Time series of cloud pressure (left) and ammonia mole fraction (right) over the three observations. C) Scatter plot of all ammonia and cloud measurements in each ROI (left) and of the averages over the three observations. Note that the NEB data are provided as a stable reference.
References
Choi, D. S. et al. 2013. Icarus, 223, 832.
Hill, S. M. et al. 2024. Earth and Space Science, 11(8), e2024EA003562.
Fletcher, L. N. et al. 2020. Journal of Geophysical Research (Planets), 125, e06399.
Irwin, P. G. J. et al. 2025. Journal of Geophysical Research: Planets, 130(1), e2024JE008622.
Showman, A. P., & Dowling, T. E. 2000. Science, 289, 1737-1740.
How to cite: M Hill, S., Irwin, P., Rogers, J., and Fletcher, L.: Optically Observed Ammonia in the Northern Equatorial Zone, EPSC-DPS Joint Meeting 2025, Helsinki, Finland, 7–12 Sep 2025, EPSC-DPS2025-1174, https://doi.org/10.5194/epsc-dps2025-1174, 2025.