
 12
12- 1Earth and Planetary Sciences, Weizmann Institute of Science, Rehovot, Israel
- 2Particle Physics and Astrophysics, Weizmann Institute of Science, Rehovot, Israel
Europa is a prime candidate for extraterrestrial life due to its subsurface ocean (Carr et al., 1998). Its surface offers a partial glimpse into oceanic processes while also acting as the interface between the moon’s internal geology and the extreme conditions of Jupiter’s magnetosphere. Shaped by both internal activity and external irradiation (Chyba and Phillips, 2002; Nordheim et al., 2022), Europa’s surface exhibits spatial and spectral variability that is key to interpreting its composition and assessing its astrobiological potential.
We present a novel data-driven analysis of JWST NIRSpec-IFU (Böker et al., 2022) observations of Europa’s leading hemisphere, using spectral decomposition to isolate dominant modes of variability.
The NIRSpec-IFU data form a three-dimensional cube with two spatial dimensions (nrow, ncol) and one spectral dimension. Each spatial pixel ("spaxel") records a high-resolution reflectance spectrum from ~1.0–5.2 μm. We flatten the cube into a two-dimensional matrix S∈Rm×n, where m = nrow×ncol, and n is the number of wavelength bins.
To analyze the spatial-spectral structure, we apply singular value decomposition (SVD) independently to seven spectral bands centered on diagnostic features: the 1.65 μm crystalline ice absorption feature, the 3.1 μm Fresnel peak of crystalline water ice (Hansen and McCord, 2004), the 3.5 μm hydrogen peroxide absorption (H2O2) (Trumbo et al., 2019; Wu et al., 2024), two carbon dioxide (CO₂) isotopologue absorptions near 4.25 μm and 4.38 μm (Trumbo and Brown, 2023; Villanueva et al., 2023), and two newly identified broadband continuum features. The SVD takes the form:
Sλ∈band=UΣV⊤
The columns of V represent the principal spectra v(i), where v(0) captures the average spectral shape across the hemisphere, and higher orders describe progressively weaker, spatially variable deviations from it. The columns of U are the spatial modes, u(i), which specify how much each v(i) contributes at each spaxel. Each local spectrum is thus approximated as a weighted sum of a global mean and a few spatially structured variations in shape.
We focus on the first two modes for each band, encoding the mean shape and the strongest perturbation. The spatial modes exhibiting variability, u(1), are fitted with spherical harmonics (![]() ), yielding a sparse, smooth representation of hemispheric structure and enabling consistent comparison across bands. Figure 1 illustrates the first two principal spectra, v(0) and v(1), and the first spatial mode, u(1), for the seven analyzed bands. Figure 2 illustrates a projection of the fitted models for u(1) of the seven bands onto Europa’s leading hemisphere.
), yielding a sparse, smooth representation of hemispheric structure and enabling consistent comparison across bands. Figure 1 illustrates the first two principal spectra, v(0) and v(1), and the first spatial mode, u(1), for the seven analyzed bands. Figure 2 illustrates a projection of the fitted models for u(1) of the seven bands onto Europa’s leading hemisphere.
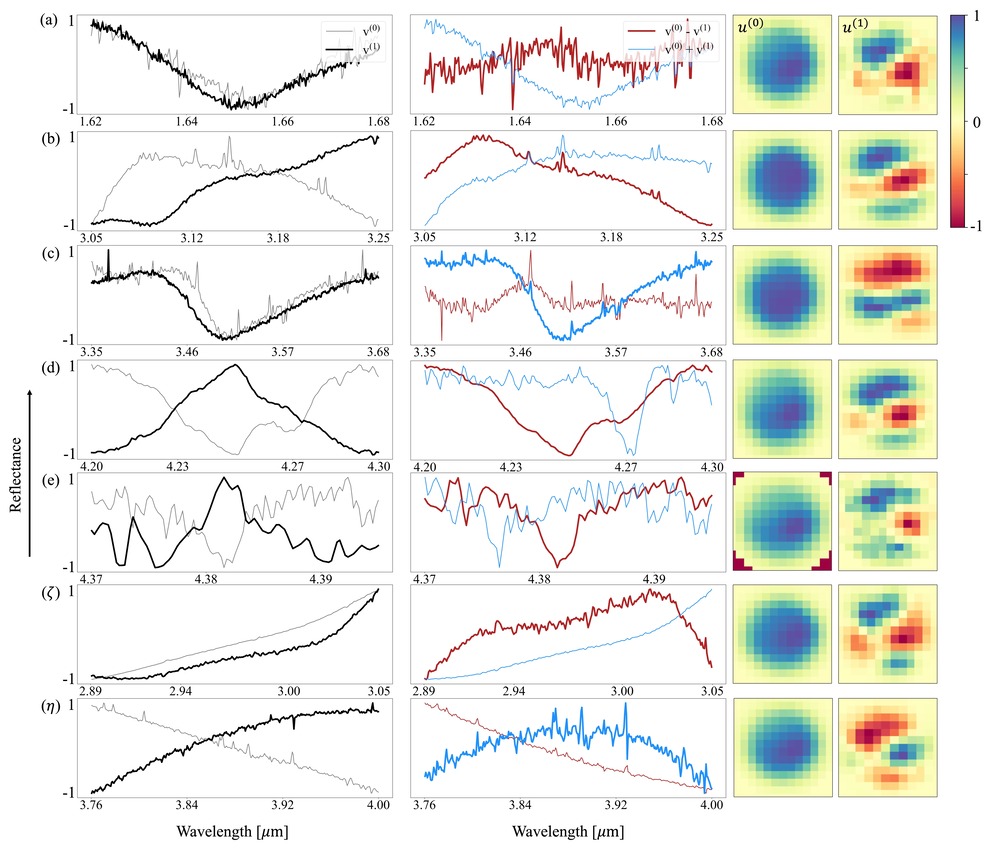
Figure 1. Spectral and spatial modes of seven spectral bands on Europa. Panels (a)–(e) correspond to the selected molecular bands: (a) 1.65 μm crystalline ice absorption band, (b) ~3.1 μm water ice Fresnel peak, (c) ~3.5 μm H₂O₂ absorption, (d) ~4.25 μm CO₂ doublet, and (e) ~4.38 μm ¹³CO₂ absorption. Two newly characterized broadband absorption features are labeled ζ and η. The zeroth- (mean) and first-order spectral modes, v(0) and v(1), are shown in gray and black, respectively, in the left panels. The sum and difference between these modes are shown in the middle panels (blue for sum, red for difference). The two right panels display the zeroth- and first-order spatial modes, u(0) and u(1), respectively.
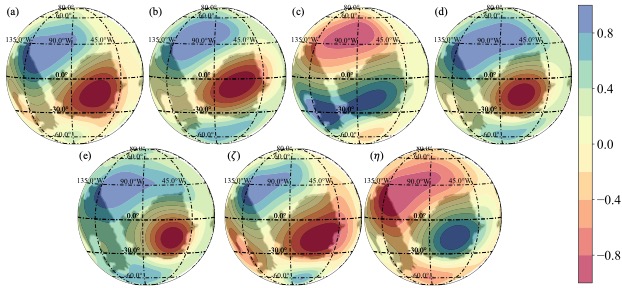
Figure 2. Qualitative projections of best-fit spherical harmonic models for the first-order spatial modes, u(1), associated with five molecular bands (labeled a–e) and two broadband continuum features (labeled ζ and η), overplotted on a binary mask of Tara and Powys Regiones (black).
The first-order principal spectra, v(1), extracted from each band isolate the dominant sources of reflectance variability across Europa’s leading hemisphere. Each mode captures a clear, physically interpretable spectral deviation from the mean profile. In the 1.65 μm water ice band, the principal spectrum reflects variations in band depth and symmetry, consistent with disordered ice with lesser bulk crystallinity. The 3.1 μm Fresnel peak's principal spectrum reflects a transition between amorphous and crystalline phases at the surface (Hansen and McCord, 2004). In the hydrogen peroxide band, v(1) reveals broadening of the 3.5 μm feature, consistent with mixed ice phases (Giguerre and Harvey, 1959). Decomposition of the CO₂ bands shows that variability in the 4.25 μm doublet reflects shifts between disordered and crystalline CO₂ profiles, while variations in the 4.38 μm ¹³CO₂ feature primarily track abundance changes (Trumbo and Brown, 2023; Villanueva et al., 2023). The two broadband continuum features also exhibit simultaneous broadening, likely related to disordered and impure ice texture (Hansen and McCord, 2004).
Our results reveal a change in ice texture concentrated in southern Tara Regio, traced by the 1.65 μm crystalline ice band, the 3.1 μm Fresnel peak, and two broadened continuum features. These co-located signals point to porous, impure ice. The broadening of the 3.5 μm H₂O₂ band and the localized CO₂ enrichment further support this texture anomaly. Our modeling shows that persistent surface crystallinity in this region likely arises from porosity rather than a thermal anomaly (Thelen et al., 2024). Since porous ice enhances volatile retention (Baragiola et al., 2003), these findings suggest that apparent surface "freshness" may thus reflect structural preservation rather than recent exposure, essential for interpreting Europa’s spectral and habitability signatures.
References
Baragiola, R. A. (2003). Planet. Space Sci., 51, 953–961.
Böker, T. et al. (2022). Astron. Astrophys., 661, A82.
Carr, M. H. et al. (1998). Nature, 391, 363–365.
Chyba, C. F. et al. (2002). Orig. Life Evol. Biosph., 32, 47–67.
Hansen, G. B. et al. (2004). J. Geophys. Res. Planets, 109, E1.
Giguerre, P. and Harvey, K. (1959). Journal of Molecular Spectroscopy, 3, 36-45.
Nordheim, T. A. et al. (2022). Planet. Sci. J., 3, 5.
Trumbo, S. K. et al. (2023). Science, 381, 1308–1311.
Trumbo, S. K. et al. (2019). Astron. J., 158, 127.
Villanueva, G. L. et al. (2023). Science, 381, 1305–1308.
Wu, P. et al. (2024). Planet. Sci. J., 5, 220.
Thelen, A. et al. (2024). Planet. Sci. J. 3, 56.
How to cite: Yoffe, G. and Shahaf, S.: Spectral decomposition reveals surface processes on Europa, EPSC-DPS Joint Meeting 2025, Helsinki, Finland, 7–12 Sep 2025, EPSC-DPS2025-1254, https://doi.org/10.5194/epsc-dps2025-1254, 2025.