
 1,1,1,1,
- 1Johns Hopkins Applied Physics Laboratory, Laurel, MD, United States of America
- 2Arizona State University, Tempe, AZ, United States of America
- 3Cornell University, Ithaca, NY, United States of America
During >17 years observing Mars from orbit, the Compact Reconnaissance Imaging Spectrometer for Mars (CRISM) collected 2 main types of spectral images, targeted images at 18 or 36 m/pixel that utilized the instrument's full 544-wavelength hyperspectral capability, and mapping image strips that returned fewer channels at reduced spatial resolution. Targeted images cover ~3% of Mars at very high resolution, focusing on key exposures that reveal primary and secondary mineral assemblages and their geologic relations. Mapping image strips cover intervening areas to provide spatial continuity in mineral mapping, find new sites for targeted observations, and allow geologic relations to be extrapolated over the Martian surface [1].
Two primary mapping modes were used. (A) VNIR+IR multispectral mapping was CRISM’s original mapping mode. CRISM spent most of its observing time in this mode or its derivatives for as long as cryocoolers for the IR detector remained functional. 73 wavelengths of returned data were selected to characterize depths of atmospheric gas and mineral absorptions known to be present from OMEGA data including olivine, pyroxene, hematite, smectite clay, and hydrated sulfate [2]. Spatial sampling at 10x pixel binning yielded a pixel scale of 180 m, covering ~86% of Mars. A subset of the data covering 39% of Mars had extended 262-channel coverage to more accurately measure subtly different absorptions due to newly discovered carbonates, hydroxysulfates, hydrated silica, and higher metamorphic grade hydrous silicates. (B) VNIR-only hyperspectral mapping was performed whenever cryocoolers were off, to map Fe-bearing silicates, oxides and sulfates. Most areas are covered by data using 5x pixel binning, yielding 90-m effective pixels including 90 VNIR channels with useful signals. Gaps are filled by VNIR mapping using 10x pixel binning, yielding 180-m effective pixels. Together, VNIR hyperspectral mapping modes cover >99% of Mars.
VNIR+IR multispectral data were assembled into a near-global mosaic of mapping strips divided into 1764 ~5°x5° tiles with a sampling of 327 pixels per degree (ppd), Multispectral Reduced Data Records or MRDRs; VNIR hyperspectral data were assembled into a parallel set of tiles with twice the spatial resolution (654 ppd), VNIR Hyperspectral Data Records or VRDRs. Both data sets are available in the PDS (https://pds-geosciences.wustl.edu/missions/mro/crism.htm). Using procedures described in detail by Seelos et al. [3] reflectance data have been processed to remove optical and instrument artifacts, correct photometric effects of illumination to a normal solar incidence, and normalize atmospheric opacities to parts of the dataset collected under clearest atmospheric conditions. Both data sets include spectral reflectance as well as derived spectral indices that serve as mineral indicators, plus pixel-by-pixel information that relates mosaicked data back to source mapping strips.
Figure 1 compares MRDR and VRDR data sets, over the first 8 Mars charts (out of 28, excluding polar regions) of VRDR tiles released to the PDS as of 7 May 2025 (494 of 1764 tiles). The "browse products" shown are combinations of spectral reflectances and/or spectral indices as defined by Viviano et al. [4]. In MRDR IR "false color" (upper left), most areas appear in shades of gray due to the relatively "flat" spectral reflectance at IR wavelengths, with the exception of pale blue and green tones in areas of hydrated mineralogy. In contrast, VNIR enhanced "true color" (lower left) varies from dark reddish gray to bright red, due to differences in coverage of gray mafic sand and rock by dust having a red visible spectral slope due to nanophase ferric oxides (npFeOx). The VRDRs have superior spatial continuity and 2x-higher spatial resolution. MRDR coverage of IR wavelengths (upper right) measures centers and shapes of broad absorption centered near 1 and 2 µm in the spectral indices BD1300, LCPINDEX2, and HCPINDEX2. The combinations of values distinguish low- and high-Ca pyroxenes, olivine, and Fe-bearing glass (in green, blue, red, and orange tones respectively). VRDR coverage of Fe2+ and Fe3+ absorptions at 0.4-1.02 µm (lower right), measured in the spectral indices BD920_2 and BDI1000VIS, discriminates low- and high-Ca pyroxene (in cyan and blue tones respectively) but does not uniquely discriminate olivine or glass. The BD530_2 and BD860_2 or BD920_2 spectral indices in the VRDRs indicate locations rich in crystalline hematite. Additional VRDR spectral indices including RBR–in concert with IR indices – can together indicate other ferric phases such as the oxyhydroxide goethite and the ferric sulfate copiapite where they occur. More than two dozen additional spectral indices in the MRDR data discriminate the wide variety of hydrated and hydroxylated silicates, oxides, and sulfates, and hydrated silica and carbonate phases detected in CRISM data [4].
SUMMARY: Over 17 years operating in Mars orbit, CRISM collected two major global spectral maps of Mars. The image strips forming each map were corrected for artifacts and normalized to clear atmospheric conditions with atmospheric gas absorptions removed. The data are available to the community as corrected spectral reflectance as well as derived spectral indices that serve as indicators of various minerals, plus pixel-by-pixel information that relates mosaicked data back to source mapping strips.
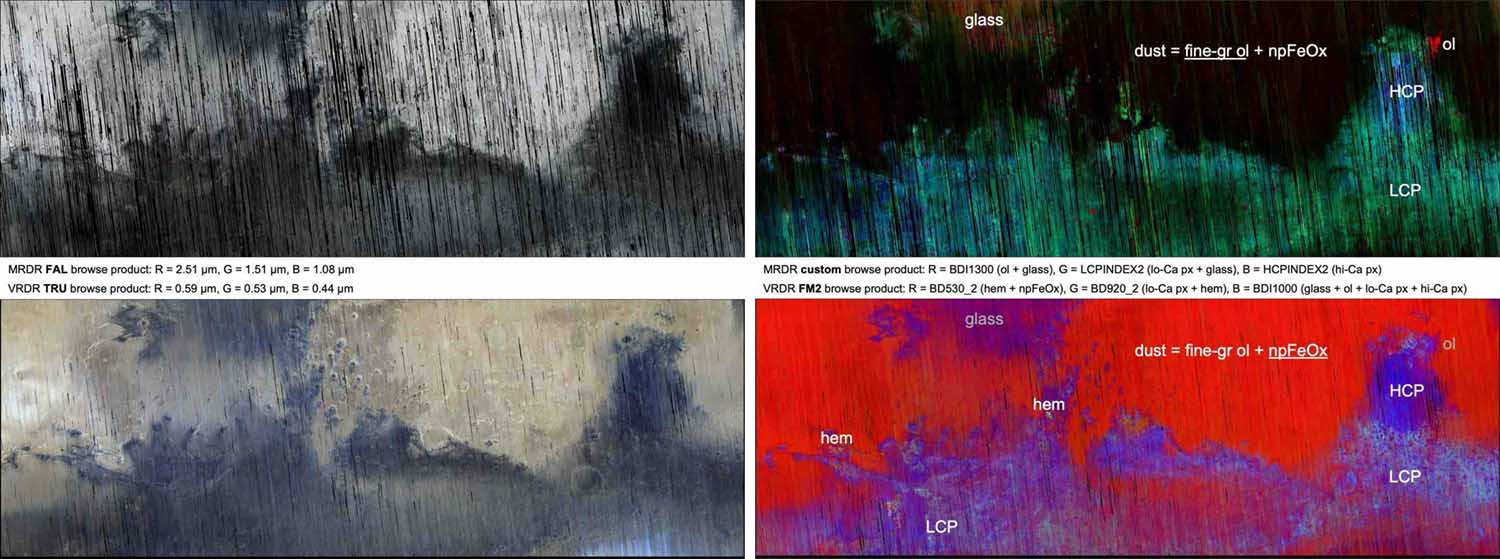
Figure 1. IR false color (upper left) and VNIR enhanced true color (lower left) browse product maps covering the first eight Mars charts of VRDR deliveries. IR (upper right) and VNIR (lower right) browse products show spectral indicators of Fe mineralogy. Spectral absorptions at IR wavelengths distinguish primary mafic mineralogies. VNIR wavelengths distinguish low- and high-Ca pyroxene as well as a number of ferric minerals including crystalline hematite.
References: [1] Murchie, S. et al. (2009) J. Geophys. Res., 114, E00D07. [2] Bibring, J.-P. et al. (2005) Science, 307, 1576-1581. [3] Seelos, F. et al. (2024) Icarus, 419, 115612. [4] Viviano, C. et al. (2014) J. Geophys. Res., 119, 1403-1431.
How to cite: Murchie, S., Seelos, F., Hancock, K., Stephens, D., Poffenbarger, R., Romeo, G., Viviano, C., Frizzell, K., and Packer, L.: CRISM Global Visible/Infrared Spectral Maps of Mars, EPSC-DPS Joint Meeting 2025, Helsinki, Finland, 7–12 Sep 2025, EPSC-DPS2025-136, https://doi.org/10.5194/epsc-dps2025-136, 2025.