Multiple terms: term1 term2
red apples
returns results with all terms like:
Fructose levels in red and green apples
Precise match in quotes: "term1 term2"
"red apples"
returns results matching exactly like:
Anthocyanin biosynthesis in red apples
Exclude a term with -: term1 -term2
apples -red
returns results containing apples but not red:
Malic acid in green apples
hits for "" in
Network problems
Server timeout
Invalid search term
Too many requests
Empty search term
TP1

This session is now established for 10 years, and typically attracts a good amount of contributions reflecting the diversity of missions and science questions related to the solid portions of, covering the broad scope of current research.
Session assets
Introduction
The Colour and Stereo Surface Imaging System (CaSSIS; Thomas et al., 2017) has been acquiring 4 m/pixel images of the martian surface since 2018, building a database of over 38,000 images in up to four spectral bands across the planet. CaSSIS NIR-PAN-BLU (NPB) and HiRISE IR-RED-BLUE (IRB) images reveal conspicuous, red-toned outcrops (RTO) at a range of scales that are distributed across the southern highlands. While visually striking, the composition, distribution, and origins of these outcrops remain unclear. Here, we present a global analysis of RTOs aimed at resolving this.
Methods
To investigate the RTO, we manually identified a selection of ~30 examples of RTO covering a range of sizes, morphologies, textures, colours, and lighting geometries in CaSSIS NPB images, and used these examples as a training dataset for a convolutional neural network (CNN), which is able to detect occurrences of RTO similar to those in the training dataset (see techniques in Bickel et al., 2024 and references therein).
The CNN assessed all >38,000 images in the CaSSIS database (as at 28/02/2024), and produced an output of 2232 detections at >60% CNN confidence level. These outputs were manually sorted to remove false positives and to assess RTO morphology/texture. True positive RTOs, as well as those from the training dataset, were compared with CRISM footprints, and those CRISM MTRDR cubes that overlapped were analysed following the standard ratioing method (e.g. McGuire et al., 2009; Murchie et al., 2007).
Results
We observe a total of 923 “true positive” RTO CaSSIS detections (e.g. Figure 1). RTOs are most common in the areas north of the Hellas and Argyre basins, in lower elevation regions of eastern Valles Marineris, and in the Nili Fossae region. These usually crop out in the ejecta of large (>10 km) craters in these areas but can also be observed in the walls of craters and on relatively flat-lying terrain. Most RTOs are associated with Noachian-aged terrains with 76% occurring within Noachian Units (Tanaka et al., 2014), 12% in Hesperian Units, 4% in Amazonian Units, and 8% in Hesperian/Amazonian Impact Units.
RTOs typically possess a blocky, massive appearance (Figure 1a), and occur as both discrete outcrops with well-defined margins (Figure 1b), interpreted as ejecta blocks, or as diffuse deposits (Figure 1c), interpreted as intermixing with other components within ejecta blankets.
CRISM spectra from RTOs reveal a consistent and broad, yet extremely weak and slightly long-shifted 1.25 μm absorption feature, consistent with partial transformation of Fe-plagioclase to maskelynite, a diaplectic amorphous glass associated with shock metamorphism from hypervelocity impact events (e.g. Jaret et al., 2015; Spudis et al., 1984).
Figure 1: False-color examples of Red-Toned Outcrops (RTOs) from across the Hellas region. a) Large blocky RTO in Terby Crater (CaSSIS NPB); b) Discrete fractured RTO north of Hellas (HiRISE IRB); c) Large diffuse RTO with some sharp boundaries NW of Hellas (CaSSIS NPB); d) RTO under younger dark material NE of Hellas (CaSSIS NPB).
Discussion
We infer RTOs to be the products of large basin-forming impacts, with their current distribution shaped by subsequent impact gardening. Their occurrence surrounding Hellas and Argyre suggests that these units are part of the original basin ejecta fields and therefore, at least in the case of Hellas, predate the Noachian. In these regions, RTOs likely derive from Fe-plagioclase-bearing massifs uplifted from depth during the impact events, now observed as degraded massifs along the basin rims (Phillips et al., 2022; Phillips and Viviano, 2025).
RTO exposures are commonly found within ejecta in impact-modified terrains superposed on the Hellas and Argyre ejecta blankets. The absence of similar features in Noachian-aged terrains outside of these ejecta fields suggests that large basin-forming impacts are a pre-requisite to exhume deeply buried plagioclase material, and that subsequent impact gardening of basin ejecta is a primary mechanism for their exposure.
Collectively, the observed distribution, morphology, and mineralogy of RTOs point to the presence of a plagioclase-rich lower crustal component that was widespread in the Pre-Noachian martian crust, likely explaining the lower-than-expected observed density of the martian crust (Knapmeyer-Endrun et al., 2021; Bouley et al., 2020; Baratoux et al., 2014). The evidence indicates that this plagioclase-rich material underwent shock metamorphism, excavation, and emplacement within the ejecta of early basin-forming events, providing a unique window into the composition and modification history of Mars’ ancient crust.
References
- Baratoux, D., et al. (2014) Journal of Geophysical Research: Planets, vol. 119, no. 7, pp. 1707–1727
- Bickel, V. T., et al. (2024) Scientific Data, vol. 11, no. 1, p. 845
- Bouley, S., et al. (2020) Nature Geoscience, vol. 13, no. 2, pp. 105–109
- Jaret, S. J., et al (2015) Journal of Geophysical Research: Planets, vol. 120, no. 3, pp. 570–587
- Knapmeyer-Endrun, B., et al. (2021) Science, vol. 373, no. 6553, pp. 438–443
- McGuire, P. C., et al. (2009) Planetary and Space Science, vol. 57, no. 7, pp. 809–815
- Murchie, S., et al. (2007) Journal of Geophysical Research E: Planets, vol. 112, no. 5, pp. 1–57
- Phillips, M. S. and Viviano, C. E. (2025) LPSC 56, Houston, Texas, abs#1653
- Phillips, M. S., et al. (2022) Geology, vol. 50, no. 10, pp. 1182–1186
- Spudis, P. D., et al. (1984) Journal of Geophysical Research, vol. 89
- Thomas, N., et al. (2017) Space Science Reviews, vol. 212, no. 3–4, pp. 1897–1944
How to cite: McNeil, J., Grindrod, P., Tornabene, L., Bickel, V., Stabbins, R., and Cuadros, J.: Seeing Red: Shocked Plagioclase as Pre-Noachian Stratigraphic Tracers, EPSC-DPS Joint Meeting 2025, Helsinki, Finland, 7–13 Sep 2025, EPSC-DPS2025-617, https://doi.org/10.5194/epsc-dps2025-617, 2025.
The Mawrth Vallis region of Mars features abundant phyllosilicate outcrops as well as smaller areas where sulfates are present. This study evaluates field sites where phyllosilicates and sulfates co-occur to assist in constraining the ancient geochemical environments on Mars. Mineral transitions at Mawrth Vallis indicate changing geochemical conditions over time - from the lower Fe-rich smectite horizon about 200 meters thick to thinner units of sulfates, Al-phyllosilicates including halloysite in some regions, then Si-rich phases at the top of the profile [1] (Fig. 1a-c). Smectites form through wet/dry cycling in generally arid environments, while halloysite requires more humid conditions. Ca-sulfates and Al-clays represent a decrease in pH from the environment supporting formation of Fe/Mg-smectite, and the jarosite outcrops indicate an even lower pH. Sulfuric gases released from Syrtis may have produced sulfates in the groundwater [2] that flowed downhill from Meridiani towards Mawrth Vallis (Fig. 1d). This could have produced acidic brines that altered the expansive Fe/Mg-smectites at Mawrth Vallis and formed pockets of sulfates.
Specific phyllosilicate and sulfate minerals are mapped using vibrational bands in CRISM images (Fig. 1a). Spectral features in the region ~1.4-2.6 µm are most useful for identifying and characterizing these minerals, including the H2O combination band near 1.91-1.92 µm. The Fe-rich smectite outcrops also exhibit Fe-OH bands near 1.42 and 2.29-2.30 µm. The Al-smectite units include Al-OH bands at 1.41-1.42 and 2.20-2.21 µm, while small locations containing halloysite/kaolinite and alunite have additional bands near 1.39-1.47, 1.75, 2.17, and 2.32 µm (Fig. 2). Areas containing jarosite have spectral bands near 1.47, 1.85, 2.22, and 2.26 µm (Fig. 3). Sites including hydrated sulfates include a drop in reflectance near 2.4-2.5 µm and Ca sulfates have a band near 1.75-1.78 µm.
Phyllosilicate - sulfate assemblages were investigated at field sites to assist in constraining the environments where these minerals form. The Painted Desert in Arizona features expansive outcrops of clay-bearing horizons (Fig. 4a), similar to Mawrth Vallis. Coordinated analyses of spectra from the field, lab, and aerial instruments of the light-toned and reddish horizons show the presence of clays and carbonates [3] (Fig. 4b-d). Sulfates are present in regions with polygonally-cracked surfaces where combinations of gypsum, jarosite, and montmorillonite are observed [4] (Fig 4ef). The south sulfur bank inside the Kilauea caldera (Fig. 5) contains a mixture of nontronite, saponite, montmorillonite, opal-A, gypsum, jarosite, and ferrihydrite due to hydrothermal alteration of ash and basalt from volcanic gases [5]. Lighter-toned outcrops are dominated by opal with some gypsum, saponite and jarosite (Fig. 5d), while the darker orange-tan layers include nontronite, ferrihydrite, and jarosite in addition to opal and gypsum (Fig. 5e). Analogs from the rainy Waimea Canyon region of Kauai include goethite, halloysite, ferrihydrite, and allophane in altered rinds on the rocks (Fig. 6). Additional sites altered under lower pH conditions contain hematite and jarosite [6].
Pedogenic alteration at the Painted Desert produced wide horizons of clay-bearing units interspersed with units of iron oxides/hydroxides and carbonates. Sulfates are observed together with phyllosilicates in regions with polygonally-cracked terrain. Jarosite and gypsum are present in a hydrothermal setting at Kilauea, while halloysite and goethite or jarosite and hematite are observed in the rainy and highly leached environment of Kauai. Observations of alteration minerals at these field sites suggest the Mawrth Vallis region of Mars experienced a largely arid environment with wet/dry cycling to produce the thick smectite profiles, with short-term periods of acidic fluids to form sulfates and strong leaching to form halloysite. Allophane likely formed on Mars when water was less abundant or colder [7].
Acknowledgements: The authors are grateful for support from NASA MDAP # 80NSSC19K1230 and NASA SSW #80NSSC23K0032.
References: [1] Bishop et al. (2020) Multiple mineral horizons in layered outcrops at Mawrth Vallis, Mars, signify changing geochemical environments on early Mars, Icarus, 341, 113634. [2] Moore & Szynkiewicz (2023) Aqueous sulfate contributions in terrestrial basaltic catchments: Implications for understanding sulfate sources and transport in Meridiani Planum, Mars, Icarus, 391, 115342. [3] McKeown et al. (2009) Coordinated lab, field, and aerial study of the Painted Desert, AZ, as a potential analog site for phyllosilicates at Mawrth Vallis, Mars, 40th LPSC, #2509. [4] Perrin et al. (2018) Mars evaporite analog site containing jarosite and gypsum at Sulfate Hill, Painted Desert, AZ, 49th LPSC, #1801. [5] Bishop et al. (2024) Solfataric alteration at the South Sulfur Bank, Kilauea, Hawaii, as a mechanism for formation of sulfates, phyllosilicates, and silica on Mars American Miner., 109, 1871–1887. [6] Gruendler et al. (2023) Characterizing Altered Volcanic Rocks from Waimea Canyon, Kauai, 54th LPSC, #1892. [7] Bishop et al. (2018) Surface clay formation during short-term warmer and wetter conditions on a largely cold ancient Mars, Nature Astronomy, 2, 206-213.
Figures:
Fig. 1 a-c) Alteration at Mawrth Vallis, Mars [1]. a) CRISM spectra of 5 distinct units. b) Diagram of altered stratigraphy. c) View of CRISM over HRSC. d) Potential formation mechanism for sulfate formation in groundwater at Mawrth Vallis, after [2].
Fig. 2 a) HRSC view of light-toned phyllosilicate-rich units. b) CRISM image FRT0000B141. c) Mineral parameter maps for Fe-smectite, halloysite, Al-smectite. d) CRISM spectra of selected outcrops compared to spectra of minerals.
Fig. 3 a) HRSC view of light-toned phyllosilicate-rich units. b) CRISM image FRT0000A425 with region containing jarosite marked by blue oval. c) Mineral parameter maps including jarosite. d) CRISM spectra of selected outcrops compared to spectra of minerals.
Fig. 4 Painted Desert, Arizona. a) Phyllosilicate-rich horizons. b-c) Close-up views of changing mineralogy. d) Comparison of HyMap aerial spectra with field and lab spectra. e) Gypsum and jarosite outcrops under polygonally-cracked terrain. f) Spectra of Painted Desert materials and lab mixtures compared to CRISM spectrum.
Fig. 5 Kilauea south sulfur bank, Hawaii. a) LG with field spectrometer. b) View of light-toned material. c) JLB sampling orange layered material. d-e) VNIR spectra of light-toned material, orange layers, and minerals.
Fig. 6 a) Waimea Canyon, Kauai. b-c) Close-up views of altered rocks. d) Spectra of selected samples compared to spectra of minerals.
How to cite: Bishop, J., Gruendler, L., Gruendler, K., Parente, M., Gross, C., Saranath, A., Itoh, Y., Gruendler, M., McKeown, N., and Murchie, S.: Constraining the Ancient Geochemical Environments that formed the Complex Phyllosilicate and Sulfate Assemblages at Mawrth Vallis Through Comparison with Field Sites, EPSC-DPS Joint Meeting 2025, Helsinki, Finland, 7–13 Sep 2025, EPSC-DPS2025-1957, https://doi.org/10.5194/epsc-dps2025-1957, 2025.
The study of Martian mineralogy provides valuable insights into its geological history and environmental conditions over time. One significant aspect of Martian mineralogy is the presence of Fe/Mg-phyllosilicates, also known as clay minerals. These phyllosilicates are important indicators of past aqueous activity on Mars, suggesting the presence of water in its early history. The formation of Fe/Mg-phyllosilicates typically occurs in environments with moderate to low temperatures and near-neutral pH conditions, where water interacts with volcanic rocks or crustal materials containing iron and magnesium. Phyllosilicates make up the majority of aqueously altered minerals on Mars and are widespread on its surface, preferably in ancient Noachian/Hesperian terrains.
Significant amounts of this mineral type have been detected from orbital measurements by the Mars Express/OMEGA and MRO/CRISM spectrometers and are recorded in the Mars Orbital Catalog of Aqueous Alteration Signatures (MOCAAS) [1]. This work concentrates on the substantial Fe/Mg-phyllosilicate deposits that were detected northwest of Argyre Planitia, one of the large impact basins in the ancient terrain of the southern hemisphere of Mars. Despite the wide-spread presence of alteration minerals in this region, no detailed studies have ever been conducted to characterize their geology and chronology.
We investigated the substantial Fe/Mg-phyllosilicate deposits that were detected northwest on Argyre Planitia to shed light on to what extent these hydrated minerals correlate with deposits and structures that were formed by the formation of the Argyre basin, such as impact-induced hydrothermal alteration processes and impact tectonics.
We used remote sensing data (HRSC [2], CTX [3], THEMIS [4], HiRISE [5], MGS MOLA - MEX HRSC Blended DEM Global [6], CaSSIS [7]) to produce a photogeological map with a mapping scale of 1:100,000 and boundaries of 41.5°S to 36.5°S and 298°E to 304°E. The mapping was accomplished on CTX whereas the other dataset were used to validate different surface units. In particular, we used multispectral colour data from HRSC and CaSSIS to discriminate candidate units in terms of their mineralogical composition.
Our region of interest features widespread fractured units that are embayed between two presumably tectonic, scarp-bounded blocks with an elongation approximately concentric around Argye, suggesting a impact-controlled structural history. The unit “fractures_light_tones_plains” and “smooth_light_toned_plain” are considered the main clay-bearing units of interest due to their spatial correspondence with the areas where MOCAAS detected Fe/Mg-phyllosilicates. The region also displays abundant fractures forming polygonal ground, a characteristic that is typically associated with phyllosilicates elsewhere on Mars.
References
[1] Carter, J., Riu, L., Poulet, F., Bibring, J.-P., Langevin, Y., Gondet, B., 2023. A Mars orbital catalog of aqueous alteration signatures (MOCAAS). Icarus 389, 115164, https://doi.org/10.1016/j.icarus.2022.115164.
[2] Jaumann, R., Neukum, G., Behnke, T., Duxbury, T.C., Eichentopf, K., Flohrer, J., Gasselt, S.v., Giese, B., Gwinner, K., Hauber, E., Hoffmann, H., Hoffmeister, A., Köhler, U., Matz, K.-D., McCord, T.B., Mertens, V., Oberst, J., Pischel, R., Reiss, D., Ress, E., Roatsch, T., Saiger, P., Saiger, F., Scholten, F., Schwarz, G., Stephan, K., Wählisch, M., the HRSC Co-Investigator Team, 2007. The high-resolution stereo camera (HRSC) experiment on Mars Express: Instrument aspects and experiment conduct from interplanetary cruise through the nominal mission. Planetary and Space Science 55, 928-952[3] Malin, M. C., Bell, J. F., Cantor, B. A., Caplinger, M. A., Calvin, W. M., Clancy, R. T., et al. (2007). Context camera investigation on board the Mars Reconnaissance Orbiter. Journal of Geophysical Research, 112, E05S04. https://doi.org/10.1029/2006JE002808.
[3] Malin, M. C., Bell, J. F., Cantor, B. A., Caplinger, M. A., Calvin, W. M., Clancy, R. T., et al. (2007). Context camera investigation on board the Mars Reconnaissance Orbiter. Journal of Geophysical Research, 112, E05S04. https://doi.org/10.1029/2006JE002808
[4] Christensen, P.R., Jakosky, B.M., Kieffer, H.H. et al. The Thermal Emission Imaging System (THEMIS) for the Mars 2001 Odyssey Mission. Space Science Reviews 110, 85–130 (2004). https://doi.org/10.1023/B:SPAC.0000021008.16305.94.
[5] McEwen, A. S., Eliason, E. M., Bergstrom, J. W., Bridges, N. T., Hansen, C. J., Delamere, W. A., et al. (2007). Mars Reconnaissance Orbiter's High Resolution Imaging Science Experiment (HiRISE). Journal of Geophysical Research, 112(E5). https://doi.org/10.1029/2005JE002605.
[6] Smith, D., Zuber, M., Frey, H., Garvin, J., Head, J., Muhleman, D., . . . Banerdt, W. (2001). Mars Orbiter Laser Altimeter: Experiment summary after the first year of global mapping of Mars. Journal of Geophysical Research: Planets, 106(E10), 23689-23722. doi:10.1029/2000JE001364.
[7] Thomas, N., Cremonese, G., Ziethe, R. et al. The Colour and Stereo Surface Imaging System (CaSSIS) for the ExoMars Trace Gas Orbiter. Space Sci Rev 212, 1897–1944 (2017). https://doi.org/10.1007/s11214-017-0421-1.
How to cite: Da Silva Encarnacao, M., Tirsch, D., Hauber, E., Rangarajan, V., Machado, P., and Peixinho, N.: Mapping of phyllosilicates NW of Argyre basin (Mars) with Mars Express/HRSC colour data, EPSC-DPS Joint Meeting 2025, Helsinki, Finland, 7–13 Sep 2025, EPSC-DPS2025-1729, https://doi.org/10.5194/epsc-dps2025-1729, 2025.
Introduction:
Iron plays a pivotal role in shaping Mars’ surface processes, influencing its climate evolution, and affecting its potential for habitability. Over the past decade, data from Mars exploration missions have significantly deepened our understanding of iron geochemical cycling -- the set of processes through which iron transitions between different oxidation states and mineral forms within the Martian surface environment. These transformations are closely linked to Martian hydrological activity, atmospheric changes, and redox conditions that may have supported life. This review synthesizes key advances in our knowledge of iron cycling on Mars from recent years. It examines the primary sources and mineral forms of iron, traces the temporal evolution of iron cycling across geological epochs, explores its environmental and climatic implications, and reviews mechanistic insights gained from experimental and modeling studies. The paper also discusses unresolved scientific debates and methodological challenges, providing perspectives to guide future study.
Sources and forms of Fe on Mars
Iron inventory on Mars primarily originates from mafic and ultramafic igneous rocks formed through planetary differentiation and volcanic activity. Over time, these iron-bearing silicates underwent aqueous alteration, giving rise to a diverse suite of secondary minerals. These include iron oxides (e.g., hematite, magnetite), hydroxides (e.g., goethite, ferrihydrite), sulfates (e.g., jarosite), carbonates (e.g., siderite), and iron-rich phyllosilicates (e.g., nontronite) [1,2]. Notable new discoveries from the rover missions include siderite-rich layers in Gale Crater, suggesting CO₂ sequestration in ancient Martian lakes [3] and at Jezero Crater, Perseverance identified coarse-grained olivine-rich igneous rocks and serpentinized fragments, indicative of hydrothermal activity [4]. Furthermore, spectral analyses now suggest that Martian dust is dominated not by crystalline hematite, but by ferrihydrite, an amorphous iron oxyhydroxide typically formed under low-temperature aqueous conditions [2].
Temporal evolution of Fe cycling
Iron cycling on Mars closely mirrors the planetary transition from early wet or icy conditions to the cold, arid environment observed today. During the Noachian period (4.1-3.7 Ga), iron was likely highly mobile in the form of Fe²⁺ within neutral to mildly acidic aqueous environments. Evidence from Gale Crater suggests the presence of redox-stratified lake systems, characterized by magnetite and ferrous phyllosilicates at depth, with more oxidized iron phases near the surface [5]. Ferrihydrite-rich sediments may also have formed under these conditions. In the Hesperian epoch (~3.7-3.0 Ga), increasingly oxidizing and acidic conditions favored the formation of iron sulfates, such as jarosite. The detection of high-Mn oxides by the Curiosity rover has been interpreted as evidence for transiently oxygen-rich episodes[6], though alternative oxidants, such as chlorates or UV-driven photochemical processes, remain plausible [7]. During the Amazonian period (~3.0 Ga to present), extreme cold and aridity severely limited aqueous alteration. Iron cycling during this time has been dominated by the oxidation of surface-exposed Fe²⁺ minerals and the wind-driven redistribution of iron-rich dust.
Climatic and habitability implications
Iron minerals function as valuable environmental proxies on Mars. For example, ferrihydrite is indicative of cold, aqueous conditions, while jarosite and other sulfates point to acidic, evaporative environments. The occurrence of siderite implies near-neutral pH and elevated CO₂ levels, suggesting a more temperate early climate [3]. Beyond environmental reconstruction, iron redox cycling may have supported microbial metabolisms. Nitrate-dependent Fe²⁺ oxidation has been proposed as an energetically favorable pathway in early Martian lakes, which likely contained both dissolved Fe²⁺ and nitrate [8]. Moreover, oxidized iron minerals may have served as long-term sinks for oxygen, helping to buffer the planetary atmospheric composition and influence climate evolution. In the present day, iron-bearing dust continues to affect Mars energy balance by modulating solar radiation and atmospheric dynamics.
Future directions
Iron cycling on Mars has not only recorded environmental transitions but has also actively shaped them. Processes such as serpentinization likely contributed to abiotic hydrogen production and may be linked to episodic methane detections. At the same time, extensive Fe oxidation may have consumed significant amounts of atmospheric O₂, hindering its long-term accumulation. Upcoming missions, including Mars sample return, will enable detailed laboratory analyses of iron speciation and isotopic composition, including isotopic signatures of other elements, critical for constraining the timing of redox transitions and evaluating potential biosignatures. Key open questions remain: When and how did the Fe oxidation occur on Mars? Did Mars undergo a global oxidation event? How deeply did oxidation penetrate the crust? Answering these questions will require integrated approaches that combine planetary missions, laboratory experiments, and advanced geochemical modeling.
Acknowledgements: This research was supported by the National Natural Science Foundation of China (Grant Nos. 42441803, 4237304).
References
[1] Fraeman, A. A. et al. (2020). J. Geophys. Res. Planets, 125, e2020JE006527.
[2] Valantinas, A. et al. (2025). Nat. Commun., 16, 1712.
[3] Tutolo, B. M. et al. (2025). Science, 370, 270-274.
[4] Farley, K. A. et al. (2022). Science, 377, 1321-1327.
[5] Hurowitz, J. A. et al. (2017). Science, 356, eaah6849.
[6] Lanza, N. L. et al. (2016). Geophys. Res. Lett., 43, 7398-7407.
[7] Mitra, K. et al. (2022). J. Geophys. Res. Planets, 127, e2021JE007067.
[8] Bryce, C. et al. (2018). Front. Microbiol., 9, 513.
How to cite: Zhao, Y.: Iron Geochemical Cycling on Mars: A Temporal and Planetary Perspective, EPSC-DPS Joint Meeting 2025, Helsinki, Finland, 7–13 Sep 2025, EPSC-DPS2025-1488, https://doi.org/10.5194/epsc-dps2025-1488, 2025.
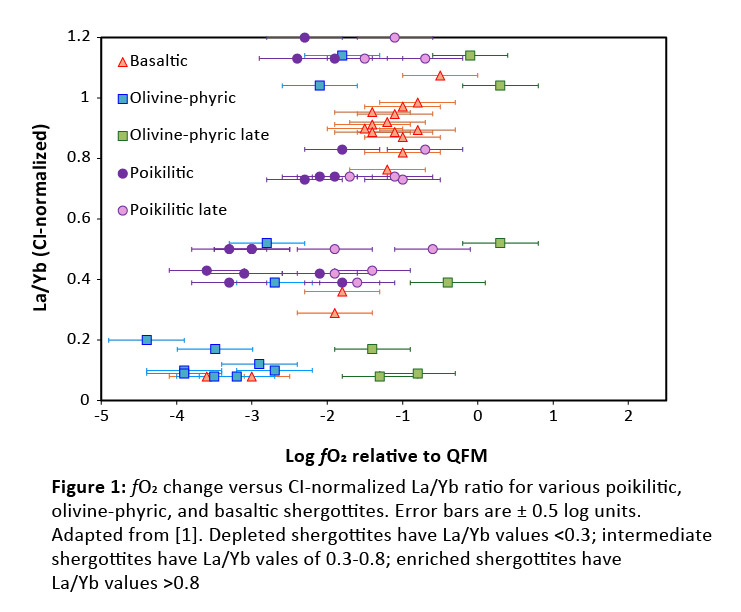
Introduction: Martian meteorites are currently the only samples on Earth available to study Mars. These samples comprise mainly (>80% by number) shergottite-type rocks, which are basaltic to lherzolitic [1]. Shergottites provide valuable information regarding the conditions of the martian interior, including its chemical composition and redox state. The redox state of shergottites of various petrologic types has been estimated (Fig. 1), and there appears to be a correlation between oxidation state and relative enrichment/depletion of incompatible trace elements (ITEs), with rocks that are enriched in ITEs also being more oxidized. An additional observation is that shergottites undergo extensive oxidation during their formation [2-4], with an increase in fO2 of 1-3 log units. Auto-oxidation can increase fO2 by a maximum of ~0.5 log units [3, 5] and thus cannot solely explain this change. Degassing of volatiles had been suggested as an alternative mechanism to oxidize these rocks [2-6]. Recent studies on the solubility of C, S, and H species in martian compositions [7-12], have allowed for Mars-appropriate degassing models to be developed, like Magma and Gas Equilibrium Calculation (MAGEC) [13]. MAGEC allows a user to specify the melt composition, pressure, temperature, and starting fO2 and calculates the proportion of volatile species that would exsolve from the melt, and the fO2 of the remaining melt. This study uses the program MAGEC to evaluate the effect of volatile degassing on the redox evolution of shergottites.
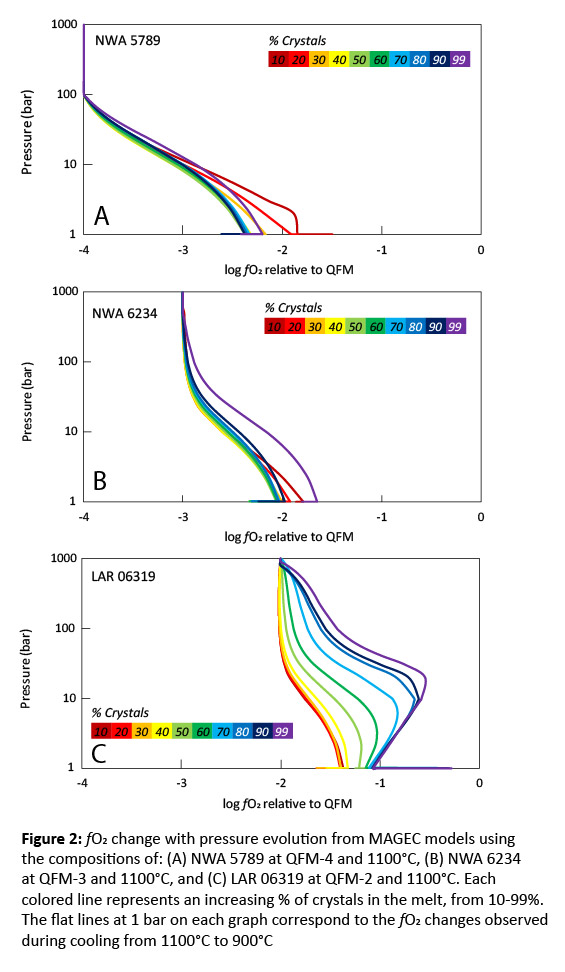
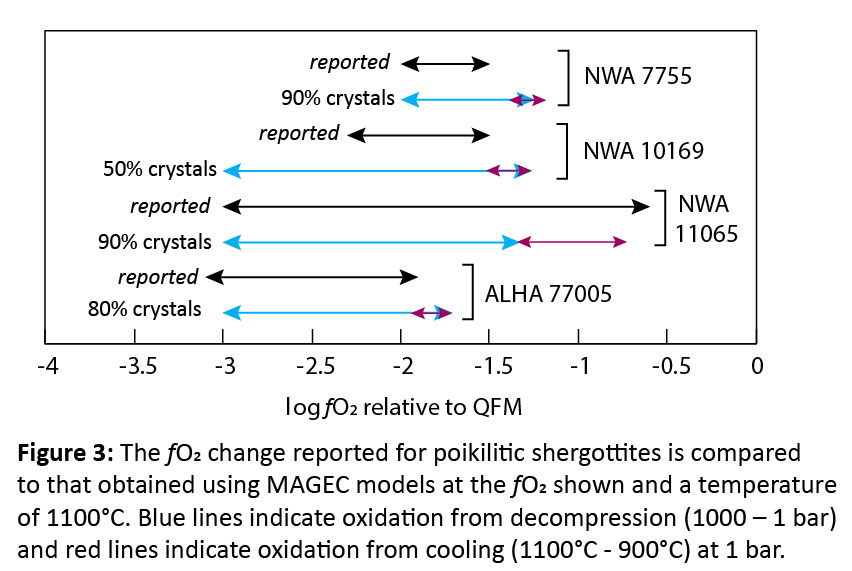
Methods: Various shergottite compositions were tested to capture the diversity within the group. The bulk compositions of olivine-phyric shergottites Northwest Africa (NWA) 5789 [14], NWA 6234 [15], and Larkman Nunatak (LAR) 06319 [16] were used, as these samples represent a mantle melt or closely approximate one, and thus, serve as representations of the martian interior. Additionally, the parental melt compositions of poikilitic shergottites NWA 7755, NWA 10169, NWA 11065, and Allan Hills (ALHA) 77005, estimated from their melt inclusions [6, 17], were used. Poikilitic shergottites were included in this study as they display some of the largest fO2 variations. To evaluate how changing melt composition can affect volatile degassing, all compositions were crystallized at 1 kbar at an fO2 of QFM-4, QFM-3, or QFM-2, using rhyolite-MELTS [18, 19]. The melt composition was recorded for every 10% of crystals formed, from 10%-99% crystals. Degassing models were run for every 10% increase in crystals/decrease in melt, with degassing from decompression occurring from 1000-1 bar at a temperature of 1100°C, 1050°C, 1000°C, or 950°C, and degassing from cooling occurring at 1 bar from the initial temperature down to 900°C. These models were run at an fO2 of QFM-4, QFM-3, or QFM-2, with 0.3 wt.% H2O, 0.08 wt.% CO2, and 0.5 wt.% S added. The volatile abundances used in this study are based on H, C, and S abundances estimated for the martian mantle and crust [7, 11, 20-24].
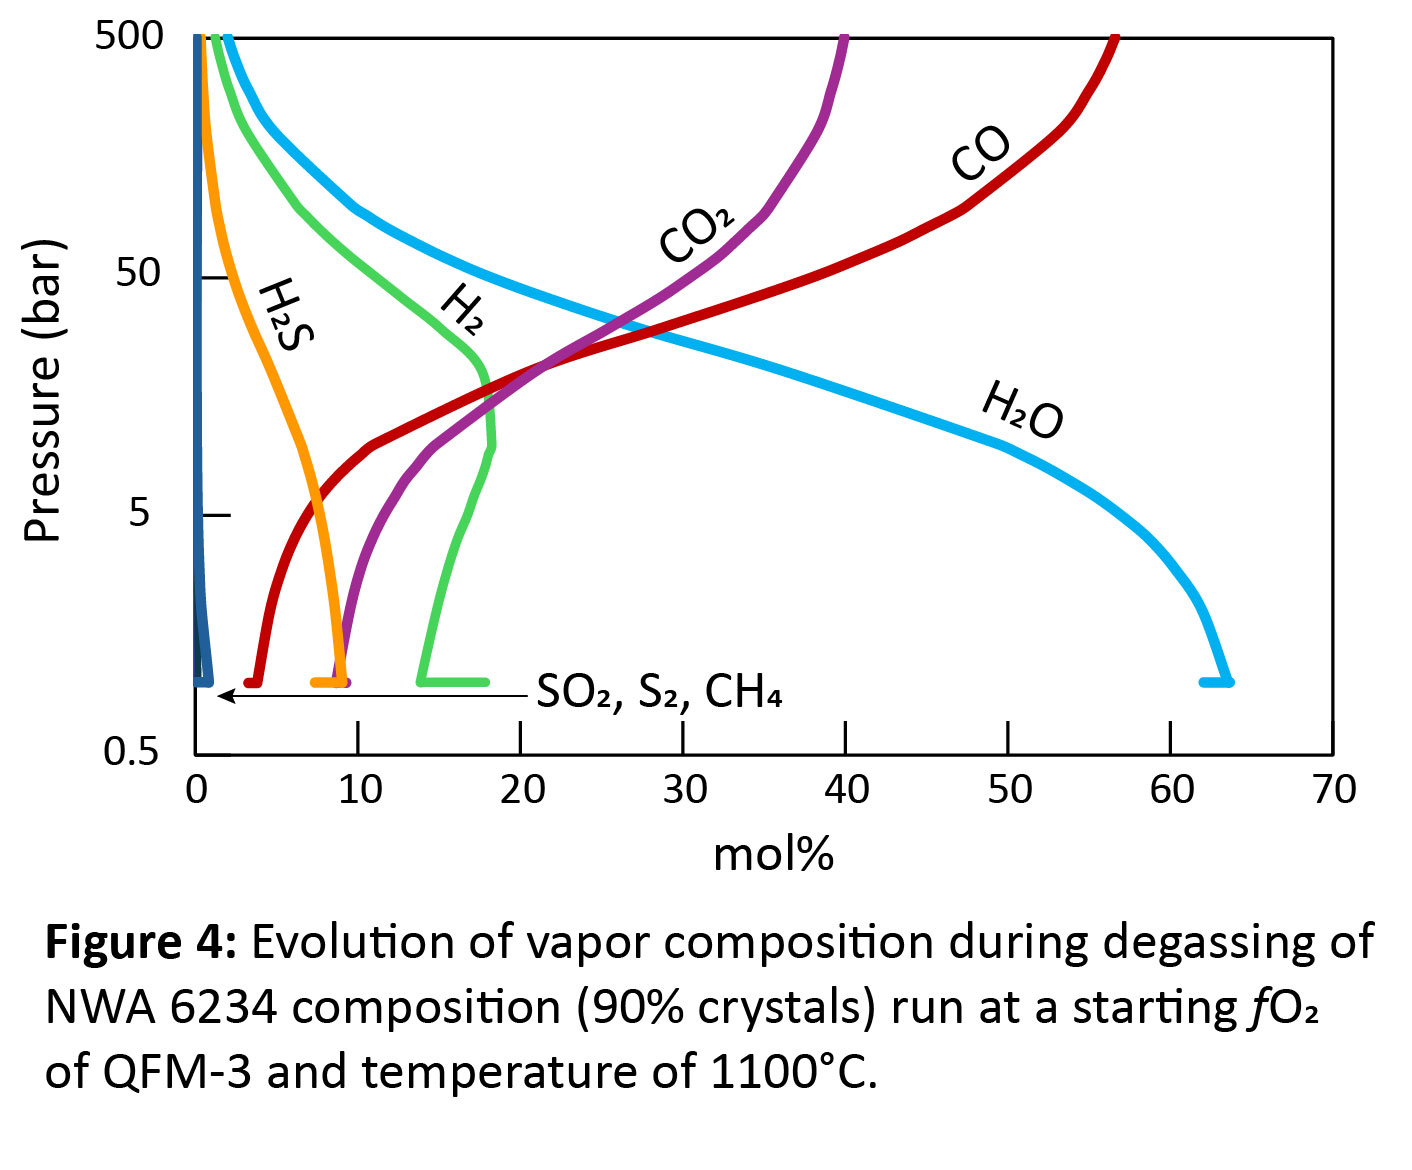
Results and Discussion: All models displayed oxidation through degassing from decompression (Figs. 2-3). However, the extent of oxidation depends on the composition of the melt and the initial fO2 of the melt before any degassing. While degassing from decompression consistently increased fO2, degassing during cooling generally decreased fO2, unless the melt was highly evolved (90-99% crystals)(Figs. 2-3). The composition of the vapor as the sample degassed during decompression was similar for all model runs. Initially, the vapor consisted of C-species (Fig. 4), which did not lead to significant changes in fO2 (Fig. 1); however, at pressures <100 bar, H-species become dominant, which is when the largest oxidative increases occur. For NWA 5789, the maximum oxidative increase (Δ+1.5) occurred when the melt had only crystallized 10-20%. Generally, however, the runs that showed the largest oxidative increases were those where the melt had crystallized 90-99% (Figs. 2-4). The largest increase in fO2 occurred in models run at QFM-4, with a Δ+1.5-2.75 log unit change seen. The smallest redox change occurred in models run at QFM-2, with a Δ+0.5-1 log unit change. This may explain why depleted and intermediate shergottites (Fig. 1) show the largest fO2 changes – they have magmatic fO2s of QFM-3 to QFM-4. The oxidative changes reported in the poikilitic shergottites studied could be replicated with the degassing models (Fig. 2). However, samples that had the greatest increase in fO2 required extensive crystallization (90-99%) to have occurred before degassing. This work suggests that the large fO2 changes seen in shergottites do not require martian magmas to be particularly hydrous to degas or require extensive auto-oxidation to occur. Additional models attempting to replicate the redox changes of other poikilitic, olivine-phyric, and basaltic/gabbroic shergottites are ongoing.
References: [1] Herd C.D.K., and Benaroya S. (submitted). [2] Castle N. and Herd C.D.K. 2017. MaPS 52, 125–146. [3] Peslier A.H. et al. 2010. GCA 74, 4543–4576. [4] Rahib R.R. et al. 2019. GCA 266, 463–496. [5] Shearer C.K. et al. 2013. GCA 120, 17–38. [6] Combs, L.M. et al 2019. GCA 266, 435–462. [7] Ardia P. et al. 2013. GCA 114, 52–71. [8] Armstrong L.S. et al. 2015. GCA 171, 283–302. [9] Ding, S. et al. 2014. GCA 131, 227–246. [10] Iacono-Marziano G. et al. 2012. GCA 97, 1–23. [11] Li Y. et al. 2017. JGR: Planets 122, 1300–1320. [12] Stanley B.D. et al. 2014. GCA 129, 54–76. [13] Sun C. and Lee C-T. 2022. GCA 338, 302–321. [14] Gross J. et al. 2011. MaPS 46, 116–133. [15] Filiberto J. et al. 2012. MaPS 47, 1256–1273. [16] Basu Sarbadhikari A. et al. 2009. GCA 73, 2190–2214. [17] O’Neal E.W. et al. 2024. GCA 373, 122–135. [18] Ghiorso M.S. and Gualda G.A.R. 2015. Cont. Min. & Petro. 169, 53. [19] Gualda, G.A.R. et al. 2012. J. of Petro. 53, 875–890. [20] Gaillard F. et al. 2013. Space Sci. Rev. 174, 251–300. [21] McCubbin F.M. et al. 2012. Geology 40, 683–686. [22] Paquet M. et al. 2021. GCA 293, 379–398. [23] Righter K. et al. 2009. EPSL 288, 235–243. [24] Stanley B.D. et al. 2011. GCA 75, 5987–6003.
How to cite: Benaroya Fucile, S. and Herd, C. D. K.: Degassing as the cause of the large redox variations seen in shergottites, EPSC-DPS Joint Meeting 2025, Helsinki, Finland, 7–13 Sep 2025, EPSC-DPS2025-873, https://doi.org/10.5194/epsc-dps2025-873, 2025.
Please decide on your access
Please use the buttons below to download the supplementary material or to visit the external website where the presentation is linked. Regarding the external link, please note that Copernicus Meetings cannot accept any liability for the content and the website you will visit.
Forward to presentation link
You are going to open an external link to the presentation as indicated by the authors. Copernicus Meetings cannot accept any liability for the content and the website you will visit.
We are sorry, but presentations are only available for users who registered for the conference. Thank you.
During >17 years observing Mars from orbit, the Compact Reconnaissance Imaging Spectrometer for Mars (CRISM) collected 2 main types of spectral images, targeted images at 18 or 36 m/pixel that utilized the instrument's full 544-wavelength hyperspectral capability, and mapping image strips that returned fewer channels at reduced spatial resolution. Targeted images cover ~3% of Mars at very high resolution, focusing on key exposures that reveal primary and secondary mineral assemblages and their geologic relations. Mapping image strips cover intervening areas to provide spatial continuity in mineral mapping, find new sites for targeted observations, and allow geologic relations to be extrapolated over the Martian surface [1].
Two primary mapping modes were used. (A) VNIR+IR multispectral mapping was CRISM’s original mapping mode. CRISM spent most of its observing time in this mode or its derivatives for as long as cryocoolers for the IR detector remained functional. 73 wavelengths of returned data were selected to characterize depths of atmospheric gas and mineral absorptions known to be present from OMEGA data including olivine, pyroxene, hematite, smectite clay, and hydrated sulfate [2]. Spatial sampling at 10x pixel binning yielded a pixel scale of 180 m, covering ~86% of Mars. A subset of the data covering 39% of Mars had extended 262-channel coverage to more accurately measure subtly different absorptions due to newly discovered carbonates, hydroxysulfates, hydrated silica, and higher metamorphic grade hydrous silicates. (B) VNIR-only hyperspectral mapping was performed whenever cryocoolers were off, to map Fe-bearing silicates, oxides and sulfates. Most areas are covered by data using 5x pixel binning, yielding 90-m effective pixels including 90 VNIR channels with useful signals. Gaps are filled by VNIR mapping using 10x pixel binning, yielding 180-m effective pixels. Together, VNIR hyperspectral mapping modes cover >99% of Mars.
VNIR+IR multispectral data were assembled into a near-global mosaic of mapping strips divided into 1764 ~5°x5° tiles with a sampling of 327 pixels per degree (ppd), Multispectral Reduced Data Records or MRDRs; VNIR hyperspectral data were assembled into a parallel set of tiles with twice the spatial resolution (654 ppd), VNIR Hyperspectral Data Records or VRDRs. Both data sets are available in the PDS (https://pds-geosciences.wustl.edu/missions/mro/crism.htm). Using procedures described in detail by Seelos et al. [3] reflectance data have been processed to remove optical and instrument artifacts, correct photometric effects of illumination to a normal solar incidence, and normalize atmospheric opacities to parts of the dataset collected under clearest atmospheric conditions. Both data sets include spectral reflectance as well as derived spectral indices that serve as mineral indicators, plus pixel-by-pixel information that relates mosaicked data back to source mapping strips.
Figure 1 compares MRDR and VRDR data sets, over the first 8 Mars charts (out of 28, excluding polar regions) of VRDR tiles released to the PDS as of 7 May 2025 (494 of 1764 tiles). The "browse products" shown are combinations of spectral reflectances and/or spectral indices as defined by Viviano et al. [4]. In MRDR IR "false color" (upper left), most areas appear in shades of gray due to the relatively "flat" spectral reflectance at IR wavelengths, with the exception of pale blue and green tones in areas of hydrated mineralogy. In contrast, VNIR enhanced "true color" (lower left) varies from dark reddish gray to bright red, due to differences in coverage of gray mafic sand and rock by dust having a red visible spectral slope due to nanophase ferric oxides (npFeOx). The VRDRs have superior spatial continuity and 2x-higher spatial resolution. MRDR coverage of IR wavelengths (upper right) measures centers and shapes of broad absorption centered near 1 and 2 µm in the spectral indices BD1300, LCPINDEX2, and HCPINDEX2. The combinations of values distinguish low- and high-Ca pyroxenes, olivine, and Fe-bearing glass (in green, blue, red, and orange tones respectively). VRDR coverage of Fe2+ and Fe3+ absorptions at 0.4-1.02 µm (lower right), measured in the spectral indices BD920_2 and BDI1000VIS, discriminates low- and high-Ca pyroxene (in cyan and blue tones respectively) but does not uniquely discriminate olivine or glass. The BD530_2 and BD860_2 or BD920_2 spectral indices in the VRDRs indicate locations rich in crystalline hematite. Additional VRDR spectral indices including RBR–in concert with IR indices – can together indicate other ferric phases such as the oxyhydroxide goethite and the ferric sulfate copiapite where they occur. More than two dozen additional spectral indices in the MRDR data discriminate the wide variety of hydrated and hydroxylated silicates, oxides, and sulfates, and hydrated silica and carbonate phases detected in CRISM data [4].
SUMMARY: Over 17 years operating in Mars orbit, CRISM collected two major global spectral maps of Mars. The image strips forming each map were corrected for artifacts and normalized to clear atmospheric conditions with atmospheric gas absorptions removed. The data are available to the community as corrected spectral reflectance as well as derived spectral indices that serve as indicators of various minerals, plus pixel-by-pixel information that relates mosaicked data back to source mapping strips.
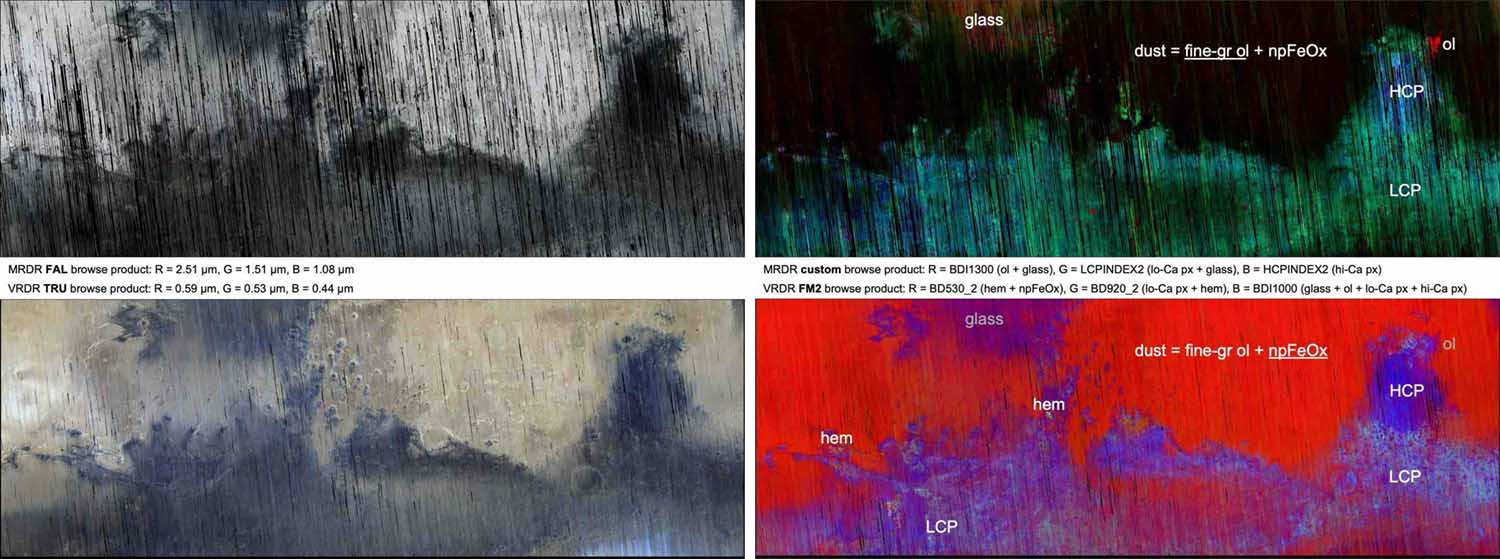
Figure 1. IR false color (upper left) and VNIR enhanced true color (lower left) browse product maps covering the first eight Mars charts of VRDR deliveries. IR (upper right) and VNIR (lower right) browse products show spectral indicators of Fe mineralogy. Spectral absorptions at IR wavelengths distinguish primary mafic mineralogies. VNIR wavelengths distinguish low- and high-Ca pyroxene as well as a number of ferric minerals including crystalline hematite.
References: [1] Murchie, S. et al. (2009) J. Geophys. Res., 114, E00D07. [2] Bibring, J.-P. et al. (2005) Science, 307, 1576-1581. [3] Seelos, F. et al. (2024) Icarus, 419, 115612. [4] Viviano, C. et al. (2014) J. Geophys. Res., 119, 1403-1431.
How to cite: Murchie, S., Seelos, F., Hancock, K., Stephens, D., Poffenbarger, R., Romeo, G., Viviano, C., Frizzell, K., and Packer, L.: CRISM Global Visible/Infrared Spectral Maps of Mars, EPSC-DPS Joint Meeting 2025, Helsinki, Finland, 7–13 Sep 2025, EPSC-DPS2025-136, https://doi.org/10.5194/epsc-dps2025-136, 2025.
Introduction
Earth's prebiotic chemistry is based on water and thermal sources (internal or external to the Earth)1,2. In contrast, the prebiotic chemistry of extraterrestrial systems (Mars, Europa, Titan, Enceladus, etc.) is primarily driven by radiation sources3–5. Recent work leveraging Martian and ocean world natural and synthetic analog materials was used to classify biotic and abiotic organics in the context of multiple planetary missions (with Curiosity, Perseverance, Rosalind Franklin, and Dragonfly)6–9. Our experiments yielded a chemical network that abiotically produced building blocks of life (e.g., amino acids up to small-peptides and thiamine and nucleobases up to nucleotides) when synthetic analogs were hydrolyzed in contact with salts and/or exposed to X-/Ɣ-rays and proton irradiation7,10. The different irradiation simulations on natural and synthetic analog materials analyzed by spaceflight instruments and/or high-resolution mass spectrometry assessed the question: How fast may the transition from prebiotic abiotic chemistry to biotic chemistry take place? A “primitive biochemistry transition” would occur and contradicts the expectation of a clear biotic-abiotic boundary between the production of polymers abiotically and biologically in a primitive environment. Indeed, our experiments and some meteoritic data revealed the production of small biopolymers abiotically from a few hundred to tens of thousands of years10–12.
Materials and Methods
To address the influence of different radiation sources on organic matter transformation as a pure standard or in a matrix/medium analog to extraterrestrial surfaces, we got access to multiple radiation facilities (SOLEIL-France and CLS-Canada synchrotron for X-rays, GSFC-NASA-USA for Ɣ-ray and protons radiations) and analyzed with X-ray, infrared spectroscopy and GC-MS/orbitrap.
To simulate Mars near surface environment, we first studied soft/mid X-rays that could be indirectly produced by the main elements in the Martian regolith (secondary X-rays by carbon (0.28 keV), silica (1.74 keV), sulfur (2.31 keV), chlorine (2.62 keV), or iron (6.40 keV)). Those experiments focused on amino acids (L-Ala, L or D/L-Phe), peptides (Ala-Gly), carboxylic acids (trimesic, lignoceric, and benzoic acids), nucleobases (adenine and uracil), and organics detected by the Sample Analysis at Mars (SAM) at Gale crater (chlorobenzene and thiophene).
We then simulated the radiative conditions at higher energies for Mars and ocean worlds (using γ-rays at 1-300 krad equivalent to 6 months-1000 Titan years’ simulation, for instance, and protons at 200 MeV – e.g., a few Titan months) and chemical environment that tropospheric aerosols or surface deposits may undergo on Titan to forecast Dragonfly operations, analysis, and interpretations.
Results
Low radiation energies enhance the production of building blocks of life (e.g., nucleobases, amino acids, sugars) (Fig. 1).
Low eradiation energies induce interactions between organic matter and inorganic soluble or solid material (bond and/or form organo-mineral/salt products).
While low energy radiation enhanced the production of building blocks of life (BBLs), high energy radiation degraded faster the prebiotic precursors than produced the BBLs (Fig. 2). High radiation energies (photons and particles) benefit to the polymerization.
Conclusions
Within protected environments (e.g., Mars subsurface environments – below 10 cm – from SAM-MSL data and investigation for MOMA-ExoMars), biosignatures may be preserved for at least 100 million years thanks to salts.
A “primitive biochemistry transition” may have occurred in crater impacts few billion years ago (e.g., at Gale and Jezero craters) and contradicts the expectation of a clear biotic-abiotic boundary between the production of polymers abiotically and biologically in a primitive environment. Indeed, our experiments and some meteoritic data revealed the abiotic production of small biopolymers from a few hundred to tens of thousands of years driven by radiation and a catalytic substrate.
References
- Westall, F. et al. A Hydrothermal-Sedimentary Context for the Origin of Life. Astrobiology 18, 259–293 (2018).
- Westall, F., Brack, A., Fairén, A. G. & Schulte, M. D. Setting the geological scene for the origin of life and continuing open questions about its emergence. Frontiers in Astronomy and Space Sciences 9, (2023).
- Cooper, J. F., Johnson, R. E., Mauk, B. H., Garrett, H. B. & Gehrels, N. Energetic Ion and Electron Irradiation of the Icy Galilean Satellites. Icarus 149, 133–159 (2001).
- Cockell, C. S. & Andrady, A. L. The Martian and extraterrestrial UV radiation environment--1. Biological and closed-loop ecosystem considerations. Acta Astronaut 44, 53–62 (1999).
- Dartnell, L. R., Desorgher, L., Ward, J. M. & Coates, A. J. Modelling the surface and subsurface Martian radiation environment: Implications for astrobiology. Geophysical Research Letters 34, (2007).
- Boulesteix, D. et al. Geochemical and Metabolomic study of few Yellowstone spring systems over a range of pH. in Life in the Sub Surface: Habitats, Species, Metabolism and Survival Strategies (Angra do Heroismo, Portugal, 2023).
- Buch, A. et al. Influence of the secondary X-Rays on the organic matter at Mars’ near-surface. in AGU Fall Meeting 2022 P12A-08 (Chicago, United States, 2022).
- Boulesteix, D. et al. Extremophile Metabolite Study to Detect Potential Biosignatures and Interpret Future Gas Chromatography-Mass spectrometry Ocean Worlds in situ analysis (e.g. Dragonfly mission with its DraMS instrument and EuropaLander with its EMILI instrument). in AGU Fall Meeting Abstracts vol. 2022 P55G-1650 (2022).
- Millan, M. et al. Sedimentary Organics in Glen Torridon, Gale Crater, Mars: Results From the SAM Instrument Suite and Supporting Laboratory Analyses. Journal of Geophysical Research: Planets 127, e2021JE007107 (2022).
- Boulesteix, D. et al. Titan Simulation for DraMS Analysis and Prebiotic Chemistry Interpretation Using Analog Materials Exposed to Gamma-rays and Protons. AGU24 (2024).
- Schmitt-Kopplin, P. et al. High molecular diversity of extraterrestrial organic matter in Murchison meteorite revealed 40 years after its fall. Proceedings of the National Academy of Sciences 107, 2763–2768 (2010).
- Barks, H. L. et al. Guanine, adenine, and hypoxanthine production in UV-irradiated formamide solutions: relaxation of the requirements for prebiotic purine nucleobase formation. ChemBioChem 11, 1240–1243 (2010).
How to cite: Boulesteix, D., Buch, A., Masson, G., Szopa, C., Freissinet, C., Trainer, M., Eigenbrode, J., and Chou, L.: Radiation-driven Prebiotic Chemistry and Biosignatures Detection, EPSC-DPS Joint Meeting 2025, Helsinki, Finland, 7–13 Sep 2025, EPSC-DPS2025-411, https://doi.org/10.5194/epsc-dps2025-411, 2025.
Keywords: Polygon, Qaidam Basin, Subsurface fluid, Halite crust, Gypsum raised rim, Mars
Abstract:
Polygonal landforms ranging in size from a few meters to several hundred meters are present in ancient salt playas on Earth and Mars (Anglés and Li, 2017). The formation of these landforms may provide information about the paleoclimate of Mars. The Qaidam Basin is one of the highest, largest, and driest deserts on Earth, located in a dry, cold, and high ultraviolet environment similar to the surface of Mars (Xiao et al., 2017). The historically hyperarid climate of the Qaidam Basin has allowed the development of extensive polygonal landforms with diverse geometric and genetic types. Here we report a terrain characterized by polygons with raised rims, ranging in size from approximately 60 to 120 meters, and exhibiting spatial variation in mineral composition and geometry from the Dalangtan area of the western Qaidam Basin on the Tibetan Plateau.
An unmanned aerial vehicle (UAV) was used to capture high-resolution aerial imagery and generate a high-resolution digital elevation model (DEM) through photogrammetric software (Li et al., 2022). Spatially, the polygons in the northeastern part of the study area have complete rims, while the polygons in the southwest have incomplete rims (Fig .1). Surface and subsurface samples were collected at 6-meter intervals from the center to the rim of the polygons and analyzed for mineral composition and content by X-ray diffraction (chung et al., 1974). These polygons consist of a halite crust in the subsurface and raised rims formed mainly of gypsum. In some areas, the polygonal rims are broadened and form boundary belts that are up to ~30 m wide and about 1.2 m high.
Through spatial and mineral analysis, we propose a formation mechanism for polygonal landforms: the formation of the halite crust in the subsurface re-directs upward migration of evaporitic pore fluids that accumulate gypsum deposits to form the wide polygonal boundary belts (Lasser et al., 2023; Fig. 2). We suggest that the similarly sized polygons with raised rims on Mars have similar lateral and vertical structures caused successively by the strong evaporation of lacustrine brines and subsurface pore fluids (Zhu et al., 2023).

Figure 1. Digital elevation model (DEM) of the study area generated by an unmanned aerial vehicle survey.

Figure 2. Schematic representations of the formation of the raised rims/boundary belts of the pan-like polygons in the Qaidam Basin. The early stage is characterized by the drying of lacustrine (left column). Continued evaporation causes the surface to dry out and form polygonal cracks. In the middle stage, the halite crust begins to form and diverts the evaporative fluids, and gypsum begins to accumulate at the rim (middle column). In the development stage, the halite crust thickens, and more gypsum is deposited to widen the polygonal rims into wide belts (right column).
References
Anglés, A., Li, Y. (2017). The western Qaidam Basin as a potential Martian environmental analogue: An overview[J]. Journal of Geophysical Research: Planets, 122(5), 856-888.
Xiao, L., Wang, J., Dang, Y., Cheng, Z., Huang, T., Zhao, J., Xu, Y., Huang, J., Xiao, Z., Komatsu, G. (2017). A new terrestrial analogue site for Mars research: the Qaidam Basin, Tibetan Plateau (NW China)[J]. Earth-Science Reviews, 164, 84-101.
Dang, Y., Xiao, L., Xu, Y., Zhang, F., Huang, J., Wang, J., Zhao, J., Komatsu, G., Yue, Z. (2018). The polygonal surface structures in the Dalangtan Playa, Qaidam Basin, NW China: controlling factors for their formation and implications for analogous Martian landforms[J]. Journal of Geophysical Research: Planets, 123(7), 1910-1933.
Li, Z., Wu, B., Liu, W. C., Chen, Z. (2022). Integrated photogrammetric and photoclinometric processing of multiple HRSC images for pixelwise 3-D mapping on Mars[J]. In IEEE Transactions on Geoscience and Remote Sensing, 60, 1-13.
Chung, F. H. (1974). Quantitative interpretation of X-ray diffraction patterns of mixtures. II. Adiabatic principle of X-ray diffraction analysis of mixtures[J]. Journal of Applied Crystallography, 7(6), 526-531.
Lasser, J., Nield, J. M., Ernst, M., Karius, V., Wiggs, G. F., Threadgold, M. R., Beaume, C., Goehring, L. (2023). Salt polygons and porous media convection. Physical Review X, 13(1), 011025.Salt polygons and porous media convection[J]. Physical Review X, 13(1), 011025.
Zhu, J., Wu, B., Zhao, T., Li, Y. (2023). Polygons with halite-crusted floors and gypsum-raised rims in western Qaidam Basin and implications for polygonal landforms on Mars. Geomorphology, 443, 108934.
How to cite: Zhu, J., Wu, B., and Li, Y.: A study of polygonal landforms in the western Qaidam Basin and implications for polygonal landforms on Mars, EPSC-DPS Joint Meeting 2025, Helsinki, Finland, 7–13 Sep 2025, EPSC-DPS2025-244, https://doi.org/10.5194/epsc-dps2025-244, 2025.
Introduction:
Understanding the relationship between the western and northern deltas in the Jezero crater on Mars is crucial for the reconstruction of the water history in this region. The northern delta appears to be more eroded and older than the western delta; however, contemporaneous northern and western fan building was also recently proposed ([1], [2]). In our study, we explore the origin of the LCP (low-calcium pyroxene)/smectite and olivine/carbonate spectral units, which were found in both deltas and which may record the interaction between them in the past [2] (Fig. 1). We use topographic and compositional data to model potential deposition of the sediments from the western inlet on the northern delta. Our results shed light on the interconnection between the western and northern deltas, establish their relative age and suggest that Neretva Vallis (western inlet) could be the source of the LCP/smectite unit on both deltas in Jezero.
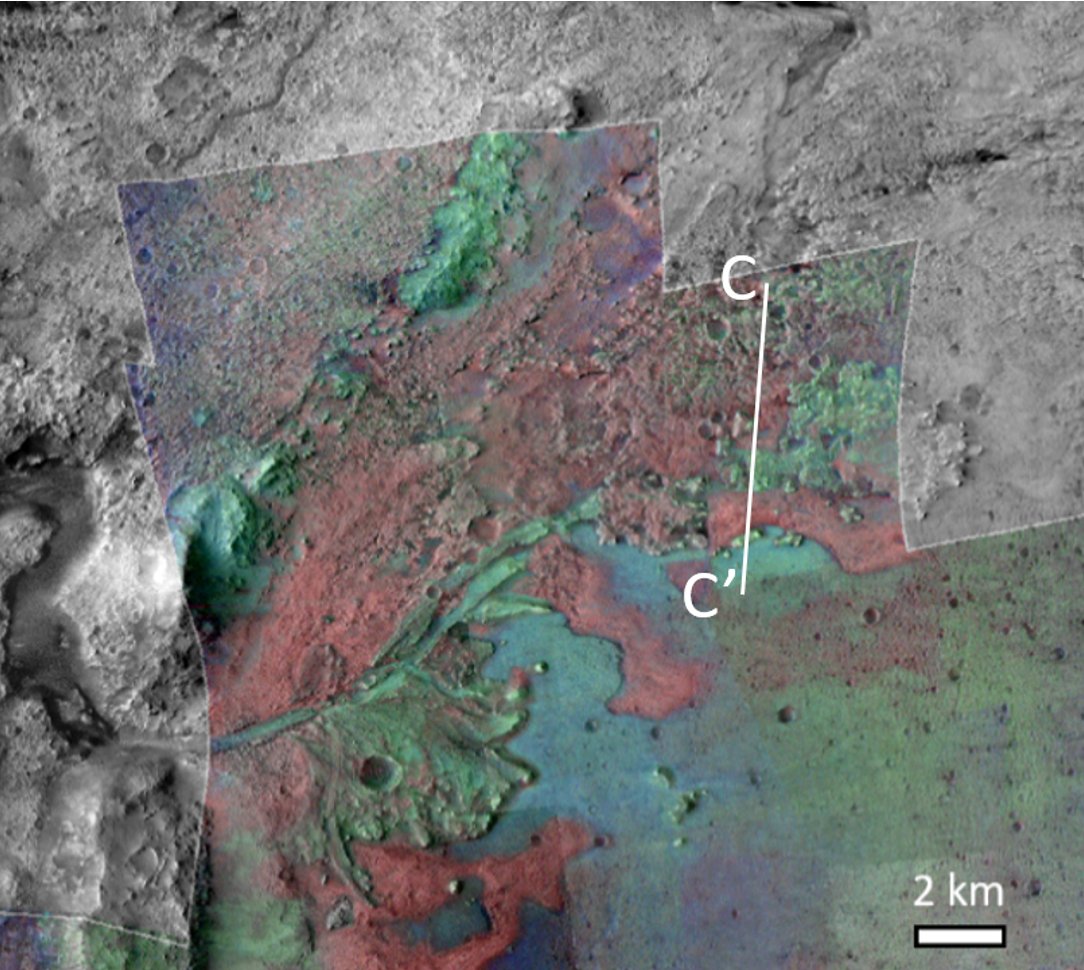
Fig. 1. CRISM Mafic map, adapted from [1]; Green – LCP/smectite; red – olivine/carbonate; blue – High-calcium pyroxene. CC’ profile is shown in Fig.2.
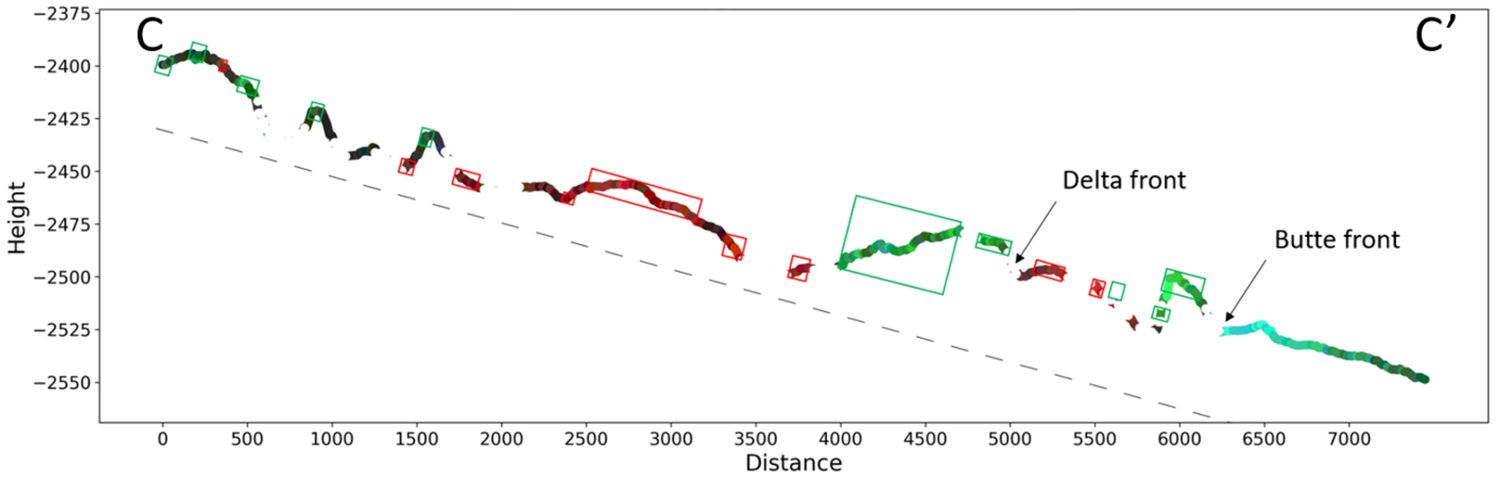
Fig. 2. Example of the topographic-compositional profile (profile line is on Fig. 1).
Data:
CRISM spectral data [2] and the Mars 2020 Science Investigation CTX DEM Mosaic (20 m/pixel) and its corresponding ortho-mosaic (5 m/pixel, [3], [4]) were used.
Methodology:
Based on topographic and compositional data we plotted topographic-compositional profiles that show changes in topography and composition simultaneously (Fig. 2).
To model the hypothesized deposition of the sediments coming from the western inlet through the northernmost channel located within the western delta (Fig.3a), we combined two equations: 1) sediment settling velocity [5] – for the vertical movement of sediment particles and 2) conservation of volumetric flow rate before and after the river enters the lake – for the horizontal movement of the sediment particles. Using the sediment transport equations of [6], we determined that particles up to 5 mm in size are transported in suspension through the above-mentioned channel. Therefore, we used a grain size range from 5 mm (small pebble) to 0.0039 mm (clay) for our model calculating the distance at which sediments transported by the northernmost channel of the western delta can be deposited on the northern delta.
Results:
Topographic-compositional profiles show that the LCP/smectite unit is stratigraphically higher than the olivine/carbonate unit, but does not reveal prominent correlations between separate delta outcrops that would represent the parallel layering typical of Gilbert-type deltas. Therefore, the LCP/smectite unit had to overlie the olivine/carbonate unit when the northern delta was already eroded to its present topography. According to the CRISM data, the closest possible source of the LCP/smectite unit is the western delta and the watershed of the western inlet. At the same time, the CTX DTM shows that a scenario where the northernmost channel of the western delta is subaerial (above the shoreline), while the northern delta is subaqueous could be possible (Fig.3a). Therefore, we hypothesize that the LCP/smectite unit consists of material transported by the northernmost channel of the western delta which is connected to the western inlet. Our model shows that fine silt can be deposited at a distance of 5,000 – 10,000 m from the end of the channel – at this distance the LCP/smectite unit is indeed found on the northern delta (Fig. 3b).
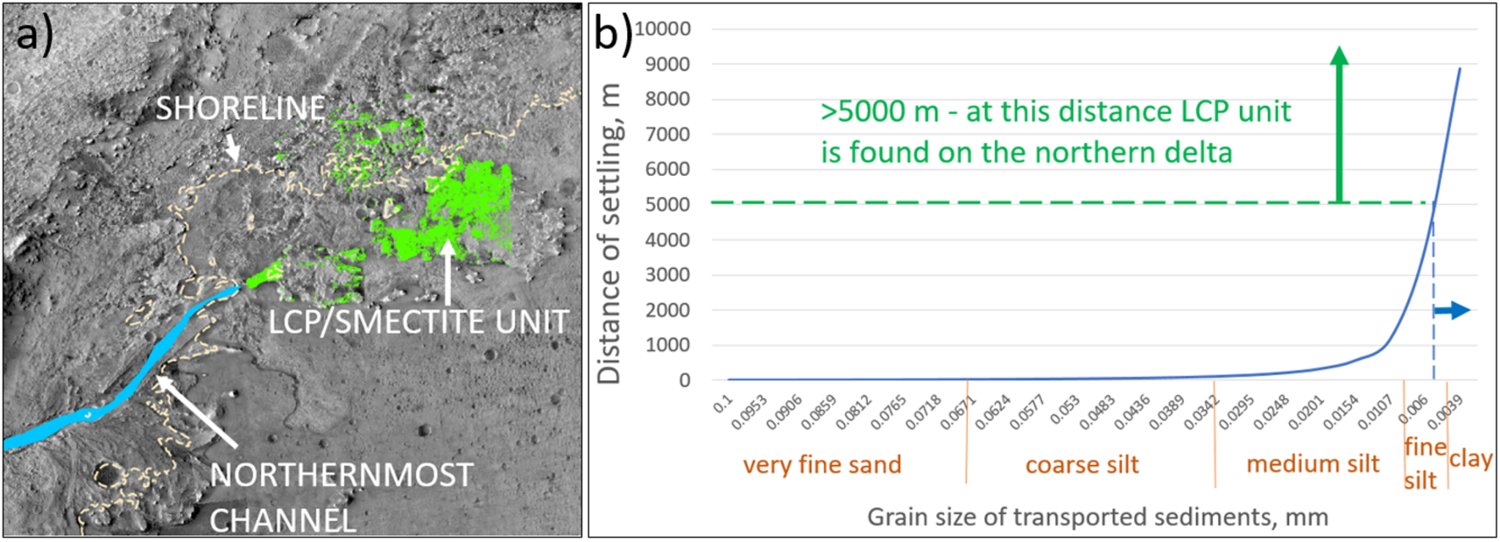
Fig. 3. a) Overview map with studied features; b) Results of modeling, showing that fine silt will be deposited on the southern part of the northern delta, which coincides with the appearance of the LCP/Smectite units.
Discussion:
We validated the model using information about the minimum grain size of the western delta provided by the Perseverance rover results (in bottomsets – “<0.02 mm” for M2020-575-16 Shuyak sample [7]) and RIMFAX data, which show that the length (projected to the crater floor) of the one “topset-foreset-bottomset” sequence is approximately 135-200 m [8]. We modeled the case of deposition of western delta material only and found that sediments with the grain size “0.02 mm” form bottomsets at a distance of 192 m, agreeing with the RIMFAX data. In addition, THEMIS data [9] show low thermal inertia in the southern part of the northern delta (where LCP/smectite is located) consistent with loose fine-grained material (such as silt).
Conclusion:
We interpret the uppermost LCP/smectite unit within the northern delta as material from the western inlet deposited over already existing topography of the northern delta. This implies that there was a period when the active western inlet provided sediment to cover the already eroded northern delta. We therefore conclude that the main body of Jezero Crater's northern delta is older than the western delta but covered with the relatively thin and younger layer of silt deposits from the western inlet.
References:
[1] M. J. Jodhpurkar, et al., J. Geophys. Res. Planets, 129 (2024)
[2] B. H. N. Horgan, R. B. Anderson, G. Dromart, E. S. Amador, and M. S. Rice, Icarus, 339 (2020)
[3] F. Calef, Planetary Data System, USGS Astrogeology Science Center (2021) https://astrogeology.usgs.gov/search/map/mars_2020_science_investigation_ctx_dem_mosaic
[4] M. C. Malin, et al., J. Geophys. Res. Planets, 112(5) (2007)
[5] R. I. Ferguson, and M. Church, Journal of Sedimentary Research, 74(6), 933–937 (2004)
[6] M. G. Kleinhans, J. Geophys. Res. Planets, 110(12), 1–23 (2005)
[7] K. Farley, and K. Stack, Mars 2020 reports, Volume 2, Delta Front Campaign (2023) https://mars.nasa.gov/internal_resources/1656/
[8] S.-E. Hamran, D. Paige, F. Andersson, T. Berger, E. Cardarelli, L. Carter, H. Dypvik, P. Russell, M. Mellon, D. Nunes, and D. Plettemeier, Europlanet Science Congress 2024, EPSC2024-403 (2024). https://doi.org/10.5194/epsc2024-403
[9] C. S. Edwards, K. J. Nowicki, P. R. Christensen, J. Hill, N. Gorelick, and K. Murray, J. Geophys. Res. Planets, 116(10) (2011). https://doi.org/10.1029/2010JE003755
How to cite: Ovchinnikova, A., Jaumann, R., Walter, S. H. G., Gross, C., Zuschneid, W., and Postberg, F.: Exploring the connection of the Northern and the Western Deltas in Jezero Crater on Mars, EPSC-DPS Joint Meeting 2025, Helsinki, Finland, 7–13 Sep 2025, EPSC-DPS2025-795, https://doi.org/10.5194/epsc-dps2025-795, 2025.
Introduction
Floor-Fractured Craters (FFCs) are a class of impact craters characterized by fractured and hummocky crater floors, often displaying features such as concentric or radial fractures, mesas, tilted blocks, and irregular topographies. These morphologies suggest post-impact modification processes that have been extensively studied across the Solar System. On Mars, the origin of FFCs is still debated, with several hypotheses proposed, including intrusive magmatism and associated doming, tectonic deformation, glacial or periglacial activity, and the migration or discharge of pressurized groundwater [1–4]. This study presents preliminary results from a detailed geological and geomorphological analysis of a small (~18 km diameter) floor-fractured crater located in the Noachian-aged terrain of Terra Sirenum (37°S, 190°E), within the broader Gorgonium Chaos basin (~240 km wide [5]). The study aims to investigate the origin of the fractures and the geological evolution of the crater, and to assess the potential roles of tectonic, magmatic, and periglacial processes [6] in shaping its morphology.
Methodology
A detailed geomorphological and stratigraphic analysis was performed by integrating high-resolution datasets, including HiRISE (25 cm/px) [7], CaSSIS (4.5 m/px) [8], CTX (6 m/px), and topographic data from MOLA [9]. Crater counting was performed on the continuous ejecta blanket using CraterTools [10] and Craterstats2 [11], applying the Hartmann and Neukum chronology system [12] and Ivanov's production function [13] to constrain the formation age of the impact. A preliminary evalution of the mineralogical composition of the crater was performed using spectral data from CRISM [14]. As a first step, we used the RGB color composites (browse products) of CRISM [15], which enable a rapid, visual and qualitative multiparametric evaluation of the spectral characteristics of the surface.
Preliminary Results and Interpretation
The interior displays typical FFC features, including a polygonal fracture network, tilted blocks, and mesas of varying elevation and morphology. These morphologies are particularly developed in the southern and central portions of the floor, which appear topographically elevated compared to the northern and eastern parts. This doming-like structure, may indicate the emplacement of a shallow magmatic intrusion beneath the crater floor, causing uplift and fracturing [3]. At the same time, several indicators point toward the involvement of cryospheric processes. The crater ejecta blanket shows a double-layered morphology, a characteristic feature of many Martian craters formed in ice-rich or volatile-rich targets [16-17]. The inner ejecta lobe is more continuous and lobate, while the outer lobe is discontinuous and thinner, consistent with ballistic deposition over an icy or volatile-rich regolith. Within the crater, some mesas appear mantled or smoothed, possibly due to deposition of later ice-related material or sublimation lag deposits. The crater size-frequency distribution (SFD) suggests an early Hesperian to late Noachian formation age (3.4 ± 0.09 Ga, Fig. 1).
Fig. 1 –On the left the image shows the extent of the ejecta in red and the counting crater in yellow. The white arrows highlight the interaction of the Sirenum Fossae fractures with the crater ejecta. On the right, the plot shows the calculated age for the ejecta.
The fracture geometry and spatial distribution within the crater floor suggest at least two deformational phases: an (i) early tectonic control linked to the broader Sirenum Fossae system, and (ii) a later local doming and fracturing episode possibly due to magmatic intrusion. The CRISM-FAL (false color), MAF (mafic mineralogy), PHY (phyllosilicates), PFM (Fe/Mg-phyllo-silicates), PAL (Al-phyllosilicates) and ICE (carbon dioxide frost or ice) browse products were used to investigate the mineralogical composition of the crater and its infilling. These mineralogical maps indicate that the central/southern mesas are characterized by the presence of pyroxene, while the rim and the inner wall of the crater show signs of Fe/Mg Phyllosilicates.
Future Work
The integration of geomorphology, stratigraphy, and composition seems to support a complex interplay of tectonic, magmatic, and later cryospheric processes in the evolution of the crater. Further analysis will include (i) quantitative analysis of spectra derived from CRISM, to constrain the composition of floor and ejecta materials, and to test the possible emplacement of magmatic material and ii) the radar data from SHARAD and MARSIS, in order to assess the presence of present subsurface ice.
Acknowledgement: This work has been developed under the ASI-INAF agreement n. 2024-40-HH.0
References
[1] Schumacher S. and Zegers T. E. (2011) Icarus, V. 211, pp 305-315. [2] Sato H. et al. (2010), Icarus 207 pp. 248-264. [3] Bamberg M. et al. (2014) PSS, V. 98, pp.146-162. [4] Hanna J. C. and Phillips R. J. (2006) JGR, V. 111. [5] Wendt L. et al. (2013) Icarus 225, pp 200-215. [6] Bertoli et al. (2025), submitted to GFT&M [7]. McEwen et al. A. S (2007), JGR:Planets, V. 112. [8] Thomas et al. (2017) Space Sci. Rev. 212 (3–4), 1897–1944. [9] Smith D. E. et al. (2001), JGR:Planets, V. 106, pp. 23689 – 23722. [10] Kneissl T. et al. (2011) PSS, V. 59, pp. 1243–1254. [11] Michael G. G., and Neukum G. (2010) -EPSL, V. 294, pp. 223–229. [12] Hartmann W. K. and Neukum G. (2001) Space Science Reviews, V. 96, pp. 165 – 194. [13] Ivanov B. A. (2001), Space Science Reviews, V. 96, pp. 87–104. [14] Murchie S. et al. (2007), JGR:Planets, V. 112. [15] Viviano-Beck et al. (2014) J. Geophys. Res., V. 119, pp. 1403-143. [16] Barlow et al. (2000), JGR:Planets, V. 105, pp. 26733 – 26738. [17] Weiss D. K. and Head J. W. (2013), Geophys. Res. Lett., V. 40, pp. 3819 – 3824.
How to cite: Bertoli, S., Massironi, M., Salvatore, M. C., Baroni, C., Baschetti, B., Tullo, A., Munaretto, G., Martellato, E., Cremonese, G., Pajola, M., Hauber, E., and Faletti, M.: Geological history of a Floor-Fractured Crater in Gorgonum Chaos, Terra Sirenum, Mars, EPSC-DPS Joint Meeting 2025, Helsinki, Finland, 7–13 Sep 2025, EPSC-DPS2025-1494, https://doi.org/10.5194/epsc-dps2025-1494, 2025.
Introduction
Noachis Terra, in Mars’ southern highlands, is a region which is poorly dissected by erosional fluvial landforms[1,2] but which warm/wet climate models of the early Martian climate predict should have experienced high rates of precipitation[3]. A recent study in Arabia Terra[4], another poorly dissected region of the highlands, found a network of distributed sinuous ridges. These were interpreted as fluvial sinuous ridges (FSRs), topographically inverted fluvial channel belts that are at least as old as the Noachian-Hesperian transition and interpreted to be evidence for ancient river systems with high depositional rates. Noachis is similarly aged, but has a distinctly different geological history[5], so finding FSRs here would provide evidence both for widespread ancient rivers in another part of Mars, and also suggest this style of fluvial activity was common across Mars’ highlands at this time.
Methods
We used ArcGIS Pro software to conduct a survey of a > ten million km2 study area (-35°E, -12°N; 45°E, -55°N). We used the Context Camera (CTX[6]) online global mosaic (5-6 m/pixel[7]), supplementing this with High Resolution Science Experiment (HiRISE; 25-50 cm/pixel[8]) data. We digitized FSRs at a scale of 1:50,000 and measured, calculated, and classified key features relating to each ridge segment, assigning each ridge to one of four morphotypes. We categorised ridges as either ‘certain’ or ‘confident’ based on exposure and image quality; if ridges did not meet these criteria, they were excluded.
Results/Discussion
Morphology:
‘Certain’ ridges have a combined length of more than 8,000 km. This increases to 15,000 km if including the ‘confident’ class. Here we discuss only the ridges classified as certain.
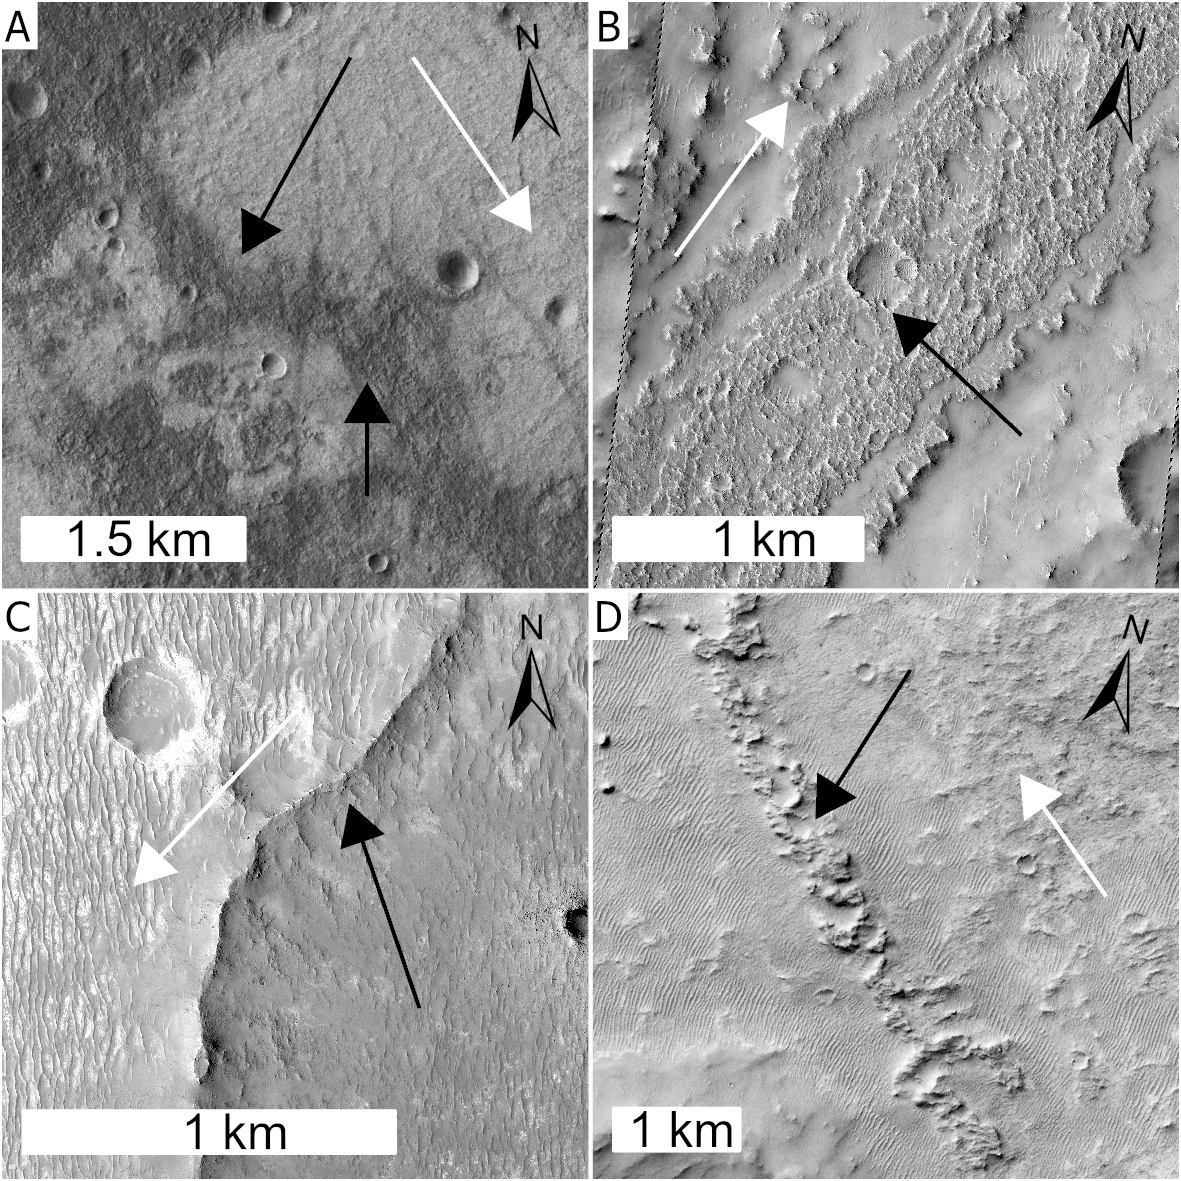
Figure 1: FSR types. Black arrows denote FSRs, white arrows denote downslope topographic trends. A) Type A: rare. B) Type B: most common, 84% of the total length for ‘Certain’ FSRs. C) Type C: narrow, pointed. D) Type D: heavily degraded chains of mounds.
Individual FSR segments are a few kilometres to tens of kilometres long. All four types are sinuous to sub-sinuous: the 30 longest segments (>20 km each) have an average sinuosity of 1.2. The ridges all appear to conform to local topographic trends, exhibit various degrees of preservation, range in width from <100 m to >3 km and exhibit 2-21 m of vertical relief. The shortest segment digitised is 200 m long and the longest is more than 78 km. Visible internal layering or structure is rare and offers little additional information. FSRs commonly record curving plan-view shapes that we interpret as meanders, branching, anastomosing, and smaller ridges connecting at oblique angles to a central wider ridge, which we interpret as tributaries joining a main channel. Ridges with branches may record avulsions or anabranching, or might represent different generations of fluvial activity stacked vertically[9].
Distribution:
The FSRs are widely distributed across Noachis Terra. They are predominantly found in local depressions, and more than 91% (in length) occur in the intercrater plains. Many distinct FSR segments can reasonably be linked to one another, suggesting that river systems many tens or even hundreds of kilometres long were present. However, there are other examples of isolated FSRs or multiple FSRs that do not align with one another, demonstrating that either shorter systems were common or that erosion has removed the evidence for longer rivers. There is little variation in distribution for type B, C, and D, though there is a significant concentration of all FSRs in and west of Greeley Crater (4°E, -37°N); this is also where most type A FSRs occur. We find few FSRs at latitudes higher than 47°S. This indicates a true absence of ridges here, but also shows that we were more conservative in identification due to icy mantling and poorer data quality this far south. The broad distribution of FSRs suggests that the water source must also have been widely distributed (e.g. precipitation). The most likely explanation for the distribution of FSRs is a protracted period (or periods) during which the regional climate was able to sustain precipitation and allow stable surface water long enough to form river systems.
Almost a quarter of FSRs can be found within, or connected to, valleys. Many of these FSRs are in the lower reaches of individual fluvial systems but in other cases FSRs transition to and from valleys. The FSRs occur as narrow, sometimes isolated sections, and are not amenable to accurate age determination using crater counting. Nevertheless, the FSRs are all on Noachian Basement units[10]. The oldest crater they are present in is Dollfus (-4.2°E, -21.4°N; ~4.08-4.013 Ga[11]), and the youngest is Bakhuysen (15.7°E, -22.7°N; ~ 3.49-3.73 Ga[11]). The maximum age of the FSRs is likely to be Noachian or Early Hesperian.
Conclusion
More than 15,000 km of FSRs occur across Noachis Terra, a region of Mars’ southern highlands that is poorly dissected by valleys. These record evidence of sustained fluvial processes, and deposition of fluvial sediment, in a region that was previously thought to lack them. They are likely to have formed during the late Noachian or Early Hesperian, suggesting an at least transiently warm and wet early Mars. These observations provide an important input into future climate models for this period, especially into those that use a lack of valleys in this region to argue against a warm, wet climate[3]. We suggest that having found FSRs in two geologically and geographically diverse, but similarly-aged highland regions on Mars[4], FSRs are likely to be present throughout many Noachian/Hesperian highland regions. Similar survey projects examining CTX data in other regions will test this hypothesis.
References
1 Alemanno et al., Earth and Space Science (2018)
2 Hynek et al., JGR: Planets (2010)
3 Wordsworth et al., JGR: Planets (2015)
4 Davis et al., Geology (2016)
5 Fassett and Head, JGR: Planets (2007)
6 Malin et al., JGR: Planets (2007)
7 Dickson et al., Earth and Space Science (2024)
8 McEwen et al., JGR: Planets (2007)
9 Hayden et al., Icarus (2019)
10 Tanaka et al., USGS (2014)
11 Robbins et al., Icarus (2013)
How to cite: Losekoot, A., Balme, M. R., Coe, A. L., and Fawdon, P.: The Fluvial History of Noachis Terra, Mars, EPSC-DPS Joint Meeting 2025, Helsinki, Finland, 7–13 Sep 2025, EPSC-DPS2025-1751, https://doi.org/10.5194/epsc-dps2025-1751, 2025.
Introduction
The ESA ExoMars Rosalind Franklin (EMRF) rover will launch in 2028, and land in the Oxia Planum region of Mars. The main target is Noachian phyllosilicate-rich deposits [1,2]. This region probably represents the oldest aqueous environments to be explored in situ on Mars. In this study we have investigated extensive secondary craters within the EMRF landing ellipse, to place absolute age markers in the stratigraphic framework of Oxia Planum, and identify the likely primary source crater(s). We pay particular attention to possible secondary craters from Mojave crater, due to its likely recent formation age [3] and importance as a potential source crater for martian meteorites [4].
Method
We first used the recent Mars catalogue of small impact craters [5, 6] in a small (1 x 10⁵ km2) ‘Oxia Planum study region’. We refined the crater identification through manual crater addition, deletion, movement, and scaling. We produced a final catalogue with an extra 22,209 craters, totalling 381,584 impact craters. We applied the ‘Algorithm for the Secondary Crater Identification’(ASCI) [3] to identify possible primary and secondary impact craters. We then produced a crater size density map of possible secondary craters for the Oxia Planum study region, from which we identified acute triangle-shaped clusters (or ‘cones’) of craters. We carried out crater size-frequency distribution (CSFD) studies of previously-identified units in Oxia Planum [1] to determine model surface ages, both with and without secondary craters removed. We then merged the original catalogue of small impact craters [5, 6], with craters with diameters >1 km [7] in a larger (1.2 x10⁶ km2) ‘context study region’. We used the same methods to identify possible primary and secondary craters, and produced a crater size density map of possible secondary craters.
Results
We separate our results into (1) the identification and analysis of secondary craters, and (2) the implications for model ages in Oxia Planum.
Secondary Craters. Of the impact craters in the smaller Oxia Planum study region, we classified 176,927 (46.4%) as primary craters, with 204,657 (53.6%) classified as secondary craters. The number of possible secondary craters has been revised down from our previous results [8]. We identified at least 13 separate clusters of craters that occur in cone shapes, with each cluster typically up to 40 km long and 20 km wide at the distal ends. These cones are oriented radially away from Mojave crater, with the median direction being 225°, similar to the median direction (222°) to Mojave crater. The cones show a distinctive size distribution of craters, with larger craters limited to the proximal (apex) region, with a gradual transition to smaller craters in the distal zone. The cones in our Oxia Planum study region are located at distances of ~700 to 930 km from Mojave. The larger, context study region contains 2,877,811 impact craters, ranging in size from 29 m to 54.4 km [5-7]. We classified 1,356,995 (47.2%) as primary craters, with 1,520,816 (52.8%) classified as secondary craters. We identify a further 13 cone-shaped clusters of secondary craters in the context study region, with ranges ~275 – 500 km from Mojave.
Figure 1. (A) Possible primary (red) and secondary (green) impact craters in our Oxia Planum study region. (B) Secondary crater size density map of same region. EMRF 1s (grey) and 3s (black) ellipse ranges are shown.
Model Surface Ages. The removal of secondary craters from CSFD studies does not affect the model surface age of the phyllosilicate units in Oxia Planum. We derive a model surface age of 3.9 Ga for the Noachian layered clay-bearing unit (lNc) of [1] using all our craters, and an identical age when using just our primary craters. This similarity is due to the lack of secondary craters at larger diameters.
Implications
Our results suggest that there are extensive secondary impact craters in Oxia Planum, with ~4000 secondaries within the EMRF 3s ellipse pattern. It is therefore likely that EMRF will encounter secondary craters during surface operations. The orientation of cone-shaped clusters of small craters indicates that the majority of secondaries are sourced from the Mojave impact crater, although larger, older secondary craters from other sources are also present. Given that the Mojave impact is estimated to have occurred 10.1 Ma [3], these secondaries can be used as absolute stratigraphic markers throughout Oxia Planum, particularly in quantifying the rate of recent and active surface processes. These secondary craters will also be important for target prioritization during in situ studies.
References: [1] Quantin-Nataf C. et al. (2021) Astrobiol. 21, 345-366. [2] Mandon L. et al. (2021) Astrobiol. 21, 464-480. [3] Lagain A. et al. (2021) Earth Space Sci. 8, e2020EA001598. [4] Werner S.C. (2014) Science, 343, 1343-1346. [5] Lagain A. et al. (2021) in GSA Spec. Paper 550, 629-644. [6] Lagain A. et al. (2021) Nature Comms. 12, 6352. [7] Robbins S.J. & B.M. Hynek (2012) JGR 117, E05004. [8] Grindrod, P.M. et al. (2023) LPSC 54, #1113.
How to cite: Grindrod, P., Collins, G., Magnarini, G., Davis, J., Fawdon, P., Favaro, E. A., Tornabene, L., Sokołowska, A., Martin-Wells, K., and Balme, M.: Extensive Secondary Impact Cratering in the ExoMars Rosalind Franklin Landing Site at Oxia Planum, EPSC-DPS Joint Meeting 2025, Helsinki, Finland, 7–13 Sep 2025, EPSC-DPS2025-157, https://doi.org/10.5194/epsc-dps2025-157, 2025.
Please decide on your access
Please use the buttons below to download the supplementary material or to visit the external website where the presentation is linked. Regarding the external link, please note that Copernicus Meetings cannot accept any liability for the content and the website you will visit.
Forward to presentation link
You are going to open an external link to the presentation as indicated by the authors. Copernicus Meetings cannot accept any liability for the content and the website you will visit.
We are sorry, but presentations are only available for users who registered for the conference. Thank you.
Capri Chasma is a canyon located at the exit of Valles Marineris. Its flanks are piled with lava flows. It also contains in places, bright Interior Layered Deposit (ILD) revealing a complex geological history. Some slopes are also the site of a phenomenon known as RSL (recurrent slope lineae). In the northern part of the Chasma, within the thickest portion of the Interior Layered Deposit (ILD), rock units are exposed along some walls, that are part of a ∼30-km circular depression. A well-preserved stratigraphy in the northwest-facing slope reveals several sulfate-rich units, including kieserite and poly-hydrated sulfates, some of which are associated with red and gray hematite [1,2]. A presumed impact has disrupted the southern stratigraphy, redistributing these mineral layers and contributing to a jumbled geological structure. The presence of sulfates and hematite suggests initial ILD deposition by evaporation of magnesium and sulfur-rich brines, followed by groundwater upwelling events that penetrated the ILD, allowed gray hematite precipitation, and induced diagenetic alteration. Alternative explanations involve atmospheric deposition of sulfur-rich aerosols and dust particles within the ice deposits followed by weathering and formation of the sulfates during Martian climatic cycles. As a result, the origin of the Capri Chasma ILDs is still rather vague, and more information needs to be gathered on the stratigraphy, morphology, and color of the deposits, as well as on the microtexture of the materials that make them up. In order to better understand the nature of the deposits and the conditions of their formation, our investigation is based on three types of data: (i) CTX and HiRISE digital terrain models refined by photoclinometry (ii) a multi-angle sequence of hyperspectral images acquired by the CRISM spectro-imager on which we invert Hapke's photometric model after atmospheric correction (iii) a series of images from the CaSSIS multispectral sensor on which photometric and atmospheric correction is performed to extract the intrinsic surface reflectance in four spectral bands, resulting in true color images.
First, we analyze the spectrophotometric data generated from the fusion of the sequence FRTB385 of 11 hyperspectral CRISM images, estimating both atmospheric optical thickness and surface reflectance at a 200 m resolution using the MARS-Reco tool [3]. An unsupervised k-means classification clusters the reflectance data into five photometric classes(fig.1), and Hapke photometric model parameters are computed using the GLLiM algorithm [4] to interpret surface microtexture properties. These parameter maps are overlaid on geological images, and mean volume phase function parameters (b, c) are compared with laboratory data to infer material textures (fig.2). The analysis shows that bright sulfate deposits (cyan class) have translucent grains throughout the wavelength range with high surface roughness, consistent with crystals formed by evaporation of brines. Hematite-bearing materials (blue class) are strongly backscattering at visible wavelengths, where internal absorption is high, and become significantly forward scattering in the shortwave infrared, suggesting round, clear grains, similar to textures observed by the Opportunity rover at Meridiani. This likely indicates very similar conditions of formation.
Fig.1 False color CRISM image (left) and classification map (right) superimposed on a context CTX image of a semi-circular depression in the Eos Chasma, Mars. The classification of the terrains is based on a kmeans clustering of their CRISM photometric curves at a wavelength of 755m.
Fig.2 Qualitative interpretation of the microtexture of the different terrain classes based on a comparison of the spectral behavior of the phase function with laboratory measurements in the Hapke (b, c) parameter space.
Second we use a CTX DTM and its associated CTX orthoimage D07_029766_1668_XN_13S047W, both products generated by a photogrammetric processing of an image pair. The goal is to remove artifacts from the initial CTX DTM at 18m.pixel-1 and to densify it to 6m.pixel-1 using the ortho-image, which exploits intensity variations associated with slopes. To do this, we use the HDEM photoclinometric method [5] based on the CRISM reflectance model previously established for the scene. Prior to this, the initial DTM is filtered to an effective resolution of 288 m.pixel-1 after being decomposed on a spatial wavelet basis using the 2D Isotropic Undecimated Wavelet Transform algorithm, followed by the elimination of high frequencies. The result is highly satisfactory, allowing a much finer, less error-prone topographic characterization of the terrain (fig.3). A similar process was applied to a HiRISE DTM and its associated PSP_008958_1665 orthoimage, resulting in a resolution of 25 cm.pixel-1. In this case, morphometric terrain analysis is possible with a relative vertical resolution estimated at 15-20 cm, giving access to the details of aeolian figures, for example.
Fig 3. Topographic profiles extracted for a mound in the Capri Chasma circular depression.
Thanks to the use of novel CTX, HiRISE and CaSSIS image processing methods, we are carrying out a detailed morphological, stratigraphic and textural characterization of the sulfate- and hematite-rich units over an interesting part of the Capri Chasma. Valuable information has already been obtained that complements the spectroscopic studies to understand the origin and evolution of these formations, as well as the surface phenomena that are currently shaping these landscapes.
[1] Roach, L.H., Mustard, J.F., Lane, M.D., Bishop, J.L., Murchie, S.L., 2010. Icarus 207, 659–674.
[2] Weitz, C.M., Noe Dobrea, E.Z., Lane, M.D., Knudson, A.T., 2012. Journal of Geophysical Research (Planets) 117, E00J09.
[3] Ceamanos, X., Douté, S., Fernando, J., Schmidt, F., Pinet, P., Lyapustin, A., 2013. Journal of Geophysical Research (Planets) 118, 514–533.
[4] Kugler, B., Forbes, F., Douté, S., 2022. Statistics and Computing 32, 31.
[5] Douté, S., Jiang, C., 2019. IEEE Transactions on Geoscience and Remote Sensing 1–14.
Acknowledgment : S.D. is grateful to the Centre National d’Etudes Spatiales (CNES) for supporting his CaSSIS and HiRISE related work through the Program “Exobiologie, protection planétaire et exoplanètes”.
How to cite: Douté, S.: Stratigraphy, morphology, microtexture of the ILDs in Capri Chasma: insights into their formation., EPSC-DPS Joint Meeting 2025, Helsinki, Finland, 7–13 Sep 2025, EPSC-DPS2025-1724, https://doi.org/10.5194/epsc-dps2025-1724, 2025.
Introduction
Sulfates are abundant at the Martian surface, incorporating sulfur delivered by volcanic eruptions and degassing [1,2]. The thickest sulfate accumulations are found in the interior layered deposits (ILDs) of Valles Marineris. We have studied them in Ophir Chasma (Figures 1 and 2). They have been interpreted as either purely sedimentary deposits (e.g., [3]) or weathered volcanic products (e.g., [4, 5]).
Spectral analysis
We performed nonlinear spectral unmixing of CRISM data [6] located in the lower, massive member of the ILD pile in Ophir Chasma. The best spectral fit is obtained when primary igneous minerals (orthopyroxene, plagioclase) and coquimbite were present (Figure 3), alongside kieserite and szomolnokite. The latter are thought to be the main mineral constituents of the ILDs [7-11]. Coquimbite is necessary in the spectral mixture to obtain a good spectral fit. Copiapite is possibly present as well.
Analysis of wind patterns and geomorphology
Wind patterns (Figure 4) and geomorphological evidence show that the igneous minerals are from a local source [14, 15] within the ILDs, rather than from wind transportation from neighbouring volcanic plateaus [16].
Results and discussion
Our findings suggest that the deposition of the lower member of the ILDs was influenced by Tharsis-related syntectonic and synvolcanic activity within the subsided Valles Marineris plateau, and by the redox state of an overlying Valles Marineris sea in a geologic context akin to volcanogenic massive sulfide deposition on Earth. Subsequent climate cooling, potentially related to Tharsis activity waning, would have led to gradual sea freezing, resulting in further alteration in acid-cold environment, and precipitation of the polyhydrated sulfates that compose the upper, layered ILD member. ILD erosion by glacial flows down to the currently exposed chasma floor level and aeolian erosion have shaped the current ILD morphology (Figures 5-6). In summary, the comprehensive ILD pile formed by in-situ weathering of volcanic products, redox state instabilities, and water level fluctuations in a warming and cooling Valles Marineris sea [17].
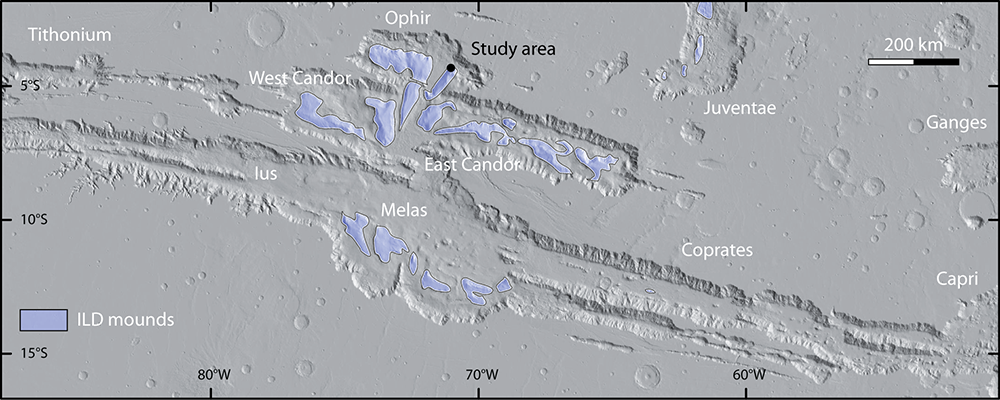
Figure 1. Main ILD mounds in Valles Marineris.
Figure 2. CRISM and HiRISE views of the ILD region of interest (ROI) studied in this work. (a) Unprojected CRISM cube frt00018b55, also analyzed in another work [6]. The interpretation of geological units is from that work. (b) location of the ILD ROI; (c) Three-dimensional view of part of HiRISE image ESP_017754_1755 (50 cm/pixel), showing ILDs in the South and the approximate location of the ILD ROI. The HiRISE DTM was generated using the HiRISE images ESP_016053_1755 (0.25 m/pixel) and ESP_017754_1755 (0.5 m/pixel).
Figure 3. Outputs of 4 nonlinear spectral unmixing runs. The list of minerals included in the spectral library is given for each run. Runs 2 and 4 share the library used in Runs 1 and 3, respectively, with mafic minerals added. The overall spectral fit is good in all the runs, suggesting that the selected mineral libraries are overall satisfying. The presence of mafic minerals significantly improve the RMS. The red areas illustrate the fit discrepancies in the same representative wavelength ranges for comparison. Minerals in green are considered "detected". In yellow, they are considered "questionable". The value of the mixing coefficients X are given in both cases. The minerals which have a "negligible" or "null" contribution are in black. The value of the mixing coefficient of the atmosphere is indicated in gray.
Figure 4. Speed and direction of horizontal wind at its peak 10 m above the topographic surface. (a) At 20:00 (at longitude 0°), the only fall winds originating from bedrock exposures are located south of the ILD ROI. They do not propagate to the ROI. (b) At 4:00, fall winds originate from the northern chasma slopes. However, fall winds from the ILD slope above the ROI control the wind patterns and the ILDs in the ROI only face fall wind coming from the ILDs upslope. Data are from the Mars Climate Model [12, 13], using the Climatology scenario and solar longitude 180. The latitude and longitude ranges of the covered area are 4°S-5°S and 69.5°W-71.5°W. The width of the displayed area is 175 km.
Figure 5. Mechanisms of ILD deposition and erosion that satisfy the mineralogy interpreted from this and earlier works, stages a-c. Abbreviations: Coq: Coquimbite; Cpi: Copiapite; IO: Iron oxides; Ksr: Kieserite; MHS: Monohydrated sulfates; PHS: Polyhydrated sulfates; Szo: Szomolnokite.
Figure 6. Stages d-e and stratigraphic column.
Cited references
[1] Bibring, J.-P., et al. (2006) Science 312, 400–404. https://doi.org/10.1126/science.1122659
[2] King, P. L., & McLennan, S. M. (2010). Elements 6, 107-112. https://doi.org/10.2113/gselements.6.2.107
[3] Grotzinger, J. P., & Milliken, R. E. (2012). In J.P. Grotzinger & R.E. Milliken (Eds.), Sedimentary Geology of Mars, pp. 1–48. https://doi.org/10.2110/pec.12.102.0001
[4] Komatsu, G., et al. (2004) Planetary and Space Science 52, 167–187. https://doi.org/10.1016/j.pss.2003.08.003
[5] Niles, P. B., & Michalski, J. (2009) Nature Geoscience 2, 215–220. https://doi.org/10.1038/NGEO438
[6] Gurgurewicz, J., et al. (2022) Communications Earth & Environment 3, 282. https://doi.org/10.1038/s43247-022-00612-5
[7] Noel, A., et al. (2015) Icarus 251, 315–331. https://doi.org/10.1016/j.icarus.2014.09.033
[8] Wendt, L., et al. (2011) Icarus 213, 86–103. https://doi.org/10.1016/j.icarus.2011.02.013
[9] Murchie, S. L., et al. (2009) JGR: Planets 114, E00D05. https://doi.org/10.1029/2009JE003343
[9] Roach, L.H., et al. (2010) Icarus 207, 659–674. https://doi.org/10.1016/j.icarus.2009.11.029
[10] Weitz, C.M., et al. (2012) JGR: Planets 117, E00J09. https://doi.org/10.1029/2012JE004092
[11] Weitz, C.M., et al. (2015) Icarus, 251, 291–314. https://doi.org/10.1016/j.icarus.2014.04.009
[12] Forget, F., et al. (1999) JGR 104, 24155–24175. https://doi.org/10.1029/1999JE001025
[13] Millour, E., et al. (2018) Scientific Workshop From Mars Express to ExoMars, ESA-ESAC and IAA-CSIC, Madrid, Spain.
[14] Chojnacki, M., et al. (2014) Icarus 230, 96–142. https://doi.org/10.1016/j.icarus.2013.08.018
[15] Chojnacki, M., et al. (2020) JGR: Planet 125, e2020JE006510. https://doi.org/10.1029/2020JE006510
[16] Liu, Y., et al. (2016) JGR: Planets 121, 2004–2036. https://doi.org/10.1002/2016JE005028
[17] Mège, D., Gurgurewicz, J., & Schmidt, F., submitted.
How to cite: Mège, D., Gurgurewicz, J., and Schmidt, F.: Altered lava flows and sulfide controls on the formation of layered deposits in Valles Marineris, EPSC-DPS Joint Meeting 2025, Helsinki, Finland, 7–13 Sep 2025, EPSC-DPS2025-191, https://doi.org/10.5194/epsc-dps2025-191, 2025.
The Argyre basin, located on the southern highlands, spans over 1500 km wide and is one of the largest impact basins on Mars. Three large valleys drain into Argyre from the southern circumpolar region, whereas the basin is breached at the north and perhaps connected to the Ladon-Morava-Ares outflow system draining into Chryse Planitia. Given its volume and valley connections, this basin played a key role in the global hydrology of early Mars (e.g., Clifford and Parker, 2001; Phillips et al., 2001). Several morphological features indicate that the basin may have contained a lake and/or ice sheet in the past, which could have been fed with meltwater from an ancient south polar ice sheet through three main inlet valleys (e.g., Hiesinger and Head, 2002; Ghatan and Head, 2004). A suite of sinuous ridges in the southern Argyre basin (ASRs)—commonly regarded as eskers—has been interpreted as evidence that an ice sheet once occupied the basin (e.g., Banks et al., 2009; Bernhardt et al., 2013). However, new morphological observations focusing on the context and stratigraphy raise discrepancies with the conventional esker interpretation, leading us to revisit their origin.
To assess the origin of these ridges, we first have undertaken detailed morphometric measurements of ASRs and compared them to other glacial and fluvial ridge features on Earth and Mars. We mapped cross-sectional profiles at 1 km intervals along crestlines of ASRs using Context Camera (CTX) images and digital elevation models (DEM). We fitted power-law relationships to those ridge geometries, including width (W) and cross-sectional area (ACS). A power law is expected here because differing scaling relationships exist between channel width and bank-full discharge in fluvial (e.g., Parker et al., 2007) and subglacial systems (e.g., Ng, 1998, Hewitt and Cretys, 2019). We use ACS as a proxy for bank-full discharge (e.g., Ruso et al., 2024). Next, we carefully considered the stratigraphy of the ridges as well as the context where they are found, characterized by laterally extensive layered terrains. We measured dip and azimuths of individual layers observed within the ridge stratigraphy and compared them to those in the surrounding terrains. Then, we worked to understand the stratigraphic relationships between ASRs and surrounding layered terrains. Last, we performed crater counts using the buffer crater counting technique on the ASR to determine their ages (e.g., Kneissl et al., 2011).
Two distinct populations of ASRs can be distinguished stratigraphically: NE-oriented ridges in the eastern population (upper) and NW-oriented ridges in the western population (lower). The power-law relationship for ASRs geometry, shown in Figure 1, shows a strong correlation between log-width and log-cross-sectional area, which is consistent with martian inverted fluvial channels in Aeolis Dorsa region, though the power-law exponents for ASRs are smaller than, yet still comparable to, the subglacial range. The measurement of layering structures revealed that the layers in ASRs are extremely horizontal (~0.07–<0.3°; Figure 2a). These values of dip and azimuth are consistently observed both in ASRs and the surrounding terrains, suggesting a shared sedimentological history, consistent with inverted fluvial channels where the former protective cap rocks have been eroded—manifesting as ridges composed of underlying shale bedrock extending from adjacent lacustrine or floodplain units (e.g., in Utah - Figure 2b). The lateral continuity of layers between ridges and surrounding terrain is entirely inconsistent with the hypothesis of eskers previously proposed (Banks et al., 2009). Whereas eskers may be layered, they are confined structures, preventing them to deposit simultaneously with the surrounding terrain, as subglacial conduits tend to draw water from the surrounding water-distributed regions because the water pressure in a conduit is less than in the adjacent bed. Thus, we conclude that the origin of ASRs is inverted fluvial channels, and the surrounding layered terrains are lacustrine deposits. We have dated ASRs to ~3.6 Ga as exhumed age. Given that the Argyre impact age is ~3.9 Ga, the basin may have hosted a lake at approximately the same time as ASRs (~3.8–3.6 Ga).
Furthermore, we also identified similarly layered terrains in other regions of the Agyre basin, justifying an extrapolation of the horizontal layers to the entire basin. The elevation of the ASRs and their layers ranges from approximately −2633 to −2734 m, and the layers extend to even lower elevations. This elevation indicates the minimum lake level of the putative paleo-Argyre lake, which remains below the hypothesized breach point at the northern end for an Argyre–Uzboi Vallis flood. The two distinct populations of ASRs could provide possible evidence for multi-fluvial periods driven by meltwater from an ancient southern polar ice sheet (e.g., Ghatan and Head, 2004), with the Argyre basin serving as an impoundment for the meltwater (lake volume: ~1.2 × 10⁵ km3).
Figure 1: Comparative geometry for ridge features. (a) ASR compared with martian inverted fluvial channels in Aeolis Dorsa region. (b) ASR compared with martian eskers in Dorsa Argentea Formation.
Figure 2: 3D view of layering structures. Black arrows indicate ridge landforms. (a) ASRs and surrounding layered terrains. CTX_669660_1229 and CTX_067573_1245. Colored lines indicate layers which appear both ASRs and surrounding layered terrains. (b) analogous terrestrial inverted fluvial channels where the cap rocks have been eroded, Utah, US (38.393565°N, 110.788020°W).
How to cite: Shozaki, H., Conway, S., Grau Galofre, A., Mangold, N., and Sekine, Y.: The origin of sinuous ridges in Argyre Planitia: Insights from terrestrial analogues and implications for its hydrology, EPSC-DPS Joint Meeting 2025, Helsinki, Finland, 7–13 Sep 2025, EPSC-DPS2025-205, https://doi.org/10.5194/epsc-dps2025-205, 2025.
Mars is a hyperarid, global cryosphere, and likely has been for over 3 Gyr. Contrastingly, during the so-called early Mars period 4-3.5 Gyr go, water flowed within thousands of valleys, in crater lakes, producing ancient deltas, building ice sheets, and possibly ponding in oceans [1]. However, this early benign climate collapsed with the continued loss of Mars’ atmosphere in the Hesperian period, ~3.5-3 Gyr ago. Activity in most outflow channels has been dated from this period [1-3], with some channels displaying younger [2] and/or later [3] erosive episodes. Within the channels there are landforms indicative of the flow of massive amounts of fluid, including streamlined islands and longitudinal grooves and ridges, often seen diverging around obstacles. Among the outflow channels, Kasei Valles is of particular interest because of its large size, as the volume of water involved in its formation could have contributed substantially to the existence of a northern ocean [2-3] (figure 1c).
Owing to the similar landforms carved by the Missoula megafloods observed in the Channeled Scablands on Earth [1,4] (figure 2, c and f), Kasei Valles along with other martian outflow channels is analogously interpreted to be the result of ancient massive outburst floods [1-4]. Support for this hypothesis includes the presence and morphology of streamlined islands, the presence of regularly spaced longitudinal ridges, and the presence of hanging valleys and U-shaped valleys [1,4,5]. Debate ensues, however, regarding the near surface stability and availability of liquid water during the Hesperian period required to produce repeated erosion at the scales of observed in Kasei Valles. Alternative hypotheses that could explain outflow channel formation include ice streaming [5-6] or regional construction and local erosion by turbulent lava flows [7].
Figure 1. (a) Global topography of Mars with outflow channel distribution. (b) Timeline of Earth (top) and Mars (bottom) highlighting the origin of life on Earth (green star) and the evolution of Mars’ climate and hydrology through time, and the moment of outflow channel incision coinciding the collapse of the early water-bearing climate. (c) Kasei Valles, the largest outflow channel. (d) Hesperian outflow channels, marking the landing site of ESA’s ExoMars Rosalind Franklin Rover, which will search of evidences of life (red circle on Oxia Planum).
This project aims to explore the contrasting hypothesis that Kasei Valles was eroded by an ice stream [5-7], a region of channelized, fast-flowing ice within an ice sheet, and reinvestigate the origin of other outflow channels under this perspective. Drawing from fluid dynamic simulations, analogue field work, geological mapping, and climate modelling, the objective is to test the ice sculpture hypothesis first raised by Baerbel Lucchitta (1982) [5-6], which if correct, would substantially impact our understanding of Mars’ transitional Hesperian climate, the nature of its hydrological cycle, and the possibility of a Hesperian ocean.
Our preliminary observations and results tentatively support this hypothesis [8]. In terms of geomorphology, we show that bedforms such as grooves and streamlined islands, spatial scales, cross-section geometry, and planform morphology all are consistent with terrestrial ice streams, even more so than with the classical analogue of the Channeled Scablands (figure 2, compare a&d with b&e and c&f). Moreover, Kasei Valles demonstrates a lack of significant landforms associated with turbulent flow, such as kolks, turbulent eddie marks, or labyrinthine terrain, which are well visible and reported for the Channeled Scablands as well as other megaflood-type landscapes [4].
Fig 2. Overview and comparative of Kasei Valles and analogue sites and processes. (a) Kasei Valles (MOLA elevation on hillshade). (b) Graphic outline of the northeast Greenland ice stream. (c) Outline of the Channeled Scablands (US) adapted from the USGS. (d) Longitudinal grooves in Kasei Valles (CTX mosaic). (e) Megascale glacial lineations and megagrooves, Dubawnt Lake ice stream bed (ArcticDEM hillshade). (f) Grooves carved by Missoula megaflood, Channeled Scablands (Maxar, Google Earth, contrast-stretched).
We use fluid dynamic simulations to analyze, explain, and interpret the scale and bedforms that are observable within and around Kasei Valles, and then consider comparisons with relevant terrestrial analogues beyond the classic Channeled Scablands site as well as geomorphological characteristics of fast-flowing glacial bodies, to draw conclusions regarding the origin of Kasei Valles, and implications for other outflow channels [8]. Finally, we will contextualize its climatic implications during the time of climate collapse (figure 1) at the end of the Hesperian period, following previous work [10].
Acknowledgements. This project has received funding from the European Research Council (ERC) under the European Union’s Horizon Europe research and innovation programme (Grant agreement No. 101165197 - ICEFLOODS).
References: [1] Carr M.H. (2007) C.U.P (Vol.6). [2] Chapman M.G. et al. (2010a) EPSL, 294 (3-4). [3] Chapman M.G., et al. (2010b). [4] Baker, V.R. and Milton, D.J., (1974) Icarus, 23(1), 27-41. [5] Lucchitta B.K. (1982) JGR: Solid Earth 87(B12). [6] Lucchitta B. K. (2001) GRL, 28(3), 403-406. [7] Leverington D.W. (2011) Geomorphology 132(3-4) [8] Grau Galofre et al., 2023, LPSC. [9] Stokes C.R. and Clark, C.D. (2001) Quaternary Sci. Rev. 20(13). [10] Turbet et al., 2017 Icarus 288, 10–36.
How to cite: Grau Galofre, A.: Glacial Sculpture on Mars’ Ancient Megacanyons : A Presentation of Project ‘Icefloods’, EPSC-DPS Joint Meeting 2025, Helsinki, Finland, 7–13 Sep 2025, EPSC-DPS2025-504, https://doi.org/10.5194/epsc-dps2025-504, 2025.
The dynamics of granular particles on Mars are influenced by environmental factors that are very different from those on Earth. While the low ambient pressure of 6 mbar makes movement by wind significantly more difficult, it is helpful and even necessary for another process that favors the slipping of particles on slopes.
In so-called thermal creep, gas flows from colder, deeper soil layers to layers near the surface, which are heated by solar insolation. This uncommon process does not occur on Earth at 1000 mbar, but it works efficient in the low mbar range of Mars (Bila et al. 2023). The gas flow creates an overpressure under the surface, which can loosen particles and if the whole process takes place on a slope, this leads to a reduction in the slope angle, way below the typical angle of repose (Bila et al. 2024).
By using a centrifuge in microgravity (on parabolic flights), we have experimentally simulated Martian slopes and observed the process described above under realistic conditions in terms of pressure, particle-properties, gravity and insolation. We have measured a pressure- and particle-size dependent reduction in the slope angle by several degrees, which can clearly be attributed to the irradiation.
This process could be relevant for the characteristics of Martian dunes, the formation of Recurring Slope Lineae, slope streaks as well as for the general dynamics of granular particles in the context of dust entrainment.
Tetyana Bila et al 2023 Planet. Sci. J. 4 16
Tetyana Bila et al 2024 Planet. Sci. J. 5 115
How to cite: Schönau, L., Wurm, G., Parteli, E., Bila, T., Gries, O., Onyeagusi, F. C., Keulen, M., and Teiser, J.: From Dawn Till Dusk: How Light Might Reduce Martian Slope Angles, EPSC-DPS Joint Meeting 2025, Helsinki, Finland, 7–13 Sep 2025, EPSC-DPS2025-653, https://doi.org/10.5194/epsc-dps2025-653, 2025.
Please decide on your access
Please use the buttons below to download the supplementary material or to visit the external website where the presentation is linked. Regarding the external link, please note that Copernicus Meetings cannot accept any liability for the content and the website you will visit.
Forward to presentation link
You are going to open an external link to the presentation as indicated by the authors. Copernicus Meetings cannot accept any liability for the content and the website you will visit.
We are sorry, but presentations are only available for users who registered for the conference. Thank you.
Introduction
The surface of Mars records a complex history of tectonic deformation evidenced by tectonic faults including extensional grabens and compressional faults termed ‘wrinkle ridges’. The majority are thought to have formed in Mars’ ancient past, >3.6 Ga, during the Noachian and early Hesperian periods [e.g., 1]. Morphological evidence for more recent tectonism, particularly during Amazonian period (<~3.4 Ga) is much rarer, and more spatially limited [e.g., 2-5].
We present new evidence that tectonic activity occurred in the Bosporus Planum region of southern mid-latitudes since the mid-to-late Amazonian (<1 Gyr). We observe a wrinkle ridge – the surface expression of a compressional fault zone - which cross-cuts a debris-covered glacier of mid-to-late Amazonian-age (Figure 1).

Figure 1: A wrinkle ridge (tectonic fault) dissecting a concentric crater fill (CCF, debris-covered glacier) in Bosporus Planum, Mars. (A) Location on a MOLA elevation map. (B) CTX image of the faulted CCF. White arrows indicate the fault. White dotted line is the crater ejecta. (C) Oblique CTX image with examples from HiRISE where the fault cuts the crater rim and CCF surface.
Observations
The faulted glacier infills a 7.5 km-diameter mid-latitude impact crater. It is morphologically consistent with features termed ‘Concentric Crater Fills’ (CCFs). CCFs, along with other types of putative debris-covered glacier in Mars’ mid latitudes (generally termed ‘viscous flow features’), are thought to have formed in the last few hundred Myr to 1 Gyr [e.g., 6-11].
We observe the fault trace crossing the CCF surface, and cross-cutting the walls, rim and ejecta blanket of the CCF host crater, as well as the surrounding plains. The fault appears to be associated with a regionally extensive population of SW-NE-oriented wrinkle ridges recording compressional tectonism in Bosporus Planum. The ejecta of the CCF-hosting crater embays NW-SE-oriented grabens to the south. Combined with the SW-NE-oriented wrinkle ridges, these indicate a complex history of both extensional and compressional stresses in this region.
The cross-cutting relationship we present between the wrinkle ridge and the CCF provides strong, direct evidence that this fault has been active since the CCF formed, and hence that syn-glacial, compressional tectonism has occurred in Bosporus Planum in the geologically recent past.
Estimating the timing of fault activity
To constrain the approximate timing of fault activity, we combine photogeologic mapping of the Bosporus Planum region with impact crater retention age estimation for various glacial and non-glacial units with different stratigraphic relationships to the tectonic faults in the region. We first generated a regional photogeologic map of the major geomorphic units and wrinkle ridges aligned with the CCF fault, using a basemap of 100 m/pixel Thermal Emission Imaging System (THEMIS) daytime and nighttime infrared images [12-13], and 6 m/pixel Context Camera (CTX) panchromatic images [14]. We are now performing targeted impact crater size-frequency analyses with a combination of CTX and 25 cm/pixel High Resolution Imaging Science Experiment (HiRISE) images [15] to estimate the impact crater retention ages of: (a) the regional population of CCFs; (b) the ejecta blanket of the impact crater hosting the faulted CCF; (c) the surrounding plains which are dissected by the fault; and (d) the ejecta blanket of a 33 km-wide crater 100 km NE of the faulted CCF, which also hosts evidence for faulting (though with a somewhat more ambiguous stratigraphic relationship between the ejecta and the associated fault).
To estimate the impact crater retention ages [e.g., 1] of the regional population of CCFs, we combined the CCF inventory of [16] with original observations and mapping to delimit crater counting areas for 114 CCFs across Bosporus Planum, avoiding portions of CCF surfaces which are significantly obscured by later deposits including aeolian bedforms and ice-rich mantling deposits. The combined area for CCF surface crater counting is 1140 km2. Our CCF crater counts are based on CTX images, and impact craters with diameters >50 m. Below this diameter, it becomes challenging to distinguish impact craters from decametre-scale pits which commonly occur in ice-rich materials. We acknowledge the significant uncertainties which arise from impact crater counting on young, ice-rich surfaces, and we have classified the CCFs according to the level of apparent degradation, and additionally classified the impact craters in their surfaces into morphological categories which may reflect different degrees of CCF surface degradation or resurfacing. This allows us to scrutinise the influence of the different morphological subpopulations, and the potential CCF-surface modification processes they record, on the size-frequency distributions we observe.
Conclusions
Preliminary results indicate that CCFs in Bosporus Planum have a combined impact crater retention age of <1 Gyr. This confirms our hypothesis that the tectonic fault which cross-cuts a CCF in Bosporus Planum was active during the Amazonian period, and perhaps as recently as the mid-to-late Amazonian. At this meeting, we will present our full age estimation results, including for the ejecta blanket of the host crater and other units crossed by tectonic faults in Bosporus Planum.
References
[1] Michael, G. G., 2013. Icarus 226, 885–890.
[2] Goudy, C. L. et al. 2005. J. Geophys. Res. Planets 110, E10005.
[3] Bouley S. et al. 2018. Earth Planet. Sci. Lett. 488, 126–133.
[4] Woodley, S. Z. et al. 2024. Geophys. Res. Lett. 51(9), e2023GL107757.
[5] Pieterek, B. et al. 2024. Icarus 420, 116198.
[6] Levy, J. et al. 2010. Icarus 209(2), 390–404.
[7] Baker, D. M. H., and Carter, L. M. 2019. Icarus 319, 264–280.
[8] Woodley, S. Z. et al. 2022. Icarus 386, 115147.
[9] Butcher, F. E. G. et al. 2017. J. Geophys. Res. Planets 122(12), 2445–2468.
[10] Butcher, F. E. G. et al. 2021. Icarus 357, 114131.
[11] Madeleine, J.-B. et al. 2009. Icarus 203, 390–405.
[12] Christensen, P. R. et al. 2004. Space. Sci. Rev. 110(1–2), 85–130.
[13] Edwards, C. S. et al. 2011. J. Geophys. Res. Planets. 116(E10), E10008.
[14] Malin, M. C. et al. 2007. J. Geophys. Res. Planets. 112(E5), E05S04.
[15] McEwen, A.S. et al. 2007. J. Geophys. Res. Planets. 112(E5), E05S02.
[16] Levy, J. S. et al. 2014. J. Geophys. Planets. 119, 2188–2196.
How to cite: Butcher, F. E. G., Fawdon, P., Wright, J., Woodley, S. Z., and Cornford, B. T.: Amazonian syn-glacial tectonism in Bosporus Planum, Mars, evidenced by a tectonic fault cross-cutting a crater-filling glacier., EPSC-DPS Joint Meeting 2025, Helsinki, Finland, 7–13 Sep 2025, EPSC-DPS2025-676, https://doi.org/10.5194/epsc-dps2025-676, 2025.
Abstract
Potential endorheic basins that are not contained within an impact crater have been studied only to a limited extent on Mars. These basins, characterised by the absence of outgoing channels, are of particular interest in planetary science due to their potential to preserve evidence for ancient hydrological activity and possible biosignatures [1,2]. This study investigates an inter-crater depression on Mars, located within the Terra Cimmeria region, by analysing both its geological and mineralogical aspects. Remote sensing data were collected, and a detailed geological map of this Martian basin was constructed, revealing various geological features suggesting a past aqueous environment. The analysis of CRISM (Compact Reconnaissance Imaging Spectrometer for Mars) data was then conducted to investigate the mineralogy of the basin-fill deposits. The basin was observed to be rich in pyroxene and olivine, together with evidence of hydrated minerals in some locations.
Introduction
On Mars, open paleolake basins [2] and closed paleolake basins within impact craters [1] have been described often guided by the presence of deltaic bodies and other lacustrine deposits. However, examining terrestrial analogues such as the Makgadikgadi Pans in Botswana, it is revealed that endorheic lake basins do not form only within impact craters on Earth; instead, they can be formed by tectonic processes that result in formation of depressions [3, 4, 5, 6]. Similar tectonic or non-tectonic (i.e., inter-crater) endorheic lacustrine basins might have formed on the Martian surface outside impact craters.
Study Area
The study area lies within the Terra Cimmeria region of Mars' southern hemisphere (34.457°S, 147.973°E). This region features a potential endorheic basin that exhibits characteristics similar to those found near the Huygens Basin on Mars [7, 8]. These endorheic basins can be compared with the Makgadikgadi Pans (Botswana) previously described as potential terrestrial analogues of Mars playa environments [4, 5].
Geological Map
High-resolution Sterio Camera (HRSC), Context Camera (CTX), and High-Resolution Imaging Science Experiment (HiRISE) datasets were used to create a detailed geological map of the Martian basin, constructed using QGIS software, showcasing different geological features present (Fig.1). Digital Elevation Models (DEMs) from the Mars Orbiter Laser Altimeter (MOLA) were also utilised to create a topographical profile of the study area.
Crater counting for age determination
High-resolution imagery in JMARS was utilised to identify and catalogue impact craters within the study area. Each crater was measured and classified based on its size and state of preservation. To reduce secondary crater contamination, craters with a diameter of less than 1 km were avoided. The collected data were then analysed using the Craterstats software [9], which allowed for the estimation of surface ages by fitting the observed crater distributions to established Martian cratering models.
Mineralogical Investigation
Both CRISM hyperspectral (Map-projected Targeted Reduced Data Records-MTRDR) and multispectral (Multispectral Reduced Data Records-MRDR) data were employed for the detailed spectral analysis of the basin. Data were analysed using ENVI version 4.7. Using spectral indexes and browse products such as the MAF and PHY products, the spectral analysis is focused mainly on detecting mafic and hydrated minerals.
The multispectral tile t0472_35s148 was used to globally assess the mineralogy of the study area, including the craters surrounding the basin. Additionally, four CRISM-targeted images (frt0000a3b5_07, frt00009648_07, hrs0000aa66_07, hrl00013bfa_07) were used for detailed investigations.
Results and interpretation
The study area shows a drainage network, consisting of channels and tributaries mapped in the study, which might have created and sustained the lacustrine water body. The crater counting results suggest that this basin dates back to the Late Noachian period, a time when Mars likely had a more temperate climate capable of sustaining liquid water on its surface for extended periods [10]. Our preliminary CRISM analysis within the study area shows the presence of hydrated minerals [Fig.2], which strengthens a possible past hydrological environment in the area. Other minerals observed are olivine and pyroxene, which are consistent with a previous study [11].
This study laid the foundations for understanding the Terra Cimmeria basin as a potential paleo-endorheic basin.
Figures
Figure 1: Mini Geological Map of the endorheic basin in Terra Cimmeria, Mars
Figure 2: Multispectral tile (t0472_35s148) analysed in PHY browse product with locations of the different regions used for CRISM analysis. (A) Reddish areas are olivine-rich (B). Blue areas indicate possible hydrated minerals. (C) CRISM spectra with the 1.9 µm feature highlighting the presence of hydrated minerals.
References
[1] Goudge, T.A., et al. 2015. Icarus 260, 346–367.
[2] Goudge, T.A., et al. 2012. Icarus 219 (1), 211–229.
[3] Franchi, F., et al. 2022. Frontiers in Ecology and Evolution, 10, 818417.
[4] Franchi, F., et al. 2020. Planetary and Space Science, 192, 105048.
[5] Kahsay, T. H., et al. 2024. Planetary and Space Science, 249.
[6] Schmidt, G., 2023. Tectonophysics 846, 229678.
[7] Mukherjee, S., et al. 2020. Geomorphology, 351.
[8] Singh, D., 2022. Icarus, 372, 114757.
[9] Michael, G.G., et al. 2010. Earth Planet. Sci. Lett. 294 (3-4), 223–229.
[10] Andrews‐Hanna, J. C., 2011. Journal of Geophysical Research: Planets, 116(E2).
[11] Cowart, J. C., et al. 2019. Journal of Geophysical Research: Planets, 124(12), 3181–3204.
How to cite: Motlhasedi, A. J., Franchi, F., Komatsu, G., Pondrelli, M., and Baschetti, B.: Investigation Of A Potential Endorheic Basin In Terra Cimmeria, Mars, EPSC-DPS Joint Meeting 2025, Helsinki, Finland, 7–13 Sep 2025, EPSC-DPS2025-1070, https://doi.org/10.5194/epsc-dps2025-1070, 2025.
Introduction
During the whole Holocene, the Sahara Desert underwent a series of cyclic climatic fluctuations resulting in alternating arid and humid phases. Current arid conditions began ~6,000 BP. Prior to that, from ~14,500 to ~6,000 BP, widespread and abundant rainfall characterized the so-called ‘Green Sahara’, the last African Humid Period (AHP) when the Sahara was vegetated. [1, 2]. Evidence of the extensive pluvial activity that characterized the AHP can be documented even in areas close to presently hyperarid zones such as the Tanezrouft. The Ahnet Basin, situated at the northeastern margin of the Tanezrouft, is indeed characterized by a wide range of morphologies and deposits that testimony the wet past of the basin.
Our work focused on establishing the relationship between the paleohydrography of the basin, still visible, and its Quaternary deposits to infer, through mapping and stratigraphicrelationships:
-
A better understanding of how the wet to arid climatic transition influenced the deposits and their distribution inside the basin;
-
The possibilities to use the Ahnet Basin as a terrestrial analog for the evaporitic, alluvial, and eolian deposits directly related to the wet-to-arid transition on Mars at the end of the Hesperian.
Geological and Geographical Setting
The Ahnet Basin (~65,000 km²) lies in the Algerian Sahara, ~1,200 km south of Algiers, [3, 4] and is one of the ‘Peri-Hoggar Basins’ that formed during the Pan-African Orogeny (600–500 Ma). The metamorphic basement of Precambrian age is unconformably covered by Paleozoic successions of siliciclastic sediments up to 7 km in thickness. They consist of NNW-dipping sandstones and shales with few Devonian and Carboniferous limestone intercalations. The origin of the deposits is predominantly marine with continental fluviatile facies gradually transitioning to shallow marine and then to offshore moving from South to North [5, 6, 7]. The Mesozoic sedimentary record, due to a strong Triassic erosional phase, is completely absent from the basin. Finally, the Quaternary deposits, which we intend to analyze, appear to reflect a range of different genetic agents.
Data and Methods
The study was performed inside a GIS environment and, focusing onfour areas originally selected to be part of a sampling campaign. We produced four hybrid geomorphological maps, one for each area, making use of true color Sentinel-2A images as basemap (resolution: 10 m/px) and the Copernicus 30 m DEM for topographic and morphological characterization. The hydrography was digitalized both manually and automatically using GRASS GIS. Stratigraphic relationships were studied using Google Earth imagery and GIS 3D models.
Results
Mapping at 1:10,000 scale identified ~10 litho-morphological units across all study areas (see Fig. 1 for example). Tectonic structures were also mapped in this phase, while a more detailed characterization of the geomorphological elements will be presented in a future publication. This process revealed the extensive presence inside the basin of alluvial deposits directly linked to a dense and well-developed valley network. Despite the limitations set by our DSM in the analysis of such a pervasive hydrography, we managed to automatically extract channels up to the 11th Strahler order. These data, however, clash with the present-time climate whose numerical parameters were collected from three weather stations located all across the basin. Precipitation is <15 mm/yr (Fig. 2), confirming hyperaridity. Current valley reactivation is likely only during rare catastrophic events. Instead, in good accordance with these numbers, is the existence of evaporitic and eolian deposits which can also consistently be found in all areas.
Stratigraphic relationships revealed periodic channel reactivation and desiccation involving alluvial and evaporitic deposits. Fig. 3 depicts, for example, the interaction between an alluvial fan and a sabkha inside one of the study areas. The numerous instances of reactivated channelized activity, rather than to some episodic precipitation events, could possibly point to a slow climatic transition from humid to arid. Further investigations is needed to confirm the climatic interpretation, this association of deposits appears to be, from both a morphological and stratigraphical point of view, an analog for Arabia Terra’s light-toned layer deposits and inverted channels. As such, the study of the effect of climatic shifting on these terrestrial deposits could shed some insights on the Noachian-Hesperian transition on Mars.
Acknowledgements
We acknowledge financial support under the National Recovery and Resilience Plan (NRRP), Mission 4, Component 2, Investment 1.1, Call (2.2.2022) by the MUR, funded by the European Union – NextGenerationEU– Project Title Tanezrouft salt flat deposits (Sahara Desert): a priority target for a Mars Sample Return mission – CUP D53D23002600006 - Grant Assignment Decree No. 962 adopted on 30/06/2023 by the Italian Ministry of Ministry of University and Research (MUR).
This study was carried out within the Space It Up project funded by the ASI and the MUR (Contract n. 2024-5-E.0 - CUP n. I53D24000060005).
References
[1] deMenocal, P. B. et al. (2000). Quaternary Science Reviews, 19: 347–361.
[2] Tierney, J. E., et al. (2017). Science Advances, 3:e1601503.
[3] Perron, P. et al (2018). Solid Earth, 9: 1239-1275.
[4] Mostefai R. et al. (2023). Iraqi Geological Journal, 56: 1-13.
[5] Wendt, J. et al. (2006). Geological Magazine, 143: 269-299.
[6] Black, R., et al. (1994). Geology, 640-644.
[7] Zieliński, M. (2012). Marine and Petroleum Geology, 38: 166-176.
How to cite: Caddeo, Y., Pondrelli, M., Mancini, F., Abdelali, A., and Cavalazzi, B.: Water in the Ahnet Basin (Algeria): Traces of the Wet Past of the Sahara Desert as an Analog for the Hesperian-Amazonian Transition in Arabia Terra (Mars), EPSC-DPS Joint Meeting 2025, Helsinki, Finland, 7–13 Sep 2025, EPSC-DPS2025-1671, https://doi.org/10.5194/epsc-dps2025-1671, 2025.
We present our work on developing the 1:1M scale geologic map of a quadrangle of Mars in the Northeastern Tempe Terra region, next to the transition between Martian highlands and lowlands. The MTM 45302 quadrangle covers an area of about 200 by 300 kilometers, centered at 302.5°E, 42.5°N. We based our mapping on data from NASA’s Mars Global Surveyor, Mars Odyssey, Mars Reconnaissance Orbiter, the ESA’s Mars Express, and CNSA’s Tianwen-1.
The regional topography in the area dips towards the northeast, with a total elevation decrease of about 2000 meters. We defined three plateau units in the area, with morphologies of wide, gently-dipping flat surfaces bounded by cliffs. Moderate resolution imagery shows spots with evidence of layering within the plateaus units. Crater size frequency distribution indicates ages of 3.9 to 3.4 Ga for the plateau units. The three mapped units are separated stratigraphically by erosional unconformities, cross-cutting craters, and linear features. The middle and most extensive plateau unit is cut by parallel elongated valleys oriented NNE-SSW, exposing mounds, pitted terrain, fan deltas, and inverted channels in the lower plateau unit. The mapped channel axes are often associated with the trend of the valleys formed by the erosion of plateaus. Wrinkle ridges are present on each plateau unit, and their tectonic expression is confined to each relative unit. In the south portion of the quadrangle, ENE-WSW trending linear tectonic features of the Tempe Terra system cut through all the units. Craters in the MTM exhibit pedestal, radial, single- and multi-layer ejecta morphologies, and different infill styles. Several crater floors contain curvilinear ridges and troughs. We are currently reviewing the interpretation of the mapped features, their stratigraphic relationship and building hypotheses on the geologic evolution of the area, preparing the final geologic mapping product.
Besides the purpose of describing the evolution in space and time of the area, our mapping project serves as a context for a companion study about the presence of ice in the shallow Martian crust, observed from imaging spectroscopy at a spatial resolution of about 20 meters per pixel. The area of our map also contains six ~0.5 - 2 km diameter, relatively recent impact craters with similar thermal inertia and crater morphology characteristics, including radial ejecta which exhibit unusually bright thermal inertia at night. Furnari et al. (2024) studied one of these craters using spectral analysis, highlighting an anomalously large abundance of seasonal water ice on the ejecta, offering new insights on ice variation in the Martian ground. Additionally, crater analysis by Gou et al. (2024) in the lowlands Chryse Planitia region to the southeast of our study area posits that craters with multi-layer ejecta at this latitude indicate the presence of subsurface volatiles.
The stratigraphic and structural relations of the geologic features mapped in this work provide the key to reconstruct the geologic evolution of processes that occurred on Mars in an area where the southern highlands are transitioning to the northern lowlands. Evidences for ice-related processes in the geologic history, combined with the instrumental record of ice in relatively recent craters, suggests that this region likely hosted ice in the past and potentially in the present.
Acknowledgements: This work is supported by the ASI-INAF Mars Exploration agreement 2023-3-HH 0.
References: Furnari et al., 2024, Study of the seasonal water ice in the ejecta of a small crater on Mars. Congresso di Scienze Planetarie, Bormio, Italy, 5-9 Febbraio 2024; Gou et al., 2024, Paleoenvironment implications of layered ejecta craters in the Chryse Planitia, Mars, Icarus, Volume 410, 115918.
How to cite: Frigeri, A., Rasmussen, M., Brossier, J., Apuzzo, A., Altieri, F., and De Sanctis, M. C.: The Geologic Map of the MTM 45302 quadrangle in Northeastern Tempe Terra on Mars., EPSC-DPS Joint Meeting 2025, Helsinki, Finland, 7–13 Sep 2025, EPSC-DPS2025-811, https://doi.org/10.5194/epsc-dps2025-811, 2025.
Isotopic analysis is a critical tool for understanding planetary water cycles and quantifying the role of distinct atmospheric processes. This study investigates the spatio-temporal distribution and controlling factors of the HDO/H₂O ratio in water vapor within the tropospheres of Earth and Mars, highlighting the similarities and differences in water vapor transport and phase changes on both planets.
We found significant isotopic enrichment from ice sublimation on both planets, with a stronger effect observed on Mars due to longer ice-crystal residence times, lower atmospheric pressures, and substantial temperature fluctuations. In contrast, Earth's near-surface oceans buffer these isotopic variations. Quantifying ice sublimation effects through observational data could help improve the microphysical parameterization in atmospheric models.
Moreover, during Mars's global dust storm, the D/H ratio markedly increased and propagated upward due to reduced condensation and the absence of liquid precipitation. In contrast, Earth-based observations during typhoon events indicate isotopic depletion propagating northward from tropical regions, driven primarily by raindrop evaporation within convective systems. Thus, storm events lead to opposite isotopic responses on Earth (depletion) and Mars (enrichment). Consequently, isotopic signals have considerable potential as proxies for reconstructing storm history and intensity across planetary environments.
This comparative analysis underscores both shared and planet-specific aspects of tropospheric water cycling, supporting a unified conceptual framework that effectively explains isotopic distributions under differing planetary conditions. Our results may enhance climate and weather models by improving representations of cloud microphysics and atmospheric water transport, while offering new tools for interpreting past climate events based on isotopic evidence.
How to cite: Wang, D., Risi, C., Montmessin, F., Tian, L., Bowen, G., Petzold, G., Vals, M., Gourion, E., Fan, S., and Sun, C.: Comparative Analysis of Tropospheric Water Isotope Distributions on Mars and Earth: Insights into Ice Cloud Microphysical Processes and Storm Dynamics, EPSC-DPS Joint Meeting 2025, Helsinki, Finland, 7–13 Sep 2025, EPSC-DPS2025-1507, https://doi.org/10.5194/epsc-dps2025-1507, 2025.
Introduction: Gravity and topography are valuable tools for understanding climate records on Mars. Specifically, they help constrain the volume and composition of large ice masses including the Polar Layered Deposits (PLDs) and subsurface ice sheets in the mid-latitude regions. The South Polar Layered Deposits (SPLDs) in particular are known to reach up to ~3.7 km thick [1] and have a composition primarily of water-ice mixed with dust [e.g., 2]. Understanding vertical and lateral dust variations across the SPLD will advance our ability to understand how material is deposited and sublimated over time in response to an orbitally controlled climate. Mid-latitude ice deposits share similarities in composition [3] as well as implications for understanding Mars’ climate and habitability. They may also represent water resources for potential human exploration [4], such as the Arcadia plains and the glacial deposits of Deuteronilus Mensae [5]. However, debates regarding the spatial distribution, structure, thickness, and total volume of these deposits remain [e.g., 3,6].
Methods: We use localized effective density techniques. Although the analysis of ice deposits with gravity is challenging because of the current precision and resolution of the Martian gravity field (known to spherical harmonic degree and order 120 [7]), these techniques allow us to quantify bulk density at different spatial scales by comparing free-air gravity to the Bouguer correction (gravity predicted from topographic relief) [8]. Our work advances on that of [9] by using these techniques to specifically constrain ice deposits. For the SPLD, density variations can inform us on variations in dust content. For the mid-latitude deposits, we can either match the thickest ice deposits to other independent data sets (such as the ice consistency maps of [5]) or place upper limits on their thicknesses. In both settings, these techniques can help set measurement requirements for future gravity data to address scientific questions. We obtain localized effective density (ρeff) estimates by filtering the window of the gravity field in spherical harmonics with Slepian functions [e.g., 10], which define a spatial concentration from an angular size θ and a spectral concentration from a bandwidth L. Using the Python package SHTOOLS [11] and the methods described in [9], we compute localized ρeff spectra across the Martian surface at specified latitudes and longitudes.
Results: Mars’ gravity field has highest resolution at the south pole, allowing us to work with higher bandwidths and examine the SPLD regionally. The effective density of the south polar region of Mars is shown in Figure 1. We use L=20 and θ=10°, yielding a best-concentrated localization window with a concentration factor of 0.96. Between 90°S and 70°S, we calculate ρeff spectra at longitudinal increments of 2° and latitudinal increments of 1°. To mitigate noise in the gravity data, we take a flexible approach in interpreting different spherical harmonic degrees in different regions. Up to the maximum degree we can consider given the local degree strength and L, (typically between degrees 60<l<75), we select the ρeff value corresponding to the spherical harmonic degree with the highest correlation between free-air gravity and gravity-from-topography. We do not report ρeff in regions where the maximum correlation <0.5, as these areas probably produce unreliable density estimates due to low correlation. We additionally track the maximum correlation between 60<l<75 and the degree at which the highest correlation occurs, which are shown as polar projections in Figure 1.
In the region of the SPLD, we observe 650<ρeff<2600 kg/m3, encompassing a past bulk estimate of 1220 kg/m3 [2]. We can interpret lateral variations in ρeff as potential variations in dust content and compare to the density maps of [12,13]. Similar to [12], we find some of the lowest densities close to the south pole as well as lower densities at Ultima Lingula. Similar to [13], we observe low densities between longitudes 0°-180°E across Australe Lingula, Promethei Lingula, and Ultima Lingula. We observe a similar trend towards higher densities near Australe Scopuli, and especially high densities between longitudes 180°-225°E that can be interpreted as a very low-ice content region, subsurface mass anomalies, or noise in the gravity data.
Discussion and Future Work: Our initial results for the SPLD quantify possible lateral variations in dust content, which may reflect different climate records at different past times. Ongoing work involves applying the same effective density approach elsewhere on Mars, focusing on density variations at the upper mid-latitude regions and forward modeling the effective density spectra (similar to the approach of [14]) of ice deposits. Additionally, our modeling approach will be used to set upper limits on ice sheet thicknesses from the current gravity data and inform measurement requirements for testing ice and climate-related hypotheses with the acquisition of future gravity data at Mars [15], such as from the MaQuIs mission concept [16].
Figure 1: Maps of the south polar region, including effective density (left) corresponding to the highest correlation between 60<l<75, the values of those highest local correlations (middle), and the degree l at which the highest correlation occurs (right).
References: [1] Plaut, J., et al. (2007) Science, 316, 92-95. [2] Zuber, M., et al. (2007) Science, 317, 1718-1719. [3] Bramson, A., et al. (2015) GRL, 42, 6566-6574. [4] Dundas, C., et al. (2018) Science, 359, 199-201. [5] Morgan, G., et al. (2021) Nat. Astron., 5, 230-236. [6] Campbell, B., & Morgan, G. (2018) GRL, 45, 1759-1766. [7] Genova, A., et al. (2016) Icarus, 272, 228-245. [8] Besserer, J., et al. (2014) GRL, 41, 5771-5777. [9] Goossens, S., et al. (2017) GRL, 44, 7686-7694. [10] Wieczorek, M., and Simons, F. (2005) GJI, 162, 655-675. [11] Wieczorek, M. & Meschede, M. (2018) G3, 19, 2574-2592. [12] Li, J., et al. (2012) JGR: Planets, 117. [13] Genova, A., et al. (2024) Icarus, 414, 116025. [14] Izquierdo, K., et al. (2024) JGR: Planets, 129(2), e2023JE007867. [15] Sori, M., et al. (2024), 10th Int. Conf. on Mars, Abstract #3037. [16] Wörner, L., et al. (2023), Planet Space Sci., 239, 105800
How to cite: Dunnigan, A. and Sori, M.: Constraining Martian Ice Deposits from an Effective Density Approach to Gravity and Topography and Implications for a future Mars Gravity Mission, EPSC-DPS Joint Meeting 2025, Helsinki, Finland, 7–13 Sep 2025, EPSC-DPS2025-931, https://doi.org/10.5194/epsc-dps2025-931, 2025.
Introduction:
Understanding the long-term evolution of the Martian climate and its reservoirs is a key challenge in planetary science. Mars experiences large obliquity variations (0°–60°), which are known to drive its climate [1]. In particular, the North Polar Layered Deposits (NPLD) is believed to preserve a valuable stratigraphic archive of past environmental changes over the last few to tens of millions of years [2,3]. Yet, a major question remains: linking the orbital forcings with the layers evolution under climate dynamics [4]. To investigate these processes at geologic timescales, we developed the Planetary Evolution Model (PEM), a new modeling framework to bridge the gap between short-term General Circulation Models (GCM) and long-term climate dynamics.
In this contribution, we present the conceptual and physical basis of the PEM and illustrate its first applications focused on the formation and evolution of the Martian NPLD.
The Planetary Evolution Model (PEM):
Traditional Mars GCM convincingly simulate atmospheric processes but are limited to short periods (typically decades) due to computational costs. 1D climate or stratigraphic models handle long durations but often neglect key dynamical couplings, limiting their applicability. Moreover, all these models typically rely on paramatrized fluxes and prescribed reservoirs (glaciers, subsurface ice) whose initialization can lead to unrealistic outcomes. Hence, GCM are unsuitable for simulating orbital-scale climate variations. The PEM addresses this issue by focusing on long-term changes while bypassing sub-year variability. It is based on asynchronous coupling with a GCM, here we use the Mars Planetary Climate Model (PCM) [3].
The core idea of the PEM is to compute tendencies from two consecutive PCM years and then to extrapolate them to evolve climate-relevant reservoirs until stopping criteria are met (e.g. surface pressure change, ice area loss/gain or orbital shift). At that point, the PEM halts and, with the updated climate state, it re-runs the PCM to obtain new tendencies. This cycle repeats until the desired simulation length is reached. The PEM can be used in two ways: (i) to determine steady-state configurations (e.g. realistic distribution of glaciers) for given orbital parameters, which can then be used as initial states in other simulations; and (ii) to perform transient simulations over full orbital cycles.
Key physical processes in the PEM include:
• CO₂/H₂O surface ice evolution: local tendencies are computed from interannual minima of the ice in the PCM (perennial ice). The PEM assumes fast atmospheric equilibration for water with only transfers between sublimating and condensing reservoirs.
• Glacier flow: a statistical sub-grid slope parameterization accounts for North–South orientation effects [6], reproducing slope-dependent layering.
• Subsurface H₂O ice: ice table depth is dynamically adjusted based on thermal diffusion, pressure and surface humidity, following Norbert Schorghofer's work [7].
• Soil properties: the PEM uses a multilayer subsurface (regolith, breccia, bedrock) whose thermal properties adapt to pressure and pore-filling ice. The yearly-averaged surface and subsurface temperatures are updated according to surface ice accumulation/depletion.
• CO₂/H₂O adsorption/desorption: adsorbed species are maintained in equilibrium with the atmosphere.
Furthermore, the PEM performs several subsequent adaptations to make the aforementioned processes internally consistent and to simulate the co-evolution of reservoirs and atmosphere. For instance, the PEM adjusts the yearly-averaged surface pressure based on CO₂ mass balance. This necessitates to scale the volume mixing ratios accordingly and to correct the CO₂ tendencies obtained from the PCM.
Layered Deposits:
The NPLD exhibit a complex stratigraphic structure made of layers with varying composition (H₂O ice, dust and possibly tempoeary CO₂ ice) and geometry (thickness, unconformities). The alternation of dusty and icy layers has long been hypothesized to record obliquity-driven climate cycles. High obliquities (>30°) typically lead to ice loss, while low obliquities (<20°) enable accumulation provided that a source is available [8,9].
Additionally, CO₂ and H₂O sublimation/condensation thresholds interact to create diverse physical siturations. For instance, water may act as a lag layer above CO₂ glaciers, as observed and modeled by Buhler et al. [10] for the South Polar Layered Deposits (SPLD).
To reproduce such features, the PEM includes a novel dynamic layer-tracking model. Each deposition or ablation event modifies the local stratigraphy by adding new layers with appropriate dust/ice content or generating dust lag deposits upon ice sublimation.
As a first scientific application, we used the PEM to simulate the growth and evolution of the NPLD under an orbital forcing scenario. The goal is to test whether the PEM can reproduce observed stratigraphic features and evaluate the role of orbital cycles in shaping the NPLD.
Perspectives:
The PEM is a new-generation tool to study the evolution of Mars’ climate and volatile reservoirs over orbital timescales and understand its present-day geomorphological imprints. Our first applications to the NPLD demonstrate the PEM potential to resolve long-term polar stratigraphy and test hypotheses on past Martian environments, bringing us closer to decoding the Mars’ deep climate memory.
Our ongoing work aims to improve the PEM models to explore atmospheric collapse/inflation scenarios and to fully couple the PEM with an hydrological model (lakes, river systems) to study early Mars.
References:
[1] Laskar J. et al. (2004) Icarus, 170(2), 343–364.
[2] Phillips R. J. et al. (2011) Science, 332, 838.
[3] Levrard B. et al. (2007) J. Geophys. Res., 112, E06012.
[4] Smith I. B. et al. (2020) Planetary and Space Science, 184, 104841.
[5] Forget F. et al. (1999) J. Geophys. Res., 104(E10), 24155–24175.
[6] Lange L. et al. (2023) Journal of Geophysical Research: Planets, 128, e2023JE007915.
[7] Schorghofer N. (2007) Nature, 449, 192-194.
[8] Hvidberg C. S. et al. (2012) Icarus, 221(1), 405-419.
[9] Vos E. et al. (2022) J. Geophys. Res., 127(3), e2021JE007115.
[10] Buhler P. B. et al. (2020) Nature Astronomy, 4, 364-371.
How to cite: Clément, J.-B., Forget, F., Vos, E., Lange, L., and Millour, E.: Long-term simulation of Martian Polar Layered Deposits: introducing the Planetary Evolution Model, EPSC-DPS Joint Meeting 2025, Helsinki, Finland, 7–13 Sep 2025, EPSC-DPS2025-792, https://doi.org/10.5194/epsc-dps2025-792, 2025.
Please decide on your access
Please use the buttons below to download the supplementary material or to visit the external website where the presentation is linked. Regarding the external link, please note that Copernicus Meetings cannot accept any liability for the content and the website you will visit.
Forward to presentation link
You are going to open an external link to the presentation as indicated by the authors. Copernicus Meetings cannot accept any liability for the content and the website you will visit.
We are sorry, but presentations are only available for users who registered for the conference. Thank you.
Introduction
Mars’ mid latitudes contain thousands of ‘viscous flow features’ (VFFs), akin to debris-covered glaciers on Earth [e.g. 1,2]. They are thought to have formed within the last several Myr to 100s Myr [3,4] during martian ‘ice ages’, driven by variations in Mars’ spin-axis obliquity [5,6]. Knowledge of the emplacement age of ice within VFFs is key to understanding the palaeoclimate histories likely contained within them.
Current VFF age estimates rely on the size-frequency distributions of impact craters across their surfaces [e.g. 3,4]. Such ages likely reflect the time since emplacement or last major modification of the surficial debris layer; they provide no direct information about the emplacement ages of the underlying ice, and implicitly assume a uniform age across the sampled area. However, ice flow physics causes spatial variations in ice flow, which will lead to the age of ice varying across VFF surfaces and with depth. Here, we develop a new physically-based approach to estimate the age of ice in VFFs, and apply this method to a small VFF in Mars’ southern mid-latitudes (Figure 1), the subject of our previous study [7].

Figure 1. VFF in Nereidum Montes (51.24°W, 42.53°S). (A) 6 m/pixel Context Camera (CTX) image P14_006572_1367_XN_43S051W showing the VFF (terminating at the white dashed line), and major arcuate VFF-surface structures cut through by a gully [8]. Inset: Mars Orbiter Laser Altimeter (MOLA) elevation map of Mars showing location of Nereidum Montes. (B) Oblique view of the VFF overlain by schematic map identifying key landscape features, adapted from [7]. Base image: orthorectified 25 cm/pixel HiRISE [10] image ESP_051036_1370, overlain on 1 m/pixel HiRISE DTM.
Methods
Our age-estimation method combines a 3-dimensional ice flow model [ISSM; 8] with particle tracking. We conduct a range of experiments with different assumed ice flow mechanisms with different exponents in the ice flow law (n = 2 or 3, [9]), assumed VFF surface temperatures (Ts) ranging from 200 K to 230 K, and ice grain sizes from 0.5 mm to 5 mm. We take n = 3, Ts= 210K as the “standard” run. We track a dense network of 4860 “seed” particles across the VFF surface from emplacement, through transport within the VFF, to re-emergence onto the surface. Integrating the modelled velocity along each path allows calculation of the age of the surface at particle emergence points, and the age/depth relationship for any point within the VFF.
Results
Figure 2 shows the calculated VFF surface age for the standard run, with example particle paths and depths for 21 particles emerging along three of the major arcuate surface structures (Figure 1). There is a strong, rapid increase in surface age toward the VFF terminus; particle paths emerging nearer the terminus have come from furthest upstream (Figure 2B), and reach greater depths within the VFF. Vertical transects through the VFF (Figure 2C) show particle paths become increasingly tilted toward the ice surface toward the terminus (due to flow compression [8]); isochrons also become tilted upwards. The upstream area of the VFF shows younger ages; particles emplaced here move downwards into the VFF due to flow divergence, emerging at lower elevations (Figure 2B).

Figure 2. (A) Ice-surface age map for the standard run. Particle path depths shown as colour variations along 21 example paths. Red: model domain. White areas inside the domain with no age information: areas where no particle paths > 100 m long terminate, preventing age calculation. Hatched area: approximate portion of the domain where particle paths emergence points source from outside the domain northern edge. (B) Particle emergence points colour-coded by particle source elevation, for path lengths > 100m, and excluding paths emerging in the gully. Dashed lines: transects a–a’ and b–b’ (panel C). Background as Figure 1B. (C) Modelled Ice age/depth profiles for transects a–a’ and b–b’. Vertical flow paths emerging at the upper, middle, and lower surface structures shown for each transect. Ages shown at emergence points, and for hypothetical vertical transects 900 m from model domain westernmost edge. White areas as panel A.
Qualitatively, the spatial age patterns and particle paths are insensitive to the assumed ice flow mechanism, surface temperature and ice grain size. However, the latter two factors emerge as key controls on ice velocity and hence age. Mean ages of the 21 example tracks in the standard run (Figure 2) are (upper; middle; lower) 47.8 Myr; 82.3 Myr; and 178.4 Myr. These vary by ~100x with variable surface temperature, and by ~30x with grain size.
Conclusions
Our results show the age of near-surface ice varies significantly across the VFF, especially near the terminus. These patterns are driven by the 3-dimensional flow, particularly compression-driven upwards ice flow near the terminus bringing older, deeper ice to the surface. Age increases with depth throughout the VFF. Ice temperature and grain size, rather than the ice flow law, emerge as critical controls on ice velocity, and hence the specific calculated ice ages.
Our results have important implications for scientific sampling by future missions aiming to access ice, including robotic missions and eventual human-led missions which could extract climate records in ice cores. Our results highlight the importance of improving understanding of glacial processes on Mars ahead of ice access missions to identify potential landing sites and mission traverses with the highest science potential, and to devise ice sampling strategies.
References
[1]. Holt, J. W., et al. 2008. Science, 322, 1235–1238.
[2]. Plaut, J. J., et al. 2009. GRL, 36, 2008GL036379.
[3]. Baker, D. M. H., Carter, L. M. 2019. Icarus, 319, 264–280.
[4]. Hepburn, A. J., et al. 2020. JGR Planets, 125, e2019JE006102.
[5]. Laskar, J., et al. 2004. Icarus, 170, 343–364.
[6]. Madeleine, J.-B., et al. 2009. Icarus, 203, 390–405.
[7]. Butcher, F. E. G., et al. 2024. Icarus, 419, 115717.
[8]. Larour, E., et al. 2012. JGR: Earth Surf., 117, 2011JF002140.
[9]. Goldsby, D. L., Kohlstedt, D. L. 2001. JGR : Solid Earth, 106, 11017–11030.
[10]. McEwen, A. S et al. 2007. JGR: Planets, 112, 2005JE002605.
How to cite: Arnold, N. and Butcher, F.: Physically-based estimates of the age of ice in a martian debris-covered glacier, EPSC-DPS Joint Meeting 2025, Helsinki, Finland, 7–13 Sep 2025, EPSC-DPS2025-696, https://doi.org/10.5194/epsc-dps2025-696, 2025.
The potential for liquid water formation on Mars during the late Amazonian period has sparked considerable scientific debate, driven by the presence of young landforms such as gullies, Recurring Slope Lineae (RSL), and channels that resemble water-formed features on Earth [see review in 1]. While some studies support the possibility of surface or subsurface ice melting as a source of liquid water [e.g., 2-3], others argue it is thermodynamically implausible under current Martian conditions ice [e.g., 4-5]. This presentation reviews the literature, identifies limitations in studies supporting meltwater, and employs advanced modeling to show that recent melting of water ice on Mars is highly improbable.
Why is it difficult to melt ice on Mars?
Numerous studies have shown that water ice is abundant on Mars at the surface or in the ground. Furthermore, thermophysical conditions that allow liquid water to be present (above the triple point pressure and freezing temperatures) are common during most of summer’s afternoon on Mars [6]. Hence, one may suggest that ice can melt. Yet, two mechanisms, often neglected, prevent to reach such conclusions:
- Water ice/frost forms in cold trap, like pole-facing slopes on crater’s rims, rather than warm places. When ice/frost is heated and warms, it generally disappears quickly before reaching 273.15 K as the sublimation flux is growing exponentially with ice temperature.
- When ice approaches the temperature of melting, the sublimation cooling induced by the release of latent heat surpasses the solar and thermal infrared heating, forcing the ice to cool and thus preventing it to reach 273.15 K.
Several studies have suggested that the sublimation fluxes and latent heat cooling could be significantly reduced by: i) A high humidity in the atmosphere, likely during period of high obliquity; which would reduce the gradient of humidity between the near-surface atmosphere and the ice subliming, and thereby the sublimation flux; and ii) the presence of a thin dry-regolith layer above the ice, acting as a sublimation barrier. Yet, as we show below, such mechanisms are not efficient enough to allow melting.
Melting ice at the surface
Using the Mars Planetary Climate Model (PCM) and its representation of slope-microclimates [7], we test whether frost/ice at the surface can melt at an obliquity of 35°, when the humidity was the highest in the last 5 million years. The modeled distribution of frost at these epochs are shown in Figure 1, along with the maximum temperature of these deposits. For all simulations, no ice deposits can melt (maximum temperature of 272 K), again because of the significant sublimation cooling.
Melting ground ice
To check whether ground ice can melt, we first compute the depth at which water ice would be present based on vapor-exchange theory [8] for present-day and obliquity 35° (Figure 2). We then retrieve the maximum temperature of this ice (Figure 2). In all cases, we find that subsurface ice does not reach the melting temperature (maximum temperature of 260 K). Indeed, ice is generally stable at depth too large to be sufficiently heated to melt.
The best case: bring ground ice closer to the surface
As shown previously, ice at the surface cannot melt because of the latent heat cooling. Stable ground ice is too deep to be warmed enough and melt. Thus, the most favorable scenario for melting buried near-surface ice on Mars in the recent past would be to destabilize it by bringing it closer to the surface, allowing sufficient heating to reach melting while minimizing cooling from latent heat loss. This process is currently being observed on Mars: during the active period of a gully, part of the surface material is removed (most likely because of by CO2 ice sublimation, [9]), bringing the ice buried beneath these slopes closer to the surface, sometimes even exposing it on the surface [10]. We use a 1D version of the Mars PCM to simulate the evolution of such ice after an event that eroded the surface. Almost none of our simulations with realistic thermophysical properties of the regolith/ice allows the melting for present-day and recent past, suggesting that recent melting on Mars is highly unlikely.
Effects of salts
Salts are well known to reduce the temperature needed to melt ice. However, the quantity of salts needed to significantly reduce this temperature is too high compared to typical abundance measured at the surface [5]. Hence, we suggest that the formation of brine through the melting of salty ice is unlikely in the recent past of Mars.
Melting Ice Through the Solid-State Greenhouse Effect Some studies [e.g., 3, 11] have suggested that dusty snowpack can melt on Mars because of a greenhouse effect generated by the absorption of solar radiation by dust grains within the ice. While this mechanism is the most credible to date to allow melting and might happens today on dusty-ice exposure [e.g., 10], it remains uncertain whether this is a widespread phenomenon, especially given the uncertainty on the dust cycle and dust deposition with the ice during periods of higher obliquity.
Figure 1: Maximum thickness of seasonal frost on 30° pole-facing slopes for an obliquity of 35° and perihelion coincident with the Northern summer (a), and the Southern summer (c). Gully’s locations are reported by the grey dots. Maximum temperatures of these deposits are shown in (b,d).
Figure 2: (a,c,e) Depth at which water ice can be stable beneath 30° pole-facing slopes for present-day and recent past, along with the maximum temperatures of these ice (b,d,f)
References: [1] Conway et al. (2021), Mars Geological Enigmas. [2] Costard et al. (2002), Science, 295 (5552). [3] Christensen (2003), Nature, 422 (6927). [4] Ingersoll (1970), Science, 168 (3934). [5] Mellon et al. (2001), JGR-Planets, 106 (E10). [6] Haberle et al. (2001), JGR-Planets, 106 (E10). [7] Lange et al. (2023), JGR-Planets, 128 (10). [8] Schorghofer & Aharonson (2005), JGR-Planets, 110 (E5). [9] Pilorget & Forget (2016), Nature Geoscience, 9, 65-69. [10] Khuller & Christensen (2021) , JGR-Planets, 126 (2). [11] Clow (1987), Icarus, 72 (1).
How to cite: Lange, L. and Forget, F.: On the Possibility of Melting Water Ice to Initiate/Promote Gully Activity during the Recent Past of Mars, EPSC-DPS Joint Meeting 2025, Helsinki, Finland, 7–13 Sep 2025, EPSC-DPS2025-846, https://doi.org/10.5194/epsc-dps2025-846, 2025.
Introduction: The surface of Mars exhibits clear geomorphic evidence for recent and ongoing glacial and periglacial processes, but the ancient history of ice on Mars is not well understood [1,2]. Most glaciers and ice sheets on Mars are predicted to have experienced little or transient melting at their base, and because melt is a major driver of erosion and transport in a glacier, these cold-based and/or polythermal glaciers may not have left behind clear physical signs in the geologic record. Thus, while abundant evidence exists for at least transient warmer and wetter conditions on ancient Mars, we lack a clear record of the duration and extent of ice-dominated climates. Here we suggest that an alternative signature of past glaciation on Mars may be the geochemical record, due to alteration by interactions with cold-based glaciers. However, the mineralogy of cold-based glacial alteration products is poorly constrained.
Recent work on temperate glacial alteration products of Mars-relevant bedrock shows silica cycling is the dominant alteration process throughout the glacial system, resulting in significant amounts of silica dissolution and precipitation [3], but that warm-based ice may not be the best analog to hypothesized cold-based Mars glaciers. Thus, polythermal glaciers, which are combinations of temperate and cold ice, are key sites to help constrain glacially driven alteration products in a Mars-related setting.
In this study, we analyze glacial sediment, bedrock, and water samples from a Mars-relevant polythermal glacier system overlying mafic bedrock to better constrain alteration and resulting alteration products. We hypothesize that interactions with these glaciers will result in distinct alteration signatures (i.e. mineral assemblages) which can be used to identify evidence of past polythermal or cold-based glacial activity under past climates on Mars.
Field Site: Storglaciӓren is an Arctic, polythermal glacier located in the Kebnekaise Mountains of Sweden. Storglaciӓren was chosen as it overlies Mars-like, iron-rich, mafic bedrock [4-6]. The underlying bedrock is primarily metamorphosed doleritic and mafic dykes, hornblende-rich amphibolites, and mylonitic gneiss [4,5]. The field site also exhibits relatively low water-rock ratios approaching hypothesized conditions on past Mars.
Methods: Rocks, sediment and water samples were collected from the glacial margin and outwash plain of Storglaciӓren. In situ and laboratory visible/near-infrared spectra (VNIR; 0.3-2.5 μm) were collected to determine the mineralogy of glacially altered sediments. Spectrally dominant minerals were identified based on comparison to spectral libraries [7]. A UAV was also used to collect multispectral aerial imagery of the study site.
Results: VNIR spectra of the glacial sediments (Fig. 2) are dominated by a strong triplet band near 2.32 μm, the strength of which is correlated with a broad band at ~1.2 μm. Both are consistent with chlorite, a phyllosilicate that is a significant component of the mafic metamorphic rocks in the region. Additionally, fine glacial sediments also show an additional strong shoulder on this band near 2.21 μm that is consistent with hydrated silica. This signature is strongest (and the chlorite signatures are weakest) in sediments collected from moraine seeps where cold-based ice is melting in situ. Fresh proglacial sediments from the warm-based portion of the glacier also show moderate chlorite and silica signatures, along with a strong red slope that we hypothesize may be related to subglacial oxidation.
Aqueous geochemistry results indicate that chemical weathering of the bedrock is likely driven by a combination of both carbonic acid (H2CO3) and sulfuric acid (H2SO4), resulting in major cations (e.g., calcium, magnesium), silica, and iron being released from subglacial sediment into the meltwater.
Discussion: We hypothesize that amorphous silicates and opaline silica are precipitating from dissolved SiO2 during freeze/thaw cycles [3] and that acidic weathering is driving heterogeneous oxidation in the subglacial environment [3]. Initial results indicate that the former appears to be more effective in the more stable, cold-based margins of the glacier where residence times of sediment are longer, while the latter is more prevalent in the warm-based portions dominated by subglacial meltwater, glacial sliding, and seasonal flushing of sediment and water. These results suggest that there may be differences in weathering processes between cold- and warm-based glaciers and that these differences may be detectable in relict glacial terrains and deposits on Mars [8].
References: [1] Souness C. et al. (2011) Icarus, 217, 243-55. [2] Fastook, J.L., and J.W. Head. (2015) Planetary and Space Science, 106, 82-98. [3] Rutledge, A.M. et al. (2018) Geophysical Research Letters, 45, 7371–7381. [4] Baird, G.B. (2010) [5] Andreasson P. and D.G. Gee (1989) Geografiska Annaler. Series A, Physical Geography, 71, 235-239. [6] Holmlund P. and P. Jansson (2002). [7] Kokaly, R.F. et al. (2017) USGS Data Series 1035, 61p. [8] Havig, J.R. and T.L. Hamilton (2019) Geochimica et Cosmochimica Acta, 247, 220-242.
Acknowledgement: This work was supported by NASA SSW# 80NSSC20K1236.
How to cite: Rutledge, A., De Anda, C., Horgan, B., Havig, J., Marrs, I., and Salvatore, M.: Cold as ice, red as Mars: Polythermal glaciation and implications for surface composition as a record of past climate, EPSC-DPS Joint Meeting 2025, Helsinki, Finland, 7–13 Sep 2025, EPSC-DPS2025-1201, https://doi.org/10.5194/epsc-dps2025-1201, 2025.
Protected by centimeters of dry sediments, a planetary-scale mantle of relatively pure water ice covers the entire mid and high latitudes of Mars. Its presence down has been shown by numerous lines of evidence including geomorphology [e.g. 1], neutron spectroscopy [2], in-situ observations [3], and the observations of exposed ice in fresh craters and local outcrops [4,5]
Given the purity of the ice, it is most likely that this ice has been accumulated as snow from the atmosphere when the climate was different (today perrenial water ice is not stable at the surface outside the polar regions). This ice would have later sublimed and buried itself below a protective sublimation lag. Using Global climate Models, the origin of ice ages has been discussed for more than twenty years, first with the scenario that when the obliquity of Mars reached more than 40° (and not less), as occurred on Mars more than 5 million years ago, the Northern polar layered deposits became unstable and formed glaciers in the tropics and at mid-latitudes. When the obliquity decreased back toward the present-day value (below 30°), the glaciers became unstable and tended to cover the mid and high latitudes with the now-observed mantle of ice.
But there was a problem.
At least the upper part of the “latitude dependent ice mantle” is estimated to be geologically very young, most likely less than one million years [1]. This young age has been enigmatic because the tropical and mid-latitude remnants of glaciers supposed to have been the source of the ice mantle are estimated to be much older, tens of millions of years. Moreover, the obliquity has been below 35° for at least 5 million years [10]. How could the very recent latitude mantle have formed ?
In the past years, we have significantly upgraded the Planetary Climate Model in order to adapt it to the modelling of the very humid martian climates predicted at high obliquity [11]. In particular we have improved the calculation of the impact of latent heat when surface ice sublimes (negligible on Mars today), the albedo of the fresh snow (always thin today), the cloud microphysics and, above all, the radiative effect of water ice clouds (which play a secondary role on present-day Mars). With such a model, we have discovered that PCM simulations performed assuming the same climate system as today, but with obliquities of as low as 35° or even 30°, predict a fascinating climate completely different than today and unlike the one modeled by the previous version of the PCM. The key driver are the water ice clouds, which induces a significant ~20 K greenhouse effect and a very humid and cloudy climate [11, 12]. Depending on the orbital configuration, the seasonal CO2 ice cap can disappear! In such conditions, with the improved ice albedo and latent heat effects, the PCM predict the accumulation of a mantle of ice in the mid-latitude for obliquity above 30°, thus as recently as 380,000 years ago. The time of the last ice age on Mars ?
Following this finding, using multiple simulations of the PCM combined with 1D modelling studies of the sublimation and self-burying of the ice, we have simulated the evolution of the mid-latitude ice deposits to find that the mid-latitude buried ice layer could be the remnant of a surface ice layer deposited on the surface when the obliquity was beyond 35° [13]. We calculate that a 630 kyr-old surface ice at latitudes 40-55 would now be at depths of 25 to 165 centimeters depending on the wind velocity, albedo, thermal inertia, and the ice dust content. Such modeled depths are consistent with the observations, thus explaining why out-of-equilibrium ice can still be found in these locations. Moreover, the modeled variability explains the observed longitudinal variations.
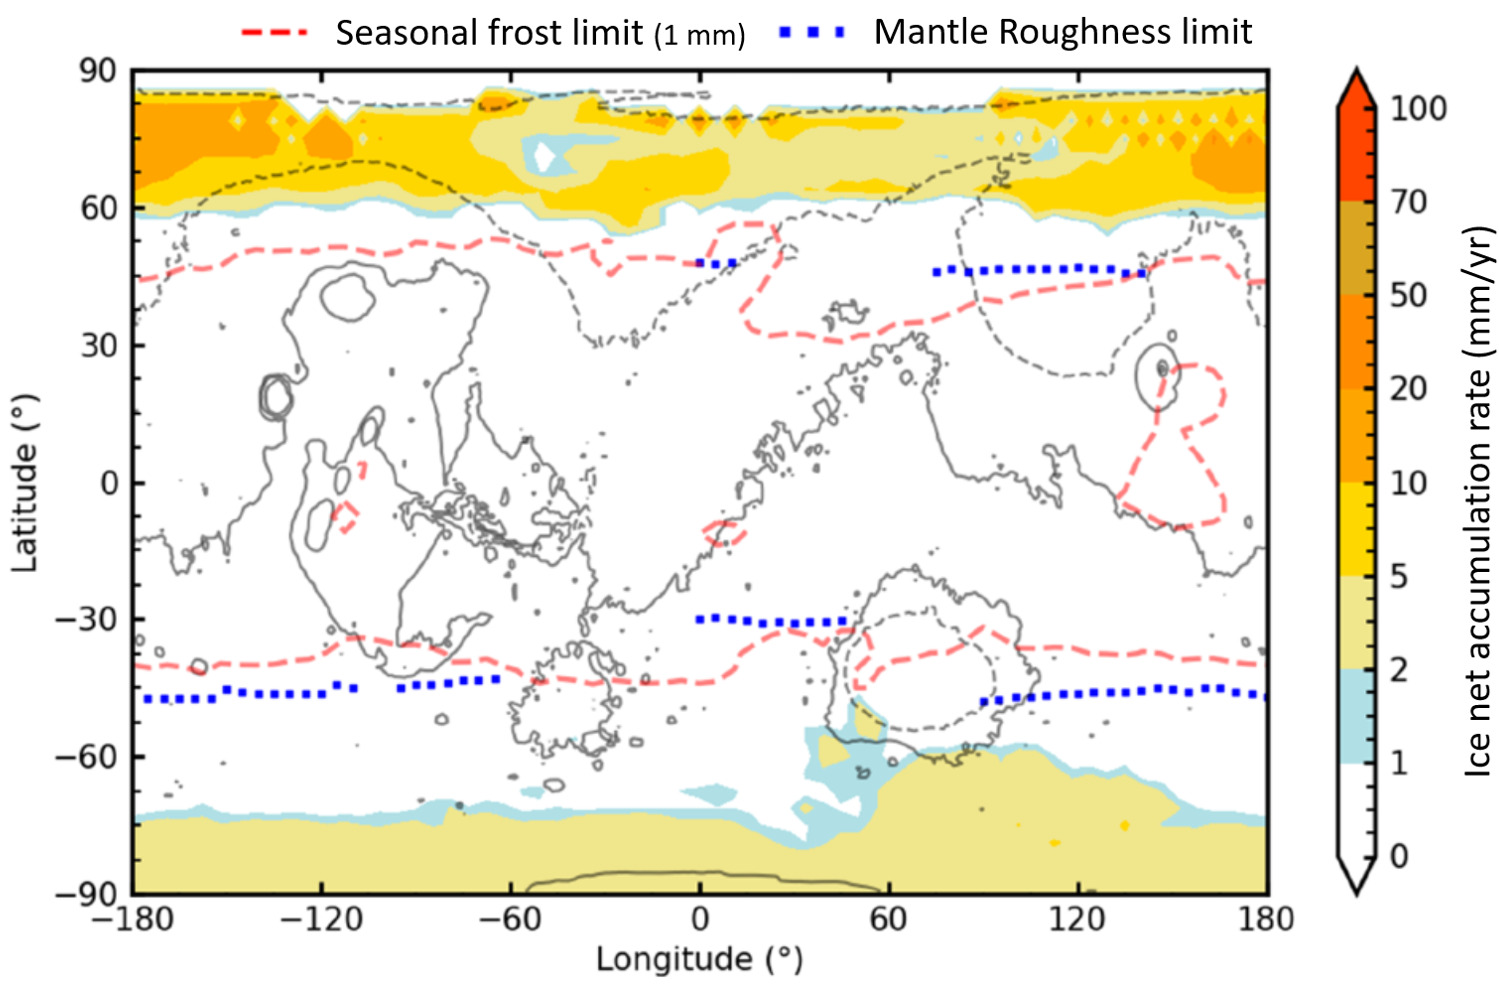
Fig. 1. Net ice accumulation predicted by the Mars Planetary Climate Model assuming an obliquity of 30°, perihelion at northern summer solstice, a snow albedo of 0.7, and a perennial source of water at the north pole like today. Adapted from [11]
References: [1] Head et al. (2003) Recent ice ages on Mars, Nature, 426. [2] Boynton, W. V., Feldman, W. C., Squyres, et al. (2002) Distribution of Hydrogen in the Near Surface of Mars: Evidence for Subsurface Ice Deposits, Science, 297. [3] Mellon, M. T., Arvidson, R. E., Sizemore, H. G., et al. (2009) Ground ice at the Phoenix landing site: Stability state and origin, JGR-Planets 114. [4] Byrne, S. et al. Distribution of mid-latitude ground ice on Mars from new impact craters. Science 325 (2009). [5] Dundas, C. M. et al. Widespread exposures of extensive clean shallow ice in the midlatitudes of Mars. JGR-Planets 126 (2021). [6] Mischna, M. A., Richardson, M. I., Wilson, R. J., and McCleese, D. J. (2003) On the orbital forcing of Martian water and CO2 cycles: A general circulation model study with simplified volatile schemes, JGR-Planets, 108 [7] Levrard, B., F. Forget, F. Montmessin, and J. Laskar (2004), Recent ice-rich deposits formed at high latitudes on Mars by sublimation of unstable equatorial ice during low obliquity, Nature, 431. [8] Forget et al. (2006) Formation of Glaciers on Mars by Atmospheric Precipitation at High Obliquity, Science, 311. [9] Madeleine, J.-B., F. Forget, et al. (2009), Amazonian northern mid-latitude glaciation on Mars: A proposed climate scenario, Icarus, 203, 390–405. [10] Laskar et al. (2004), Long term evolution and chaotic diffusion of the insolation quantities of Mars, Icarus, 170. [11] Naar, Joseph, PhD thesis, Sorbonne Université (2023). [12] Madeleine, J.-B., J. W. Head, F. Forget, et al. (2014) Recent ice ages on Mars: The role of radiatively active clouds and cloud microphysics, GRL., 41, 4873. [13] Vos, E.V., Forget, F.F., Lange, L.L., Naar, J.N., Clement, J.B.C. and Millour, E.M. (2024). Martian Subsurface Mid-Latitude Glaciers Stability and Flux from GCM Simulations. LPI Contributions, 3040, p.1228.
Acknowledgements. This project has received funding from the European Research Council (ERC) under the European Union’s Horizon 2020 research programme (grant agreement No 835275)
How to cite: Forget, F., Joseph, N., Eran, V., Lucas, L., Jean-Baptiste, C., and Ehouarn, M.: Modelling very recent ice ages on Mars with the Planetary Climate Model, EPSC-DPS Joint Meeting 2025, Helsinki, Finland, 7–13 Sep 2025, EPSC-DPS2025-1185, https://doi.org/10.5194/epsc-dps2025-1185, 2025.
Abstract
Geomorphological evidence suggests that early Mars had oceans and valley networks, which implies that it had a dense atmosphere and an active hydrological cycle. However, the effects of orbital obliquity cycles remain largely unexplored. We performed fully coupled GCM simulations with a 2 bar CO₂ atmosphere and an initial 500 m global ocean, varying obliquity (40°±10°) and H₂ concentration (from 0 to 6%) for 1.2×10⁵ years. The results show that obliquity and H₂ significantly influence the climate by controlling surface temperatures and precipitation patterns. Ice sheet growth and melt driven by these variations supplied water for runoff. Our findings suggest that river formation was closely linked to subglacial melting and rain-fed flows, which were modulated by Milankovitch-scale cycles.
Introduction
Geomorphological evidence suggests that early Mars (~3.8-3.6 billion years ago) had liquid water and valley networks (VNs) in a wetter climate [1-4]. Two main hypotheses have been proposed: a warm, wet Mars characterized by rivers fed by rainfall [1-5], and a cold, icy Mars with meltwater from ice sheets [6-8]. Recent climate modelling shows that greenhouse warming by CO₂-H₂ CIA could explain the warming that occurred under high H₂ concentrations [9-16]. However, the role of Milankovitch cycles, especially obliquity variations, in shaping the early Martian climate and VN formation remains poorly understood. In this study, we examine the impact of obliquity-driven climate changes using a fully coupled model of the atmosphere, hydrosphere and cryosphere. This study will be the first attempt to provide a detailed, quantitative assessment of how variations in obliquity may have formed the Martian landscape over hundreds of thousands of years.
Methods
We used three coupled numerical models to simulate early Mars climate evolution: the Paleo-Mars Global Climate Model (PMGCM) [12], the Catchment-based River Simulator (CRIS) [13], and the Accumulation and Ablation of Large-scale ICE-sheets (ALICE) [17]. PMGCM simulates atmospheric and surface processes with ~5.625° resolution and 15 vertical layers up to 60 km. CRIS, coupled to PMGCM, resolves fluvial and sediment transport at ~1.125° resolution. ALICE simulates large-scale ice sheet dynamics and thermodynamics at the same resolution, using a 1 Mars year time step for mass continuity and 10 Mars years for thermal evolution. The early atmosphere was assumed to contain 2 bar of CO₂ with H₂ mixing ratios from 0–6%, and a solar constant of 441 W/m² representing 75% of present-day Mars [18]. Ancient topography prior to true polar wander was applied [19], with geothermal heat flux set to 55 mW/m² [20]. To simulate Milankovitch-scale climate change, we iteratively ran PMGCM–CRIS for 30 million years, followed by ALICE for 15,000 years. This sequence was repeated across one obliquity cycle (1.2×10⁵ years), using sinusoidal variation around a mean obliquity of 40°±10°, with eccentricity neglected to isolate obliquity effects.
Results
With 0% H₂, surface temperatures remained below freezing globally, resulting in significant snow and ice accumulation, particularly in the southern highlands. Increasing the H₂ concentration to 3% produced greenhouse warming, enabling seasonal melting in the low to mid latitudes, where temperatures approached 273 K during low obliquity phases. At 6% H₂, the global mean temperature exceeded freezing, enhancing the potential for rainfall and runoff.
Obliquity variations significantly influenced the spatial distribution of temperature and precipitation. High obliquity increased polar insolation and promoted equatorward water transport, whereas low obliquity resulted in equatorial warming and polar ice melt. These changes, combined with higher H₂ concentrations, increased global precipitation. Ice sheets formed more extensively under variable obliquity due to intensified snowfall and melt cycles. Their melting contributed to surface runoff, particularly in the 3% and 6% H₂ scenarios.
River discharge patterns reflected these climatic shifts. At 3% H₂, simulated rivers aligned well with observed valley networks (VNs), particularly under varying obliquity. At 6% H₂, the highest VN coverage (up to 70.6%) occurred under time-varying obliquity. These results suggest that variations in obliquity driven by Milankovitch cycles enhance climate variability, promoting both ice melt and rainfall-fed runoff. Martian rivers probably formed from a mixture of subglacial meltwater and precipitation, influenced by orbital forcing and atmospheric composition.
Summary and Conclusions
We investigated the long-term climate evolution of early Mars, from the late Noachian to the early Hesperian, using a coupled framework comprising global climate (PMGCM), river (CRIS) and ice sheet (ALICE) models. We performed simulations over a period of 1.2×10⁵ years, considering obliquity cycles (30°–50°), a 2 bar CO₂ atmosphere with H₂ mixing ratios of 0–6%, and ancient topography incorporating ocean and lake reservoirs. Our results demonstrate that variations in obliquity significantly impacted surface temperature, precipitation, and ice sheet dynamics. High obliquity increased polar insolation, while low obliquity favored equatorial warming. H₂-driven greenhouse warming increased global temperatures and precipitation, facilitating ice sheet melting and river formation. At 3% H₂, rivers aligned well with observed valley networks (VNs), whereas at 6%, extensive rainfall and meltwater enhanced runoff and fluvial activity. These findings suggest that rainfall and subglacial melt both contributed to VN formation under dynamically evolving climates.
References
[1] Carr (1995), [2] Hynek et al. (2010), [3] Di Achille and Hynek (2010), [4] Citron et al. (2018), [5] Craddock and Howard (2002), [6] Wordsworth et al. (2013), [7] Fastook et al. (2015), [8] Galofre et al. (2020), [9] Ramirez et al. (2014), [10] Wordsworth et al. (2017), [11] Wordsworth et al. (2021), [12] Kamada et al. (2020), [13] Kamada et al. (2021), [14] Jorge et al., 2024, [15] Steakley et al. (2023), [16] Adams et al. (2025), [17] Kamada et al. (2022), [18] Gough (1981), [19] Bouley et al. (2016), [20] Solomon et al. (2005)
How to cite: Kamada, A., Kuroda, T., Kodama, T., Yoshida, T., Greve, R., Kasaba, Y., Terada, N., and Usui, T.: Milankovitch cycles as a driver of climate variation and fluvial erosion on early Mars before 3.8-3.6 Ga, EPSC-DPS Joint Meeting 2025, Helsinki, Finland, 7–13 Sep 2025, EPSC-DPS2025-562, https://doi.org/10.5194/epsc-dps2025-562, 2025.
Mars has several ice deposits; the North Polar Layered Deposits attract the most interest due to many exposures of a stratigraphy of alternating layers. These layers are believed to indicate variations in polar ice/dust accumulation rate. [1, 2]. At present, surface ice is stable only in the polar regions. But there are remnants of glaciers in the tropics and mid-latitudes. The NPLD dust-rich layers are formed either at low levels of ice accumulation or by sublimation, leaving behind lag layers. During the last 5 Myr, Mars’ obliquity value has varied between 45◦ and 15◦ [3], leading to a significant change in insolation and, as a result, migration of ice. Higher obliquity values lead to NPLD loss, while lower values lead to accumulation, given that a source is present.
Here, we calculate the migration of ice from (to) the NPLD as the obliquity rises (decreases) for a full obliquity cycle (120 kyr), starting at present-day to 45◦ and back to 25◦, using a new approach, asynchronous coupling between the Mars Planetary Climate Model (PCM) [4] and the Planetary Evolution Model (PEM) [5], which smartly extrapolates the tendencies from the PCM. This long 120 kyr simulation is possible due to our latest model developments of the subsurface ice scheme [6] in the Planetary Climate Model and the development of the Planetary Evolution Model [5]
References:
[1] Hvidberg, C. et al. Reading the climate record of the martian polar layered deposits. Icarus 221, 405–419 (2012).
[2] Vos, E., Aharonson, O. & Schorghofer, N. Icarus 324, 1–7 (2019).
[3] Laskar, J. et al. Astron. Astrophys. 428, 261–285 (2004).
[4] Forget, F. et al. J. Geophys. Res. Planets 104 (1999).
[5] Clement, J.-B. et al. A New Long-Term Planetary Evolution Model to Simulate the Formation of Polar Layered Deposits on Mars in 8th International Conference on Mars Polar Science and Exploration (2024), LPI–Contribution.
[6] Vos, E., Forget, F., Cl´ement, J.-B., Lange, L. & Millour, E. The Martian Mid-Latitude Subsurface Ice is the remnant of a past ice sheet.
How to cite: Vos, E., Forget, F., Clement, J., Lange, L., and Millour, E.: A 120,000-year simulation of Mars undergoing an obliquity cycle up to 45◦ and back, EPSC-DPS Joint Meeting 2025, Helsinki, Finland, 7–13 Sep 2025, EPSC-DPS2025-1566, https://doi.org/10.5194/epsc-dps2025-1566, 2025.
The mid-latitudes of Mars harbor significant subsurface ice, representing one of the largest contemporary reservoirs of Martian water. However, the temporal evolution, extent, and drivers of Amazonian glaciation events remain insufficiently characterized. To elucidate this, we conducted comprehensive geomorphological mapping and numerical modeling, revealing a prominent southwestern orientation in ice-rich crater-fill deposits concentrated on northern mid-latitude crater walls and floors. Our detailed analysis identified multiple glaciation stages, notably an early intense phase followed by a subsequent, less intense phase, consistently exhibiting this southwestern depositional bias.
Using high-resolution orbital imagery (CTX, HiRISE) and digital elevation models, we systematically surveyed approximately 750 craters between 20° and 45°N. Depositional patterns align closely with modeled persistent thermal minima, driven by crater microclimates characterized by lower solar insolation and colder temperatures along southwestern walls. This is further supported by wind-driven ice redistribution analogous to terrestrial katabatic processes, suggesting a strong control by localized climatic conditions.
Chronological analyses utilizing crater size-frequency distributions (CSFD) indicate repeated glacial-interglacial cycles with declining intensity toward more recent periods (~98 Ma). Morphological distinctions within concentric ridges and depositional patterns further support these episodic glaciations. Our results demonstrates hemispheric consistency in cold-trap dynamics, suggesting global-scale climatic control modulated by orbital forcing, atmospheric water availability, and regional topographic influences.
Overall, this study enhances our understanding of Mars’ climatic evolution during the Amazonian, highlighting sustained obliquity-driven ice cycles and significant paleoclimatic shifts.
How to cite: Ruj, T., Okuda, H., Komatsu, G., Hasegawa, H., Head, J., Usui, T., Mihira, S., and Kobayashi, M.: Multi-Stage Ice Accumulation in Martian Mid-Latitude Craters During the Amazonian, EPSC-DPS Joint Meeting 2025, Helsinki, Finland, 7–13 Sep 2025, EPSC-DPS2025-2019, https://doi.org/10.5194/epsc-dps2025-2019, 2025.
Introduction: The planet Mars hosts "gullies" [1] — erosional structures resembling those shaped by liquid water on Earth — mainly at the mid-latitudes, with a higher density in the Southern Hemisphere. While most are dormant, some remain active [2], possibly linked to seasonal surface ice [3]. Initially attributed to the action of liquid water [4], gully formation is now thought to predominantly result from processes involving CO2 ice [5, 6]. CO2 sublimation may notably trigger erosion via mechanisms such as geysers formed in translucent slab ice [7]. Other possible contributing mechanisms may rather involve granular CO2 ice or water ice [6, 9, 10]. The use of infrared spectroscopy may help clarify the composition and physical properties of the involved ices.
This study focuses on the Sisyphi Cavi region in the Southern Hemisphere (68.5°S, 1.5°E), a high-latitude outlier known for its active gullies. Previous studies [3, 5, 6], mainly based on HiRISE and CTX (Mars Reconnaissance Orbiter, NASA) imagery, have reported dark spots and erosive flows, though the mechanisms behind these features remain uncertain. Infrared data has been less frequently used [3]. Building on [8], this work incorporates data from CRISM (Mars Reconnaissance Orbiter, NASA) and OMEGA (Mars Express, ESA) to investigate the nature and behavior of CO2 ice, aiming to distinguish between granular and translucent forms and assess their potential roles in gully formation.
Method: CO2 ice spectra from CRISM are modeled assuming a transparent slab. Retrieved thicknesses are compared with climate model predictions to test this hypothesis, following a method previously used at another site [13]. The novelty lies in using multiple slope orientations, allowing relative comparisons that reduce uncertainties in absolute thickness estimates due to orientation-dependent CO₂ ice accumulation — thicker on pole-facing, thinner on equator-facing slopes.
A synthetic spectral database is constructed using CO2 optical constants [11], and resampled to CRISM’s spectral resolution (6.55 nm). A neutral slope spectrum models contaminants (e.g., dust, calibration noise), following a simplified approach from [8]. As shown in Fig. 1, spectra are fitted by minimizing the quadratic deviation, yielding estimates of the slab optical path, CO2 ice purity, and the contamination level. Prior to fitting, CRISM data are corrected for atmospheric effects following the methodology described in [12]. Optical path values are then converted into physical ice thicknesses by incorporating the full acquisition geometry, including slope orientation, slope steepness, and local solar incidence angle. The resulting thicknesses are compared with those predicted by a 1D climatic model [13]. If observed trends align with model predictions, the ice is likely transparent or translucent. In contrast, a mismatch suggests that photons do not traverse the full ice layer, implying the presence of a granular structure at the surface or within the entire ice deposit.
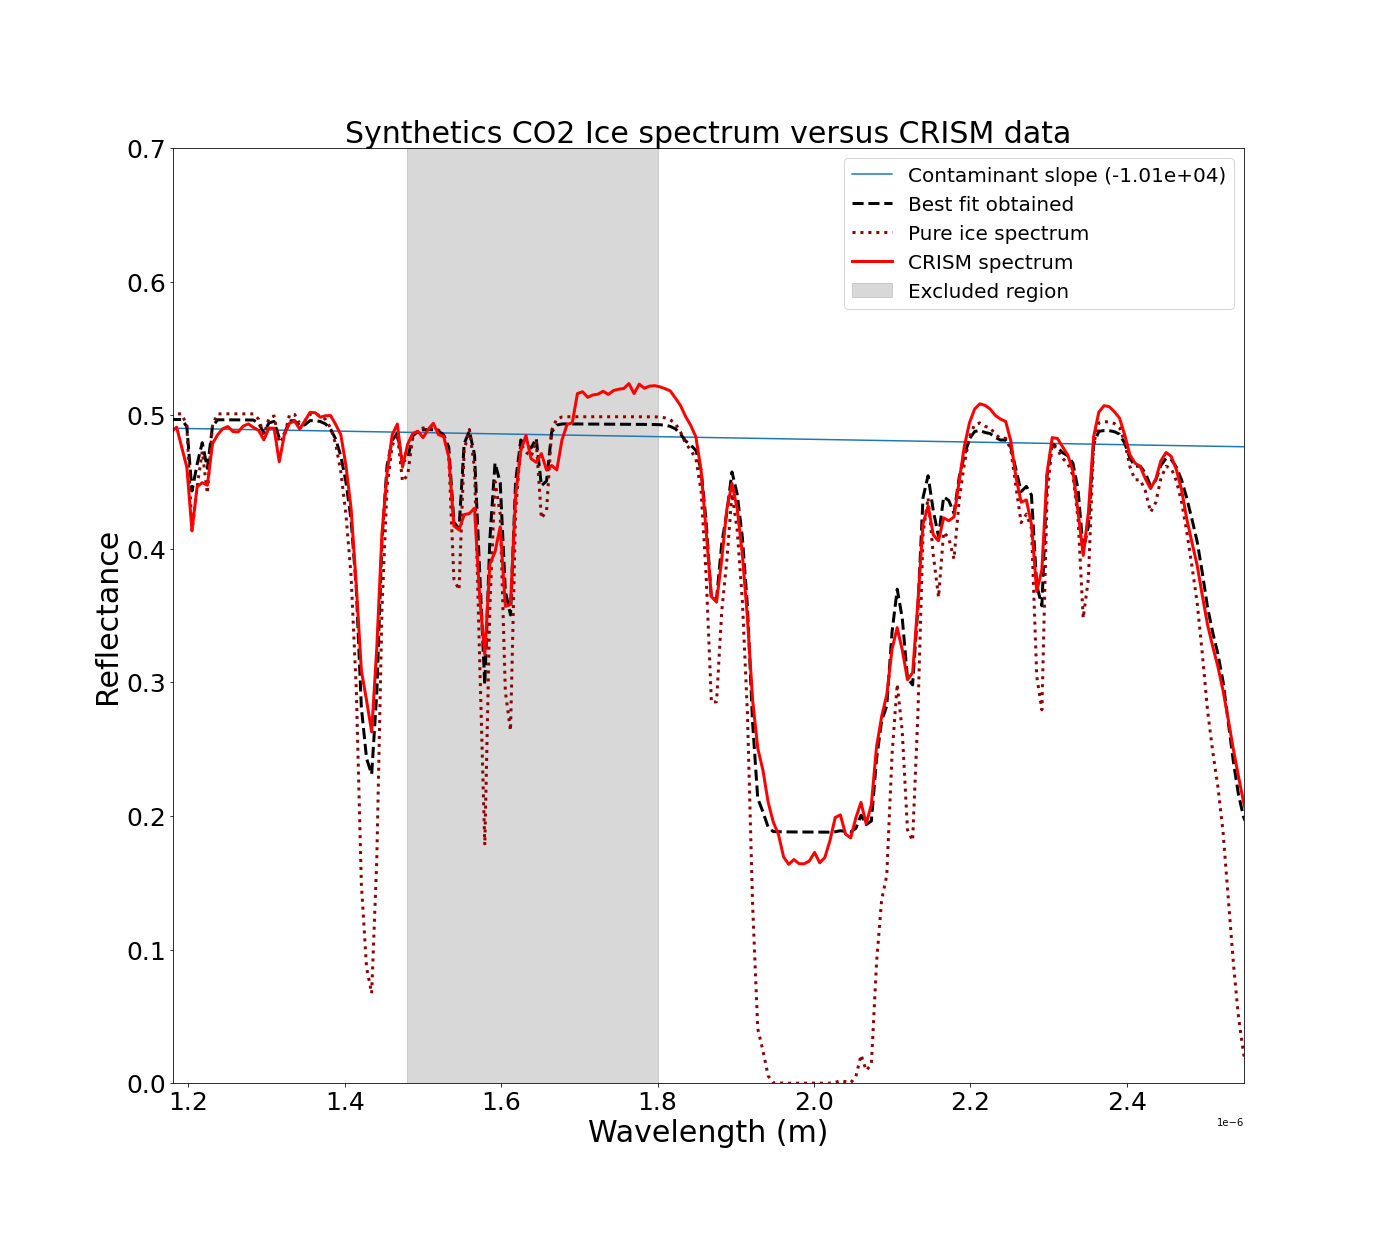
Figure 1: Quadratic fit of a CRISM spectrum at Sisyphi Cavi (Ls 227.02°, MY 29 ; FRT00011935), north-facing slope. After atmospheric correction, the fit yields an optical path of 220 mm and ~ 40% contamination. Solid red: corrected CRISM data; dashed red: pure CO2 model; solid blue: best-fit contaminant; dashed black: final fit. Gray region excluded due to calibration issues.
Discussion: Following the approach used in [8], we optimized the climate model for the region using CO2 ice detections from several datasets [6].
We then compared CO2 ice thicknesses previously derived as a function of slope azimuth from a CRISM observation at Ls 227° [8] with two other periods (Ls 183° and Ls 192°). The new results at earlier Ls also show a trend with slope orientation that suggests translucent ice, similarly to that observed previously [8]. More precisely, these preliminary analyses suggest incomplete transparency: the ice appears to transmit some light but may be mixed with granular components.
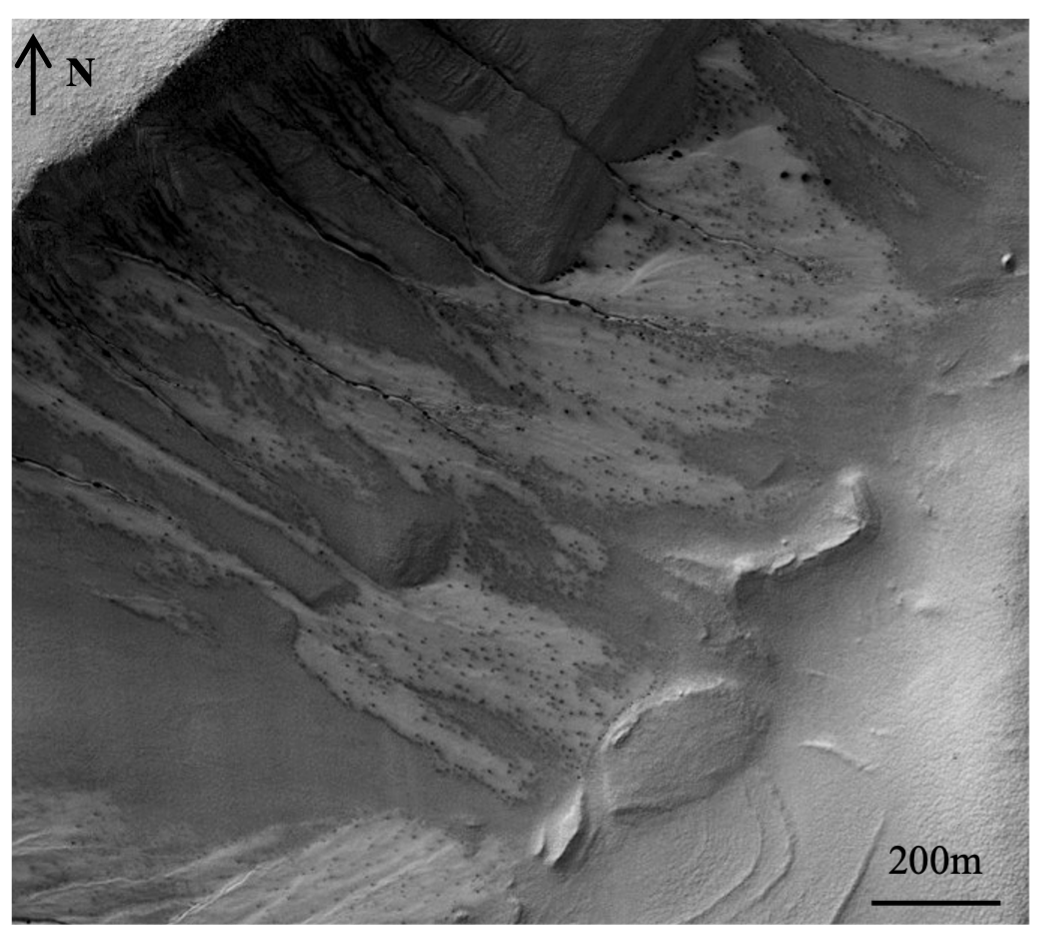
Figure 2: Dark spots and flows on a gullied crater wall in Sisyphi Cavi (Ls 183°, MY 29; ESP_011396_1115), indicative of CO2 geyser activity. Their potential role in gully modification remains debated.
We propose that CO2 ice exists either as fractured translucent blocks or as a mixture of slab and granular structures, for the CRISM observations studied. At first, it could have been in a translucent state (a “slab”), allowing the occurrence of CO2 geysers. During and after the formation of geysers, the ice would break and may have a partly granular structure and/or become contaminated by mineral grains or small grains of CO2 ice. This is supported by the observed dark spots and flows at the same time (Fig. 2, [6]).
To further validate our ice thickness retrieval, we plant to compare it with an independent method based on Bayesian Monte Carlo inversion of a radiative transfer model [14]. This approach is quantitative and already provide clues to demonstrate that ice is translucent in the Richardson crater. Combined with gully activity timing, these findings will help shed light on gully formation and evolution on Mars.
References: [1] Malin, M.C. et al. (2000). Science 288, 2330–2335. [2] Dundas, C.M. et al. (2022) Icarus 386, 115133 [3] Raack, J. et al. (2015) Icarus 251, 226–243 [4] Costard, F. et al. (2002) Science 295, 110–113. [5] Raack, J. (2020). Icarus 350, 113899. [6] Pasquon, K. (2023). Planetary and Space Science 235, 105743. [7] Pilorget, C. et al. (2016), Nature Geoscience 9, 65–69. [8] Leclef A. et al. (2024), LPI Contributions 3007. [9] Vincendon M. (2015), J. Geophys. Res. Planets, 120, 1859–1879. [10] Forget, F. et al. (2024), LPI Contributions 3007.[11] Quirico E. and Schmitt B. (2004) SSHADE/GhoSST (OSUG Data Center), Da-taset/Spectral Data. [12] Vincendon M. et al. (2007), J. Geophys. Res. Planets, 112, E08S13 [13] Vincendon M. et al. (2010) J. Geophys. Res., 115, E10001. [14] Andrieu, F. et al. (2018) Icarus 315, 158–173.
How to cite: Leclef, A., Vincendon, M., Lantz, C., Carter, J., Andrieu, F., Schmidt, F., Conway, S., Massé, M., and Pasquon, K.: Tracking the CO2 Ice Evolution in Sisyphi Cavi Gullies., EPSC-DPS Joint Meeting 2025, Helsinki, Finland, 7–13 Sep 2025, EPSC-DPS2025-1559, https://doi.org/10.5194/epsc-dps2025-1559, 2025.
Seismic data recorded during the InSight mission (Banerdt et al., 2020) have shown that the Martian mantle is distinctly layered. At the core-mantle boundary, a molten silicate layer sits on top of the core that is believed to be enriched in iron and heat-producing elements (HPE), followed by a mushy layer above where melt fractions can be as high as ~60%, which then transitions to the solid mantle (Samuel et al., 2023). Previous numerical studies on the thermochemical evolution of planetary mantles after magma ocean crystallization have shown that stable stratification can occur in the lowermost mantle under certain conditions (e.g. Tosi et al., 2013; Plesa et al., 2014; Ballmer et al., 2017; Samuel et al., 2021), with the most important factor being that density contrast from chemical enrichment in the basal layer is much larger than those from thermal effects. However, most of these studies only perform numerical simulations of the solid mantle right after the magma ocean has crystallized (or during crystallization from a predetermined depth as in Ballmer et al. (2017)), and assume an initial structure that is unstable corresponding to a bottom-up fractional crystallization scenario. In this study, we begin from a compositionally homogeneous mushy Martian mantle and simulate its thermochemical evolution while considering the dynamics of melt percolation, compaction, freezing/melting, and chemical/HPE partitioning similar to Boukaré et al. (2025). Our preliminary results show that (1) it is possible to produce an enriched melt layer at the base of the mantle using a more self-consistent approach with initial conditions prior to full crystallization (Fig. 1), and (2) the degree of stable stratification in the basal melt layer (BML) depends significantly on the amount and timing of iron delivered to the CMB. Furthermore, the survival of the BML depends on how much it can resist erosion from crystallization and iron enrichment at the top of the layer (e.g. Laneuville et al., 2018). Overall, the presence and behavior of the BML play an important role in dictating the heat flux between the core and mantle, providing clues on the thermal and magnetic history of the red planet.
Figure 1: Snapshots of different fields during the solidification of the Martian mantle from an initial mushy state at ~2350 Myr. a. Temperature, b. Melt fraction, c. HPE amount in ppb, and d. FeO concentration. A melt layer enriched in HPEs and iron is found at the bottom.
How to cite: Lim, K. W., Boukaré, C.-É., Samuel, H., and Badro, J.: Self-consistent formation and thermochemical evolution of Mars’ basal mantle layer, EPSC-DPS Joint Meeting 2025, Helsinki, Finland, 7–13 Sep 2025, EPSC-DPS2025-1627, https://doi.org/10.5194/epsc-dps2025-1627, 2025.
Large area three dimensional mapping at metre scale resolution is critical for investigations of the origin and modification of the Martian surface and for the design and operation of landed robotic missions and forthcoming human exploration. The High Resolution Stereo Camera (HRSC) on ESA Mars Express has provided global coverage, but the standard photogrammetric production of level 4 single strip digital terrain models (DTMs) at 50 m/pixel and level 5 quadrangle mosaics remains labour intensive and computationally demanding. Processing a few hundred orbital strips can occupy expert teams for years (Jaumann et al., 2007; Gwinner et al., 2016).
We present an automated refinement pipeline that upgrades the complete HRSC level 4 archive together with the MC quadrangle level 5 mosaics from their native 50 m/pixel resolution to 12.5 m/pixel without manual intervention. The method is implemented within the Free University Berlin Mars Monocular Image to Surface Topography Toolbox (MISToolbox) which will become publicly available in 2025 (Tao et al., in prep.).
The core of the pipeline is based on a u-net structure using multiscale vision transformer (MViT) encoder followed by an interactive fusion decoder. MViT is able to generate feature maps at multiple resolutions to ensure that both fine details and broader contextual information are preserved. This design of the encoder captures global context across the entire image, which is crucial for understanding the low-frequency and high-frequency spatial relationships in large planetary images. The decoder of the u-net then iteratively fuses feature maps from different resolutions, leading to more accurate height/elevation predictions. The decoder avoids the common pitfall of losing local information, which can occur with direct upsampling methods.
Network training employed a combination of HiRISE and HRSC photogrammetric DTMs that were pre filtered to suppress artefacts. Evaluation against independent MOLA reference DTMs and against existing photogrammetric products shows superior accuracy as well as an effective increase in spatial resolution for the refined HRSC products. Effective resolution rises by 3.5 times when assessed with gradient based metrics and craters with diameters down to 300 m are reliably reconstructed (see figure 1).
Throughput on a single NVIDIA RTX3090 GPU is approximately 10 minutes per strip, enabling global reprocessing of the full HRSC catalogue in less than two months. All refined single strip DTMs and quadrangle mosaics together with derivative hillshades will be released through the FUB HRSC repository and the inhouse WebGIS portal by EPSC 2025. We anticipate that these higher resolution HRSC DTM products will become a standard base layer for future geologic mapping and/or landing site certification and planning on Mars.
Figure 1. An overview of the refined MC13E HRSC DTM mosaic (left) and zoom in views of the original DTM shaded relief (middle) and refined DTM shaded relief images (right).
How to cite: Tao, Y. and Walter, S.: Systematic refinement of HRSC level 4 and level 5 DTMs using deep learning, EPSC-DPS Joint Meeting 2025, Helsinki, Finland, 7–13 Sep 2025, EPSC-DPS2025-1713, https://doi.org/10.5194/epsc-dps2025-1713, 2025.
Please decide on your access
Please use the buttons below to download the supplementary material or to visit the external website where the presentation is linked. Regarding the external link, please note that Copernicus Meetings cannot accept any liability for the content and the website you will visit.
Forward to presentation link
You are going to open an external link to the presentation as indicated by the authors. Copernicus Meetings cannot accept any liability for the content and the website you will visit.
We are sorry, but presentations are only available for users who registered for the conference. Thank you.
Dielectric Properties of Magnesium and Calcium Perchlorate Solutions: Implications for Subglacial Liquid Water on Mars
Gabriele Turchetti1, Barbara Cosciotti1, Sebastian Emanuel Lauro1, Elisabetta Mattei1, Elena Pettinelli1
1 Mathematics and Physics Dept., Roma Tre University
*Corresponding author: Gabriele.turchetti@uniroma3.it
Introduction The presence of perchlorates on Mars has been a significant focus of planetary exploration and astrobiology research due to the implications for both potential habitability and geological history of the planet. Calcium perchlorate Ca(ClO₄)₂ and magnesium perchlorate Mg(ClO₄)₂, have been detected through various missions highlighting their widespread presence across the planet [1][2]. The ability of perchlorates to lower the freezing point of water could allow the existence of liquid water solutions under Martian surface. An interesting site is the subglacial liquid water body detected by the Mars Advanced Radar for Subsurface and Ionosphere Sounding (MARSIS [3]) [4][5]. The analysis of perchlorates properties is fundamental to assess the physical-chemical conditions that allow the water to remain liquid in Martian subsurface. This work aims to measure electromagnetic properties of Magnesium and Calcium perchlorates solutions to understand the characteristics of possible stable brines in the Martian subsurface and to explain the conditions of the subglacial lake detected by MARSIS. The general behaviour of a water solution is explained by the eutectic diagram (fig.1 [6]). Key parameters are the eutectic concentration Ce and the eutectic temperature Te. At the eutectic temperature water solutions with eutectic concentration of perchlorates remain liquid even below the freezing point of water. Between the eutectic temperature and the freezing point of pure water, a solution with a lower concentration than the eutectic is in a mixture of ice and brine (mush). Below the eutectic temperature all the solution is frozen. Eutectic parameters change with the salt, then different salts low differently the freezing point of water.
Figure1: Eutectic diagram [5].
Methods We measured the complex dielectric permittivity ε (eq.1) in the temperature range 195K-290K to include the eutectic temperatures of Calcium and Magnesium perchlorates (respectively 198K [7] and 216K [8]) in a radar sounder frequency spectrum (1MHz - 100MHz). At radar frequencies the expected real part ε' of an ice solid solution is around 3.1 and that of liquid water solutions is 80 or above, for the mushy mixture we expected an intermediate value. We computed also the conductivity σ (eq.2) and the apparent permittivity εa (eq.3), indicative of the reflection coefficient Γ12 of an interface between two media with two different permittivity ε1, ε2 [9]. To reproduce MARSIS data consistent with the subglacial water body it should be larger than 30 [4].
Sample preparation The samples are prepared by mixing double distilled water with granular perchlorates and pouring the solution into a measurement cell with a coaxial cage transmission line inside. The cell is placed in an ultra-freezer at the temperature of 193K with a pt100 sensor inserted in the sample to monitor the temperature. After some days, we take out the sample (fig.2) and measure the electromagnetic properties using a Vector Network Analyzer (VNA) increasing the temperature from 195K to the room temperature of 292K. The VNA measures scattering parameters, and the complex permittivity is estimated by applying the Nicholson-Ross-Weir algorithm [10][11]. Further details can be found in [12].
Figure 2: Mushy sample just taken out from the ultra-freezer.
Results We performed measurements with different setups changing the cell length, the concentration, the time inside the ultra-freezer. Fig.3 and 4 show the trends of ε′ and σ with temperature, measured at 4MHz (working frequency of MARSIS), of 5wt% and 10wt% solutions of Mg(ClO₄)₂ and Ca(ClO₄)₂ inside the 150mm cell, after 4 days in the ultra-freezer. The general trend is similar with lower values of both parameters for the lower concentration. The Mg(ClO₄)₂ 10wt% solution did not freeze completely, even below the Te; its ε′ is coherent with a mush. The solution 5wt% froze. Due to its lower Te, Ca(ClO₄)₂ samples did not freeze completely even at lower concentrations. Approaching 273K samples are almost melted and both parameters rise to expected values. For Ca(ClO₄)₂ the εa (fig.5) reaches the critical value to reproduce MARSIS data at 205K.

Figure3: ε' and σ of 2 measurements of different concentration of Mg(ClO₄)₂ solutions.

Figure4: ε' and σ of different measurements of Ca(ClO₄)₂ solutions.

Figure5: εa of Ca(ClO₄)₂ solutions for different measurements. The black dashed line is the critical value of 30 to reproduce MARSIS data, the red dashed line represents the eutectic.
Conclusions These results are important for the comprehension of the stability of perchlorates mushy solutions beneath Martian surface and give information about the possible composition of the subglacial lake detected by MARSIS. Further measurements with other concentrations and perchlorates mixtures will allow a complete understanding of the possible habitability of these environments.
References:
[1] Quinn, R., et al. (2013) Astrobiology, 13(6), 515-520.
[2] Bravenec, A. and Catling, D. (2023) Acs Earth and Space Chemistry, 7(7), 1433-1445.
[3] Picardi, Gand, et al. ISBN 92-9092-556-6, 2004, p. 51-69 1240 (2004): 51-69.
[4] Orosei, Roberto, et al. (2018) Science 361.6401 490-493.
[5] Lauro, S., et al. (2021) Nature Astronomy 5.1: 63-70.
[6] Parkinson, J., et al. JCP: X 5 (2020): 100043.
[7] Rivera-Valentín, Edgard G., et al. Nature astronomy 4.8 (2020): 756-761.
[8] Stillman D. E. and Grimm R. E. (2011) JGR. 116.
[9] Mattei, Elisabetta, et al. EPSL 579 (2022): 117370.
[10] Nicolson, A. M., and G. F. Ross. IEEE 19.4 (1970): 377-382.
[11] Weir, William B. IEEE 62.1 (1974): 33-36.
[12] Brin, Alessandro, et al. Icarus 374 (2022): 114800.
How to cite: Turchetti, G.: Dielectric Properties of Magnesium and Calcium Perchlorate Solutions: Implications for Subglacial Liquid Water on Mars , EPSC-DPS Joint Meeting 2025, Helsinki, Finland, 7–13 Sep 2025, EPSC-DPS2025-105, https://doi.org/10.5194/epsc-dps2025-105, 2025.
Introduction
Studies of terrestrial concretions and their mineralization serve as an important reference point for interpreting geological processes on Mars. In particular, the iron- and silica-rich concretions found in the Dakota and Navajo Formations US, which exhibit signs of ore-related mineralization, may serve as analogs for the structures observed by the Opportunity rover in Meridiani Planum. Analysis of these terrestrial formations enables a better understanding of the genesis of Martian concretions and the potential hydrothermal or diagenetic processes responsible for their formation. Comparing both types of terrestrial concretions and Martian concretions can provide valuable insights into past water activity [1], environmental conditions, and the potential for ore mineralization on Mars.
Research undertaken
For our research, as an analogs of Martian concretions we chose: 1.Utah Dakota Formation concretions 2.Utah Navajo Formation concretions, 3.Romanian „Trovants”-gigantic concretions up to 4.5 meters in diameter Fig.1.
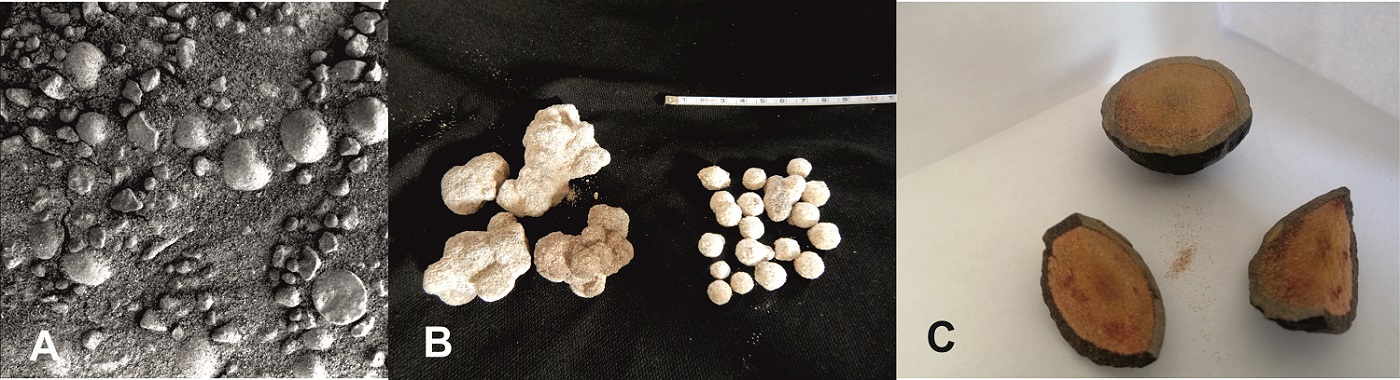
Fig.1. A. Martian spherules. Microscopic camera. Visible spherules on the surface sol 319 (Opportunity rover). Image size 3x3 cm. B. Utah spherules from the Dakota Formation, with leached iron oxides. Some spherules are fused due to mineralization and some are single. Spherule diameter about 1 cm. C. Moqui marbles spherules from the Navajo covered with iron oxides. Spherule diameter about 4-5 cm.
Measurements were made using energy-dispersive X-ray spectroscopy - EDS. The concretions were also examined using a microprobe. Moreover, we used an optical microscope and in most cases have analyzed the content of the main elements.
We also used some of our results based on the Mini-TES infrared spectrometer data from the Opportunity rover [2]. Some of these data was not fully interpreted so far in some aspects. We focused on sols 313 to 325, 329-331 and 382-395 due to the small number of studies of these sectors in. We determined the mineralogical composition using the least-squares method, using the spectra of minerals from the ASU library. The pyrite spectrum was measured in DLR. We used our own software developed by one of the authors (L. Czechowski) to fit the spectra. The results indicate that the Martian concretions (blueberries) may be analogues of terrestrial concretions Fig1.A, [3].
Formation of sandstone concretions
The method of formation of concretions is still a mystery, but many scientists admit that they crystallize in an aqueous environment [1]. There are two types of crystallization of spherules: from the inside to the outside and from the outside to the inside.
The first ones need a core for crystallization, which can be an organic particle (bone, coral shell) or an inorganic one - a grain of sand. See the example of Szczecin concretions on Fig.2. Crystallization can also take place by means of the so-called self-organization of solutions, then the second type of crystallization occurs, a significant example of which can be the Lieseganga rings Fig.3. This second process fits better the formation of hematite spherules from Mars, because they can be compared to sandstone concretions from Utah, in Dakota and Navajo Formation. Hematite migrated there in aqueous solutions and crystallized together with other minerals in the form of concretions [4]. That is why we started researching the above-mentioned concretions.
|
|
|
|
Fig.2. The Szczecin concretions occur in the Oligocene sands of the Szczecin Landscape Park. Geological Museum of the University of Szczecin. |
Fig.3. Liesegang rings on a sandstone boulder. South-East coast of Ireland on the Celtic Sea. |
Results
Copper was found in the Navajo concretions using the EDS method [5]. In the Romanian Trovants, we can see that the cement between the quartz grains is mainly calcium minerals. All the concretions in question were also examined using an electron microprobe. These results confirmed the results from EDS, where in addition to the basic minerals such as potassium feldspars and quartz, sulfates celestine and barite were also identified. In the Romanian concretions, the presence of ilmenite and rutile (possible sources of titanium) was also found, as well as apatite and analcime.
We investigated under an optical microscope Fig.4 and analyzed the major contain of element in feldspars, analcimes, phyllosilicates, epidotes, apatites and phosphates, sulfates, carbonates, iron-titanium oxides, ilmenite, rutile, sulfides, and Fe-rich cement in the six samples concretions from Earth.
Fig.4. A) Plane polarized light optical microscope image of alkali feldspar (Afs) grains cemented by analcime (Anl) in Dakota concretion. B) Cross-polarized light optical microscope image of alkali feldspar (Afs) and microcline (Mcc) cemented by calcite (Anl) in Dakota concretion. C) Cross-polarized light optical microscope image of a silicate grain containing apatite (Ap) surrounded by calcite (Cal) cement in Trovants concretion. D) Plane polarized light optical microscope image of baryte (Brt) in Navajo concretion. E) Reflected light optical microscope image of alkali feldspar (Afs) grains cemented by oxides (Ox) in Navajo concretion. F) Reflected light optical microscope image of pyrite (Py) in Navajo concretion.
Note that our results from Mini-TES indicate the presence of pyrite at some sites. These results will be discussed in [2]. The pyrite may be an indicator of the presence of gold, silver and platinum group metals [6].
Conclusions
The results suggest that at least some of the concretions in Meridiani Planum may have formed through low-temperature ore-related processes, analogous to those observed in the Earth. This supports the hypothesis that ancient Martian environments may have hosted localized hydrothermal systems favorable to metal concentration. As such, these findings strengthen the case that the Martian subsurface could have supported not only the formation of complex mineral structures but also geochemical processes conducive to the accumulation of potentially economically valuable resources.
References
[1] Christensen P. R. et al. (2004) Science, 306. [2] Zalewska N. Czechowski L. Remote Sens., submitted (2025). [3] Chan, M., et al., (2005) GSA Today, 15. [4] Busigny, V., and Dauphas, N., (2007) Earth and Planet. Sci. Let., 254. [5] Zalewska N. et al (2023) LPSC 54th, Abstract # 2932. [6] Ciążela J. et al., (2022) Remote Sens., 14.
How to cite: Zalewska, N., Czechowski, L., Ciążela, J., Marciniak -Maliszewska, B., and Borowska, E.: Identification of ore minerals on Mars based on data from Opportunity rover and researches on terrestrial analogues, EPSC-DPS Joint Meeting 2025, Helsinki, Finland, 7–13 Sep 2025, EPSC-DPS2025-1125, https://doi.org/10.5194/epsc-dps2025-1125, 2025.
Introduction. Several lines of evidence support the idea that Mars once had surface conditions very different from today’s cold, extremely dry environment. In particular, both the planet's morphology and mineralogy indicate that water-rich -and potentially habitable- environments were widespread during its early history [e.g., 1]. This important chapter in Mars' geologic history roughly spans one billion years, comprising the Noachian (4.1–3.7 billion years ago) and Hesperian (3.7–3.0 billion years ago) periods.
During these two epochs, Mars experienced both the peak and the decline of its water activity. Indeed, each epoch’s aqueous processes have distinct mineralogical and geomorphological signatures whose succession indicates a trend toward aridity. In the Noachian, widespread valley networks [e.g., 2] and abundant clay minerals [3] point to sustained surface runoff and alteration by neutral-mildly alkaline water, suggesting a potentially “warm and wet” climate. By the Hesperian, sulfate evaporites [e.g., 3, 4] became more common, and valley network formation declined. Instead, isolated, large-scale floods from underground sources occurred, especially toward the era’s end [5]. These changes reflect reduced surface water and increasingly acidic conditions. The Noachian-Hesperian transition therefore marks an important turning point in the climatic history of the planet. Yet, its timing and characteristics are still poorly constrained.
Study object and target area. The “Equatorial Layered Deposits” (ELDs) are defined as a variety of stratified sedimentary rock outcrops found globally in the Martian equatorial belt. ELDs are characterized by easily erodible hydrated minerals (commonly sulfates) and they can exhibit cyclical light and dark toned layering (Figure 1). The region of Meridiani Planum, hosts many examples of ELDs (here also historically referred to as “etched terrains” [6]) that formed around the Noachian-Hesperian boundary and which represent a key archive of Mars’ past climate. Overall, there is an ongoing debate regarding their formation processes, which remain uncertain [6,7].
Figure 1. Equatorial Layered Deposits as seen by HiRISE (ESP_020138_1845) in Kai crater, Meridiani Planum. Arrows point at the alternating light and dark toned layers.
Scientific objectives. We conducted a detailed analysis of the mineralogy and stratigraphy of the ELDs in selected areas of Meridiani Planum in order to better understand their possible formation processes and derive insights into Mars’ past climatic conditions at the Noachian-Hesperian boundary.
Data and methods. Three relatively small (<= 20 km) craters (Kai crater and two unnamed craters, hereafter termed A and B) are selected in northern Meridiani Planum showing repetitive beddings of light and dark toned layered deposits rich in hydrous minerals. We combined the mineralogical and stratigraphic information of these targets using CRISM (Compact Reconnaissance Imaging Spectrometer for Mars) hyperspectral data and high-resolution Digital Terrain Models (DTMs) derived from HiRISE (High Resolution Imaging Science Experiment) stereo pairs (Table 1) using USGS ISIS and the NASA Ames Stereo Pipeline. The Linear Mixing Models (LMMs) of laboratory endmembers (RELAB) are employed to model the spectral characteristics observed and support their interpretation.
| Target Crater | CRISM ID | HiRISE ID |
| Kai |
FRT00009B5A , FRT0000A553 |
PSP_007440_1845, PSP_007084_1845 ESP_020283_1845, ESP_020138_1845 ESP_020705_1845, ESP_020850_1845 |
| Crater A |
FRT00003E24 |
PSP_002179_1855, ESP_063535_1855 |
| Crater B |
HRL00011403 |
ESP_028630_1805, ESP_028564_1805 |
Table 1. List of CRISM and HiRISE stereo pairs IDs.
Results and interpretation. CRISM spectral data indicate that the ELDs within the three targets consist of alternating layers of sulfate-rich strata (polyhydrated Mg sulfates) and Fe/Mg phyllosilicate-rich layers, such as nontronite or saponite. The interpretation of the spectral features is supported by linear mixing models using laboratory endmembers from the RELAB library. Crater B also presents a substantial component of Al-phyllosilicates (e.g., montmorillonite). Modeling suggests that the Al content in these layers could be two to three times higher than the Fe/Mg content. The presence of Al clay minerals could indicate that crater B was exposed to enhanced weathering and experienced a more acidic environment compared to the other sites.
In all three craters, the layers are generally sub-horizontal, with dip angles below 5°. The thickness of layers which share consistent mineralogy varies, but on average, both Kai and Crater A exhibit beds which are approximately 1 meter thick. In contrast, Crater B displays significantly thinner layers, with an average thickness of about 5 cm per bed.
We propose a formation scenario where the observed ELDs formed as the result of an interplay between groundwater upwelling leading to inter-crater lacustrine environments; atmospheric input of basaltic sediments; and water level oscillations (wet/dry cycles) within the three basins. Differences in mineralogy and bed thickness in crater B were caused by higher-frequency oscillations of the water base level and enhanced weathering due to its more upland position with respect to the other two.
Scientific impact. We find evidence of a much more varied mineral assemblage than previously reported for ELDs in this area. Moreover, the mineralogy and stratigraphy reported place substantial constraints on their formation mechanisms. From a paleo climatic perspective, the complex small-scale relationships between sulfates and clays provide important insights on the Noachian-Hesperian climatic transition. The ELDs were able to record a complex sequence of events, with high frequency oscillations between conditions favouring sulfate deposition and those favouring clay deposition. This pattern suggests that Mars experienced several climatic oscillations during the Noachian-Hesperian transition. Interested readers can refer to the full article [8] for additional details.
Acknowledgements. This project was partially funded by Europlanet RI20-24 GMAP project (research Grant 871149-GMAP).
References. [1] Rickman H. et al., PSS, 116, 70-89 (2019). [2] Alemanno G. et al., ESS, 5(10), 560-577 (2018). [3] Carter J. et al., Icarus, 389, 115164 (2023). [4] Gendrin A. et al., Science, 307, 1587-1591 (2005). [5] Baker V. R. et al., Geomorphology, 245, 149-182 (2015). [6] Hynek B. M. et al., JGR-Planets, 107(E10), 5088 (2002). [7] Pondrelli M. et al., GSA Bulletin, 127, 7-8 (2015). [8] Baschetti B. et al., JGR-Planets, 130, e2024JE008564 (2025).
How to cite: Baschetti, B., Tullo, A., Massironi, M., Carli, C., Altieri, F., Breda, A., Tateo, F., Pozzobon, R., Baroni, M., and Re, C.: Origin and Development of Interbedded Clays and Sulfates in Equatorial Layered Deposits of Meridiani Planum, Mars, EPSC-DPS Joint Meeting 2025, Helsinki, Finland, 7–13 Sep 2025, EPSC-DPS2025-260, https://doi.org/10.5194/epsc-dps2025-260, 2025.
Introduction: As one of the nearest terrestrial planets to Earth within the solar system, Mars has long been a focal point for research regarding surface aqueous activity, which is essential to understand its environmental evolution [1]. Numerous studies have been conducted on the aqueous activity history of Mars through investigations of its surface morphology and lithological/mineralogical characteristics. However, substantial controversies persist regarding the evolutionary trajectory of aqueous environments on Mars and certain hypotheses, particularly those concerning paleo-ocean existence. Consequently, sustained exploration of the Martian surface remains imperative for advancing our comprehension of its aqueous history.
Data and Method: In May 2021, the Zhurong rover safely landed in southern Utopia Planitia (109.925°E, 25.066°N), near a hypothesized ancient Mars shoreline, and performed in situ exploration [2-3]. The Zhurong rover equipped with six scientific instruments—Navigation Terrain Camera (NaTeCam), Multispectral Camera (MSCam), Penetrating Radar (RoPeR), Surface Composition Detector (MarSCoDe), Magnetometers (RoMAG), and Mars Climate Station (MCS) [3]. It has travelled 1,921 meters southward and provided novel scientific data for investigating aqueous activity on Mars. Processing and analysis of these data have yielded a series of significant findings, advancing the understanding of Martian hydrological processes.
Results and discussion:
(1) Evidence for a Hesperian Paleo-Ocean
The paleo-ocean hypothesis postulates the existence of an early Martian ocean during the Hesperian period [4-7], though this remains controversial. Xiao et al. [8] conducted comprehensive analyses of MSCam and NaTeCam image data and identified sedimentary bedding structures exhibiting bidirectional flow patterns, demonstrating remarkable similarity to terrestrial shallow marine depositional environments. These findings provide petrological evidence that supports the presence of a Hesperian paleo-ocean in Utopia Planitia. Furthermore, through integrated analysis of Zhurong's radar data, Li et al. [9] identified multiple inclined sedimentary strata at depths of 10-35 meters beneath the landing site. These subsurface structures show striking analogies to coastal depositional sequences on Earth, offering structural evidence for an ancient ocean in the mid-low latitudes of Mars.
(2) Evidence for Prolonged Aqueous Activity During Late Hesperian
Zhurong's radar RoPeR acquired high-resolution stratigraphic profiles of the shallow subsurface (~80 m depth) in southern Utopia Planitia. Li et al. [10] demonstrated that the sedimentary sequence between 30-80 m depth likely records large-scale flooding events during the late Hesperian to early Amazonian transition, while the 10-30 m interval may represent products of ephemeral floods, prolonged weathering, or impact-generated processes. These observations reveal multiple episodes of aqueous activity persisting through the late Hesperian.
(3) Evidence for Early/Middle Amazonian Aqueous Activity
Zhurong's landing site in southern Utopia Planitia (characterized by low latitude and elevation [11]) represents an optimal location for preserving records of stable surface water. Utilizing data from NaTeCam, the MarSCoDe employing Laser-Induced Breakdown Spectroscopy and the Telescopic Micro-Imager, along with meteorological measurements from MCS, Zhao et al. [12] identified signatures of saline aqueous activity (~760 Ma) and contemporary water vapor cycling in the exploration area.
(4) Late Amazonian Aqueous Activity and Climatic Evolution
In the current Martian environment, hydrological activity is predominantly manifested in polar cap oscillations, with liquid water being exceptionally rare [1]. Zhurong's investigations revealed lithified slab-like crusts enriched in hydrous sulfate minerals. Liu et al. [13] interpreted these crusts as products of groundwater upwelling or capillary evaporation, where saline minerals cemented regolith before lithification, indicating more vigorous late Amazonian hydrologic activity than previously recognized.
Qin et al. [14] conducted comprehensive analyses of dune surface morphology and composition using NaTeCam, MSCam, and MarSCoDe data. They identified diagnostic features including duricrusts, desiccation cracks, granulated surfaces, polygonal ridges, and linear features of water activity. Spectral analyses further revealed the presence of hydrous sulfates, opaline silica, and hydrous iron oxides - definitive mineralogical indicators of liquid water activity in low-latitude regions, suggesting a more humid contemporary Martian environment than conventional models predict.
Liu et al. [15] performed synergistic analyses combining high-resolution orbital imagery with rover-based observations to reconstruct aeolian depositional history. Their investigation of dune morphology, surface textures, and composition revealed stratigraphic evidence for a significant wind regime shift. This climatic transition correlates with ice-dust layer records in mid-high latitudes, suggesting a global "glacial-interglacial" transition approximately 400 ka ago, potentially driven by obliquity variations that redistributed volatiles from mid-low latitudes to polar regions.
The water-related features observations acquired by the Zhurong rover in southern Utopia Planitia - a key low-latitude Martian region - have provided unprecedented insights into the aqueous process. The dataset yields vital constraints for modeling Mars' hydrological evolution from the Hesperian to Amazonian periods. Crucially, these findings will support in guiding the landing site prioritization for China's Tianwen-3 sample return mission, with the expectation of making significant discoveries in the study of habitability on Mars.
References:
[1] Montmessin F, et al. The water cycle, 2017, 18: 338-373. [2] Ding L, et al. Nature Geoscience, 2022, 15(3): 171-176. [3] Liu J, et al. Nature Astronomy, 2022, 6(1): 65-71. [4] Salvatore M R, Christensen P R. Geology, 2014, 42(5): 423-426. [5] Villanueva G L, et al. Science, 2015, 348(6231): 218-221. [6] Duran S, Coulthard T J. Scientific Reports, 2020, 10(1): 18571. [7] Mouginot J, et al. Geophysical research letters, 2012, 39(2). [8] Xiao L, et al. National Science Review, 2023, 10(9): nwad137. [9] Li J, et al. Proceedings of the National Academy of Sciences, 2025, 122(9): e2422213122. [10] Li C, et al. Nature, 2022, 610(7931): 308-312. [11] Wray J J. Annual Review of Earth and Planetary Sciences, 2021, 49(1): 141-171. [12] Zhao Y Y S, et al. National Science Review, 2023, 10(6): nwad056. [13] Liu Y, et al. Science advances, 2022, 8(19): eabn8555. [14] Qin X, et al. Science advances, 2023, 9(17): eadd8868. [15] Liu J, et al. Nature,2023,620(7973):303-309.
How to cite: Liu, J., Li, Z., Li, H., Liu, B., Geng, Y., Zhang, X., and Li, C.: Aqueous Process Record at the Zhurong Landing Site in Utopia Planitia: New Constraints on Martian Hydrological Activity., EPSC-DPS Joint Meeting 2025, Helsinki, Finland, 7–13 Sep 2025, EPSC-DPS2025-513, https://doi.org/10.5194/epsc-dps2025-513, 2025.
The North Polar Layered Deposits (NPLD) of Mars preserve a valuable record of the planet’s climatic history through stacked layers of water ice and dust [1]. These layers are exposed at the surface and can be observed in the optical imagery [2], while subsurface stratigraphy is revealed through radar sounding data [3]. Our study aims to integrate these datasets, to gain a more complete understanding of the geomorphology of NPLD.
We identify and catalog 98 Scalloped Cliffs (SC) across the NPLD using optical imagery (Fig.1), exposed by the troughs using the High-Resolution Imaging Experiment (HiRISE) and Context Camera (CTX) imagery. We use a three-dimensional Shallow Radar (SHARAD) dataset [4] to understand the subsurface stratigraphy of the NPLD. After mapping the scalloped cliffs in JMARS, they are converted as shapefiles to a SeisWare format for comparison with a 3D SHARAD data volume for integrating the topography features with the subsurface stratigraphy. We compared the elevation of the outcropping reflections to exposures at the same elevations and found unique surface morphology of cliffs that immediately overlie angular unconformities.
A SC is a geomorphological feature formed by the protrusion of layers tens of meters tall along several kilometers with a unique wavy appearance. SCs may be isolated or appear in multiples at the same NPLD outcrop and most are associated with identifiable stratigraphic unconformities. The spatial distribution of the identified cliff's location suggests that the scalloped cliffs are more concentrated in the Gemini Scopuli region of Planum Boreum, Mars. We observe that, in some locations, SHARAD reflectors of NPLD reach the surface coinciding with a SC location (Fig. 2), providing an opportunity to investigate if any stratigraphic anomalies like lag deposits can make a bright reflection . Some bright reflections may indicate the presence of relatively erodible beds, possibly at lag deposits, between resistant units [5].
In this study, we examine radar profiles corresponding to the cliffs to assess whether these cliffs coincide in x,y,z with bright subsurface reflectors, and/or a stratigraphic angular unconformity. Some cliffs are not associated with any identifiable unconformities in the imagery, possibly because they manifest as disconformities at the surface, so we examine in the radar data to investigate any subsurface unconformities at the same stratigraphic level. Our technique is to identify the elevation of SCs from MOLA data and unconformities or bright reflectors in SHARAD data with the intent of testing the hypothesis that there is a connection between the exposed bright reflector in the NPLD outcrop and the unconformities.
Most SCs are associated with the reflector 15 (R15, counting from the top) located in the upper NPLD and previously identified as an unconformity and reveals a major climatic shift [6]. A few cliffs are associated with R40, another unconformity in the lower NPLD. Some cliffs are found to be associated with R35, it could be a simple rich deposition layer. Alternate deposition and erosion can lead to unconformities and unconformities can make a lag. These associations between scallop cliffs, unconformity, and bright radar reflectors give strong evidence that the reflectors in the radar are caused by lag deposits. It is not a coincidence that these correspond in position to SHARAD-observed reflections. Our analysis highlights a consistent spatial association between scalloped cliff locations, angular unconformities and strong subsurface reflections, providing a better insight into the erosional and depositional history of the NPLD and is consistent with the findings of Smith et al 2025 [6].
Fig. 1: Optical imagery showing a scalloped cliff directly associated with an exposed outcrop in the NPLD. Location and Image details are highlighted.
Fig. 2: The radar profile shows the scalloped cliff (Fig. 1) associated with a bright reflector (R35) within the exposed outcrop of the NPLD.
References:
[1] Phillips, R.J., Zuber, M.T., Smrekar, S.E., Mellon, M.T., Head, J.W., Tanaka, K.L., Putzig, N.E., Milkovich, S.M., Campbell, B.A., Plaut, J.J., others, 2008. Mars north polar deposits: Stratigraphy, age, and geodynamical response. Science 320, 1182.
[2] Smith, I.B., Holt, J.W., 2015. Spiral trough diversity on the north pole of Mars, as seen by Shallow Radar (SHARAD). J. Geophys. Res. Planets 120, 2014JE004720. https://doi.org/10.1002/2014JE004720
[3] Smith, I.B., Putzig, N.E., Holt, J.W., Phillips, R.J., 2016. An ice age recorded in the polar deposits of Mars. Science 352, 1075–1078. https://doi.org/10.1126/science.aad6968
[4] Foss, Frederick J., et al. “3D Imaging of Mars' Polar Ice Caps Using Orbital Radar Data.” The Leading Edge, vol. 36, no. 1, 2017, pp. 43–57., https://doi.org/10.1190/tle36010043.1.
[5] Lalich, D. E., et al. “Radar Reflectivity as a Proxy for the Dust Content of Individual Layers in the Martian North Polar Layered Deposits.” Journal of Geophysical Research: Planets, vol. 124, no. 7, 2019, pp. 1690–1703., https://doi.org/10.1029/2018je005787.
[6] Smith, I. B., et al. (2025), A Major Climatic Change of the North Polar Layered Deposits of Mars, LPSC LVI, abst 1452.
How to cite: Gopalakrishna Nair, A. and Smith, I.: Scalloped Cliff Formations and Association with Radar Reflectors, a Radar - Imagery Integrated Approach, EPSC-DPS Joint Meeting 2025, Helsinki, Finland, 7–13 Sep 2025, EPSC-DPS2025-322, https://doi.org/10.5194/epsc-dps2025-322, 2025.
Introduction: Bright basal reflections detected by MARSIS (Mas Advanced Radar for Subsurface and Ionosphere Sounding) over four areas, 10s of km across in the Ultima Scopuli region of the Martian South Polar Layered Deposits (SPLD), have been interpreted as evidence of large bodies of liquid briny water (Orosei et al., 2018; Lauro et al., 2021). Little is known, however, of the basement morphology, which is critical to constrain the processes of pooling of the brines. Previous work has focused on the geological interpretation of features surrounding the SPLD (Landis and Whitten, 2022), the morphology and the elevation of the surface of the SPLD at Ultima Scopuli (Arnold et al., 2022; Sulcanese et al., 2023), resulting in conflicting interpretations. The morphometric characteristics and orientation of SPLD scarps can be interpreted to obtain clues on the morphology of the substratum (Byrne and Ivanov, 2004).We present the preliminary results of our investigation of scarps in Planum Australe (Fig. 1) from Context Camera (CTX) imagery, expanding the study area beyond that encompassing the bright basal reflections. Our aim is to compare the features above and around Ultima Scopuli, and to obtain significant statistics on scarps that could aid interpretation. We map the scarps, measure their length and depths, and determine their structural orientation. We compare our results to those obtained in an earlier study of the scarps of the region (Grima et al., 2011) and interpret our results.
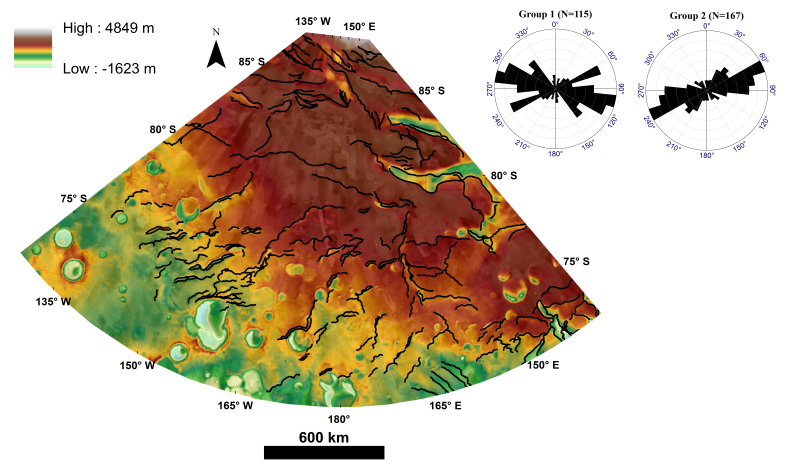
Figure 1. Structural map for the study area in Planum Australe at 1:6,000,000output scale. The rose diagram (top right) shows the trends of the LAPS over the polar stereographic map.
Description: Large asymmetric scarps (Grima et al.’s, 2011, “LAPS”) are characterized by straight sloping face and convex slope. The straight faces are arcuate and cut through the strata of the SPLD. Opposite the straight scarp, a gently sloping convex face is formed by inward dipping strata. The basic morphology of the LAPS indicates faulting of brittlely behaving ice. Their arcuate trace, however, may be related to the presence of impact craters, or reflect wind erosion, as also proposed in previous studies (Grima et al., 2011). Both interpretations are possible, but further work is necessary to clarify the interplay between both processes, and to understand whether any other geological scenario is possible. When observed at larger scale (Fig. 2), the scarps present complex features, possibly produced by sliding of ice along the scarps, which attests to the occurrence of secondary processes overprinting on the primary structural elements. Thus, the scarps represent a record of geologic and climatic processes, acting at different time scales.
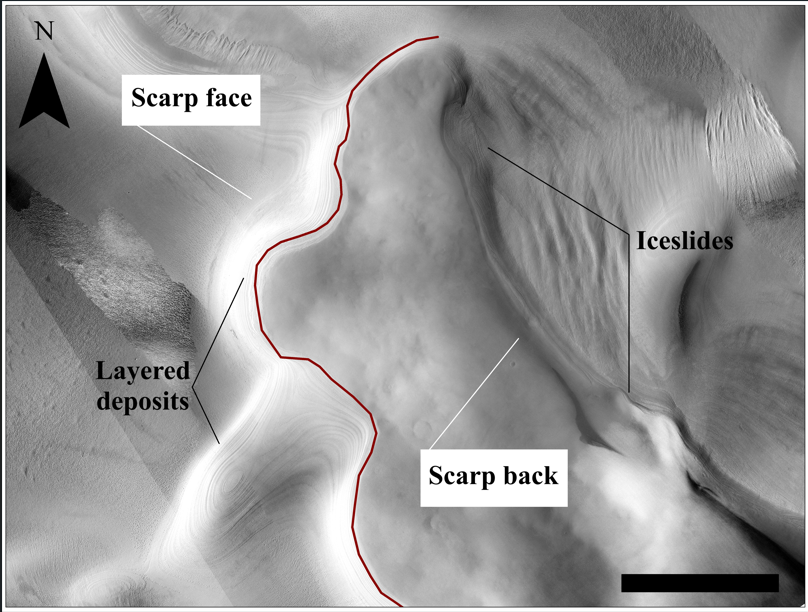
Figure.2. CTX monochrome images show layered deposits and mass waste on the scarp sides.
Spatial distribution and Morphometry: We mapped N=282 scarps, thus increasing the data base of earlier work (Grima et al., 2011). Figure 1 shows the context area, the spatial distribution and orientation of the scarps. The lengths of the scarp traces (Fig. 3) identify two distinct groups: the scarps present in areas of positive Mars Orbiter Laser Altimeter (MOLA) elevation (Group 1, N=115) have lengths ranging between 27 km and 635 km; those at negative MOLA elevation (Group 2, N=167) have lengths between 10 km and 274 km. The horizontal distance between two scarps is correspondingly different. Preliminary measurements on the first group of scarps give values ranging from several km to a maximum measured distance of 270 km, while for the second group we measured distances from a few meters to tens of km. This suggests that the groups identified on the grounds of elevation, are probably too broad from a morphometric perspective, and subclassification is warranted. This has a structural significance and may imply a difference in the shape or thickness of the underlying materials or different compositions. The log-log plot of the cumulative frequency of the scarp lengths (Fig. 4) shows a linear section fitting a power law describing the structural element of the scarps.

Figure.3. Frequency vs. length limits of the 1st (a) and 2nd (b) group of scarps.

Figure 4. Logarithmic representation of the cumulative frequency of scarps (282) versus the length of the scarps track (L).
We measured the orientations of the scarps at regional scale and elaborated them on rose diagrams (Fig. 1). The diagram supports the classification of the scarps in two principal groups with different dominant azimuths: 100 (Group 1) and 65 (Group 2). We define the maximum depth of the trough in between the steep and convex scarps as the vertical distance between the hanging and the footwall of the scarp, measured from MOLA topographic profiles across the structures. A clear distinction between the longer (at higher elevation: depth of trough up to 1.6 km) and shorter (at lower elevations) structures, typically only a few 10 meters deep. The scarp slopes range from ~5°-30°, attesting to the action of secondary processes, such as ice-sliding along the scarp and therefore possible fluidification (after insulation) and solidification in situ of the ice, or mass wasting.
Discussion and Conclusion:
Here we showed that structural elements were overprinted by secondary morphologies typical of geological and climatic processes, which require further investigation. We need to separate the secondary elements from the primary structures to unravel the underlying structure of the strata and of the basement. Our work thus far points to possible differences between the thickness and number of strata in zones of higher and lower elevation, which need to be further investigation. Ultimately, this information is relevant to better constrain the basement morphology in the region of the bright basal reflections.
Acknowledgments: This research was supported by the Italian Government and the Next Generation EU program, Mission 4, Component 1, through project "Assessing the oRigin and stability of mar-tian sub-glacial watErS" (ARES), Unique Project Code C53D23001300006.
References:
Arnold et al. (2022) https://www.nature.com/articles/s41550-022-01782-0
Byrne and Ivanov (2004) https://doi.org/10.1029/2004JE002267
Grima et al. (2011) https://doi.org/10.1016/j.icarus.2010.12.017
Landis ME, Whitten JL (2022) https://doi.org/10.1029/2022GL098724
Lauro et al. (2021) https://doi.org/10.1038/s41550-020-1200-6
Orosei et al. (2018) https://www.science.org/doi/10.1126/science.aar7268
Sulcanese et al. (2023) https://doi.org/10.1016/j.icarus.2022.115394
How to cite: El Yazidi, M., Orosei, R., and Caprarelli, G.: High and low-relief scarps analysis in the south polar layered deposits, Mars, EPSC-DPS Joint Meeting 2025, Helsinki, Finland, 7–13 Sep 2025, EPSC-DPS2025-1954, https://doi.org/10.5194/epsc-dps2025-1954, 2025.
The Martian crustal dichotomy is a prominent but enigmatic feature on Mars, expressed as a morpho-geologic boundary between the heavily cratered southern highlands and the relatively smooth northern lowlands, marking a strong topographic difference. The origins were ascribed to endogenic or exogenic mechanisms occurred at different stages of planet formation. The dichotomy would have subsequently being deformed by several processes such as Tharsis emplacement, extensive erosion, lateral crustal flow, fracturing and normal faulting [1, 2, 3].
The different morphology observed in the west, characterized by a smooth topographic transition (e.g., Arabia Terra), and the east (Nylosyrtis), characterized by a sharp prominent scarp, suggest a different evolution of the dichotomy (Fig. 1). In particular, the eastern dichotomy is dissected by extensional faults [1], distributed for 40–100 km in the highlands. In the corresponding lowlands, a set of compressional features (ridges) distributed parallel to the dichotomy, and, in our opinion, deviating from a pure concentric distribution around Utopia Planitia, are observed up to 1000 km north east of the eastern dichotomy. This is the only area on Mars where extensional faulting occur along and parallel to the dichotomy, associated with subparallel compressional structures in the lowlands; this suggest how this area may have undergone a different, more localized and complex tectonic history.
Fig. 1. Overview of the eastern dichotomy boundary showing the main extensional (black) and compressional (white) structures (from Tanaka et al., 2014), the topography and the study area (white box).
Such a configuration strongly resembles a terrestrial passive margin affected by gravity-driven deformation, in which the continental scarp is affected by an up-dip extensional domain (i.e., extension in the highlands and along the dichotomy) linked to a down-dip compressional domain, (sub)parallel to the extensional (i.e., ridges in the lowlands), through a relatively undeformed transitional domain. A possible gravitational relatively shallow origin for these normal faults have been already suggested but not investigated [2].
In this work we exploit the possibility that the northeastern dichotomy in the Nilosyrtis area was reshaped by gravity driven deformation, constrained by the age of the normal faults distributed along the dichotomy (Late Noachian/Early Hesperian) and of the compressional ridges observed in the lowlands (Early Hesperian). We perform high-resolution photogeological structural mapping (Fig. 2) integrated with 2D kinematic and numerical modelling aiming at characterize the timing of deformation, the depth and the nature of the common basal detachment and the possibility to have gravitational deformation under Martian gravity.

Fig. 2. Map (rotated 40° westwards) showing the gravity-driven fold-and-thrust belt. Its interpreted size is shown by the white polygon, including the detailed mapping of the up-dip extensional, the middle transitional and the down-dip compressional domains. The rose plots represents the orientations frequency of the extensional (light blue) and compressional structures (orange) in the north western, center and south eastern part of the system.
Kinematic modelling (Fig. 3) is applied to selected compressional structures aiming at characterize the depth to the basal detachment within the compressional domain and the amount of compression. To model the compressional structures characterizing the compressional domain, we propose a combined approach based on Area Depth Strain (ADS) [6] and Trishear modelling (TS) integrated with Fault Parallel Flow (FPF) [7]. Depth to detachment within the extensional domain is obtained from the intersection depth of the two faults delimiting grabens, assuming a fault dip of 60°. Indeed, simple grabens are delimited by two antithetic normal faults, whose intersection at depth represents a mechanical discontinuity.

Fig. 3. Resulting possible depths to detachment from the application of the TS, ADS, and grabens’ width methods. The sections are shown from northwest to southeast, being S1 (a), S2 (b), S3 (c), S4 (d) and S5 (e), respectively.
Numerical modelling (Fig. 4) is used to simulate the effect of viscosity, pore pressure and distribution of the common basal detachment in comparison with the development of the three structural domains observed in the study area, under Mars gravity. We provide three models: Model 1 (here not shown) represents a relatively frictional layer resembling an overpressured clay/shale detachment, Model 2 represents a weak viscous-like layer which would simulate a mixture of salt, ice and basalt debris. These two models assume a common and continuous basal detachment in both the highlands and the lowlands. Model 3 represents a more complex stratigraphy where a more frictional shallower detachment is simulated in the highlands while a weak viscous-like detachment is simulated in the lowlands.

Fig. 4. Strain change results of models 2 and 3, showing the main stages of deformation in which clear and observable changes in strain occur. The results are shown with a vertical exaggeration of 1.5.
The results of the applied methods indicate how the distribution of extensional and compressional structures observed in the Nilosyrtis area of the eastern dichotomy is supported by the presence of gravity-driven system. The system is deformed on top of a viscous basal detachment below the lowlands, linked to a more frictional basal detachment in the highlands.
The presence of a frictional detachment in the highlands would be linked to a possible sedimentary interlayer of i.e., eolian nature, between flood basalts. The presence of a weak detachment in the lowlands could be related to a more complex history, supporting the hypothesis of a giant Borealis impact, followed by the precipitation of evaporates from of a hypersaline sea, which may have been later reorganized by subsequent impacts and buried beneath volcanic deposits.
Based on high resolution remote sensing mapping, kinematic and mechanical modelling, we propose the existence of an ancient, partially buried and eroded gravity-driven fold-thrust belt, which occurred along the east dichotomy in the Nilosyrtis area, in a relatively short period comprised between Late Noachian–Early Hesperian. We propose to name it the Nilosyrtis fold-thrust belt.
[1] McGill and Dimitriou (1990). J. Geop. Res. 95, 12595–12605. [2] Nimmo (2005). Geology 33(7), 533–536. [3] Citron et al. (2018). Nature 555, 643–646. [4] Carboni et al. (2019). J. Str. Geol. 118, 210–223. [5] Carboni et al. (2025). Icarus 425, 116330.
How to cite: Carboni, F., Karagoz, O., Ruh, J., and Kenkmann, T.: Gravity-driven tectonics at the dichotomy boundary (Mars), EPSC-DPS Joint Meeting 2025, Helsinki, Finland, 7–13 Sep 2025, EPSC-DPS2025-314, https://doi.org/10.5194/epsc-dps2025-314, 2025.
Keywords:
Eberswalde crater, aeolian bedforms, atmospheric circulation, environmental changes.
- Introduction and objectives
The Eberswalde crater (Fig. 1) (Malin and Edgett, 2003), located at 33° W–24° S, lies to the north-northeast of Holden crater, near a proposed fluvial network connecting Argyre crater to Ares Vallis (e.g., Grant and Parker, 2002). The crater contains a paleolacustrine system (e.g., Pondrelli et al., 2008; Mangold, 2011). The crater's relative age is determined by the extent of Holden crater's ejecta blanket, indicating that Eberswalde formed during the Early to Late Hesperian period (Irwin and Grant, 2011).
Wind erosion and reworking of fluvio-lacustrine deposits has been effective in originating aeolian bedforms.
The objective of this study is to map these bedforms to describe the stratigraphy of aeolian deposits to infer possible changes in wind circulation which would reflect changes in atmospheric circulation, and in turn climate changes on recent Mars.
- Data and methods
The study utilized co-registered and orthorectified HiRISE on board MRO (McEwen et al.,2007) orthoimages and DEMs, processed using Integrated Software for Imagers and Spectrometers, ISIS (Laura et al., 2023) and NASA Ames Stereo Pipeline, ASP (Beyer Ross et al., 2018).
Background images were sourced from Context Camera (CTX) mosaics downloaded at https://murray-lab.caltech.edu/CTX/V01/tiles/. The obtained images were then integrated in a GIS system.
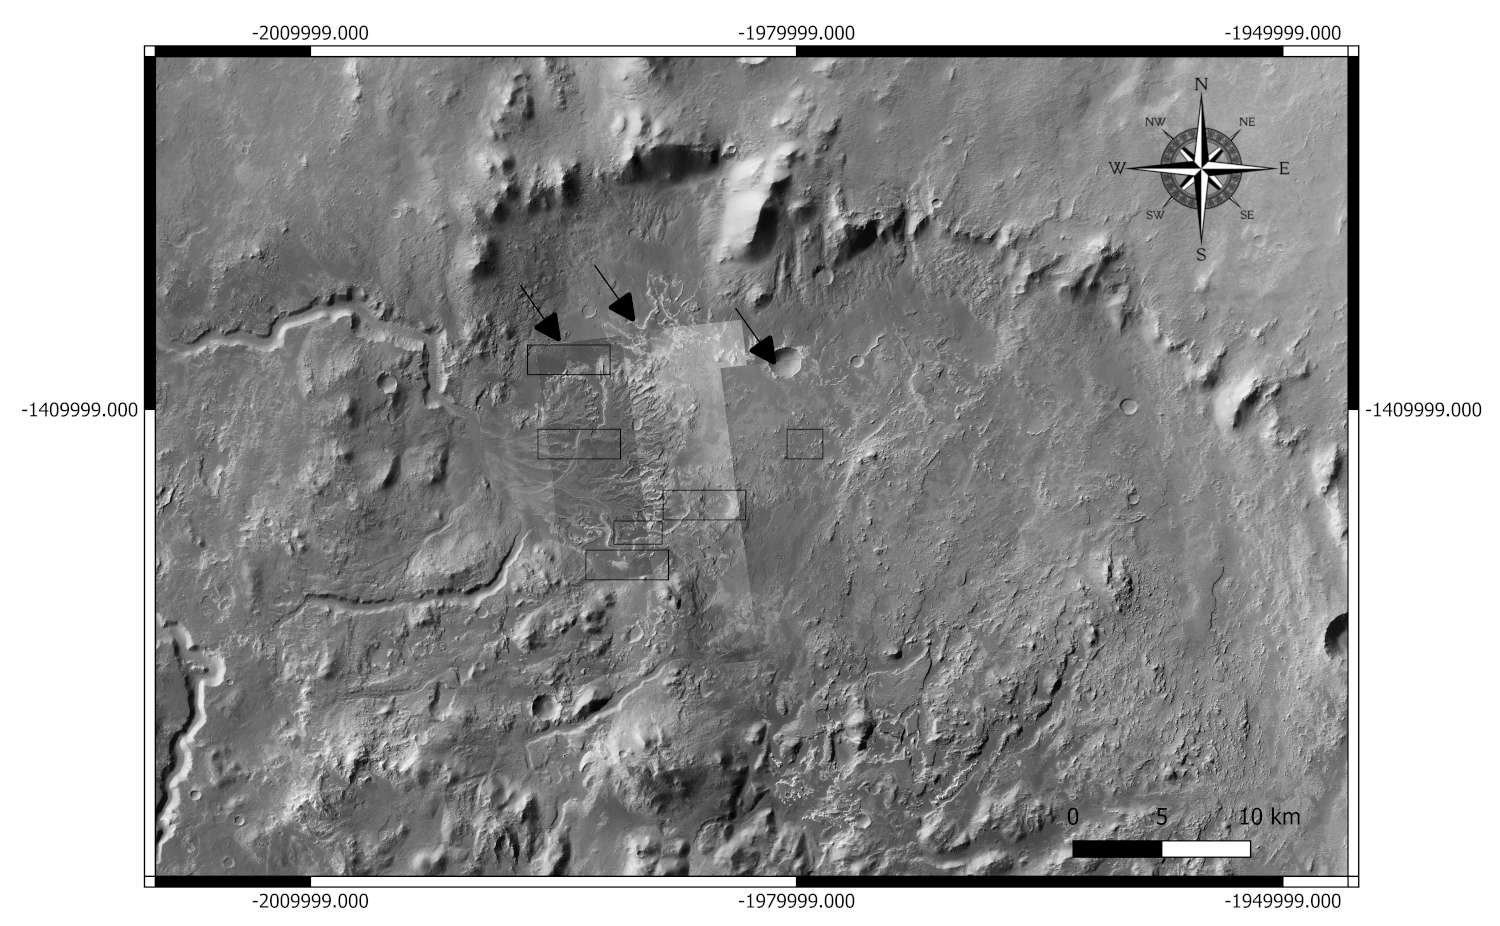
Figure 1. Study area. Black arrows indicate the DEMs used; black rectangles indicate the different areas analyzed. Background CTX mosaic.
- Preliminary results
Some specific exemplary areas where to perform a detailed mapping were selected (fig.1, black rectangles). The aeolian bedforms observed were categorized based on their morphology and stratigraphy.
Following Silvestro et al., (2020) classification, dunes, spaced approximately 260 meters apart, with heights of 1-6 meters, and megaripples, with heights of 1-2 meters and spaced 30-40 meters, were mapped.
The bedforms identified include both star and barchan dunes. The crest length of the bedforms was also measured. The wind orientation and sometimes the wind direction could be inferred (fig.2-4), providing insights into the wind dynamics at the time of their formation. At places older bedforms from an earlier wind generation coexists with recent bedforms from a later generation (fig. 3).In some cases, the more recent bedforms overlapped or truncated the older bedforms. 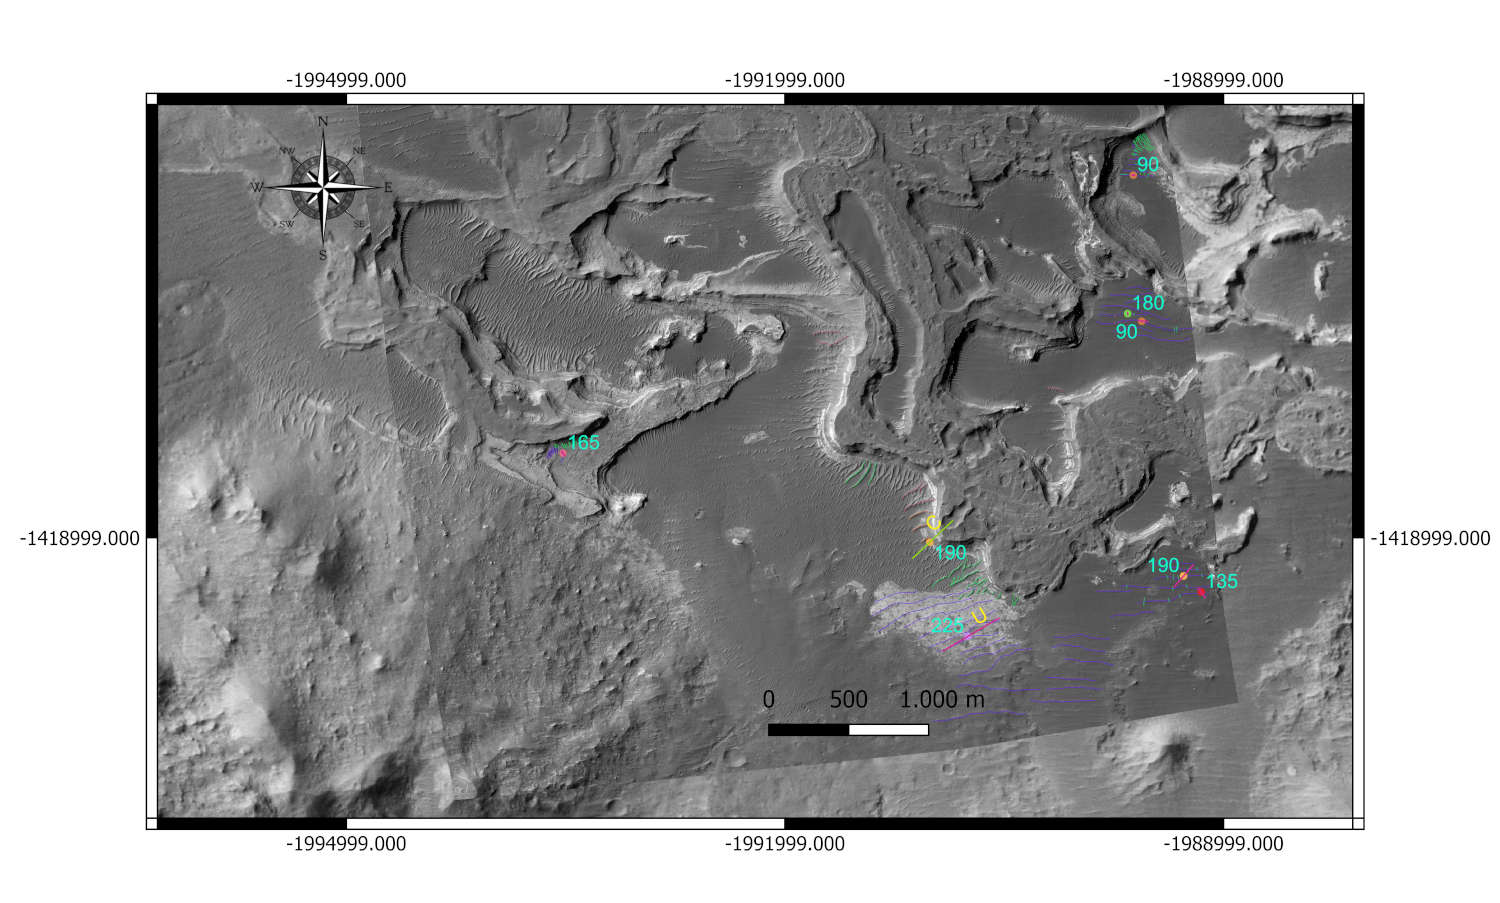
 Figure 2. Overview showing principal parameters across multiple areas, C= certain, U=uncertain,?= indefinite. Numerical values in degrees (°). (HiRISE DEM + CTX).
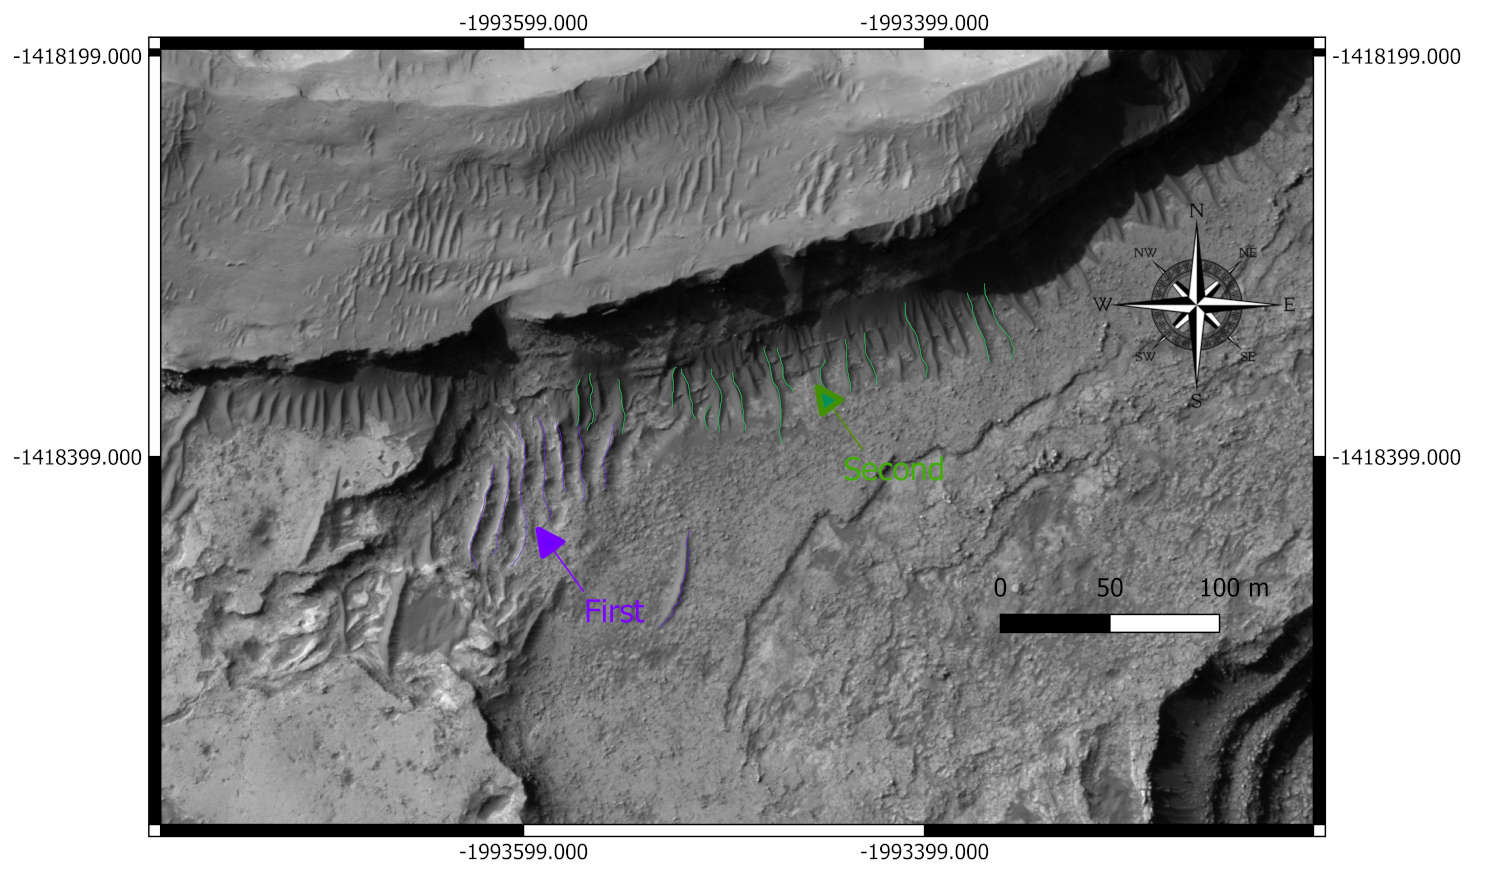
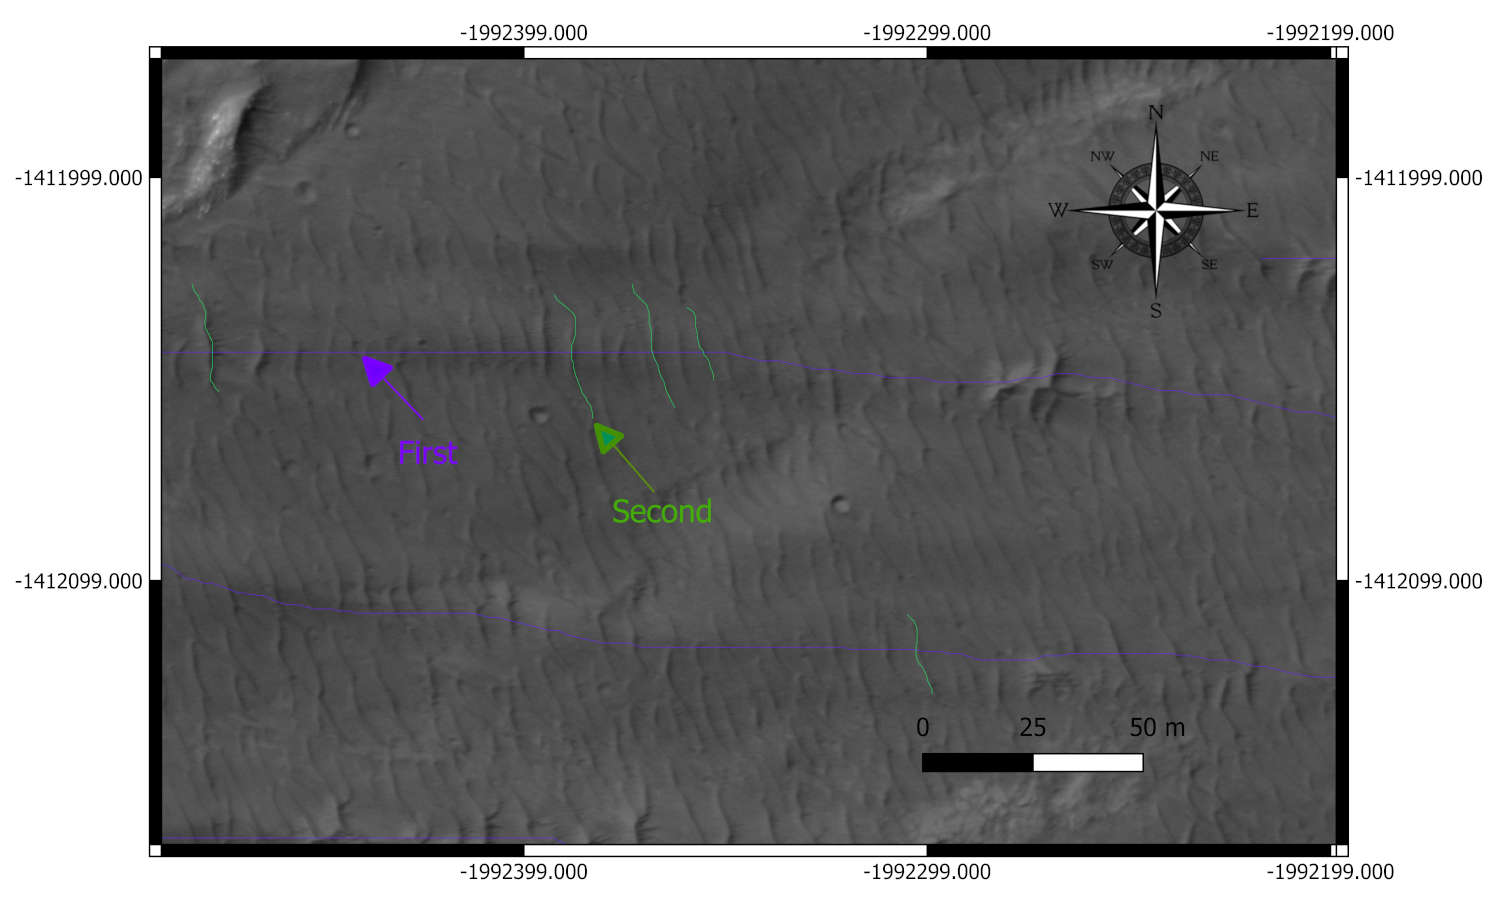
 Figure 3. The coexistence of first bedforms and second. HiRISE DEM.
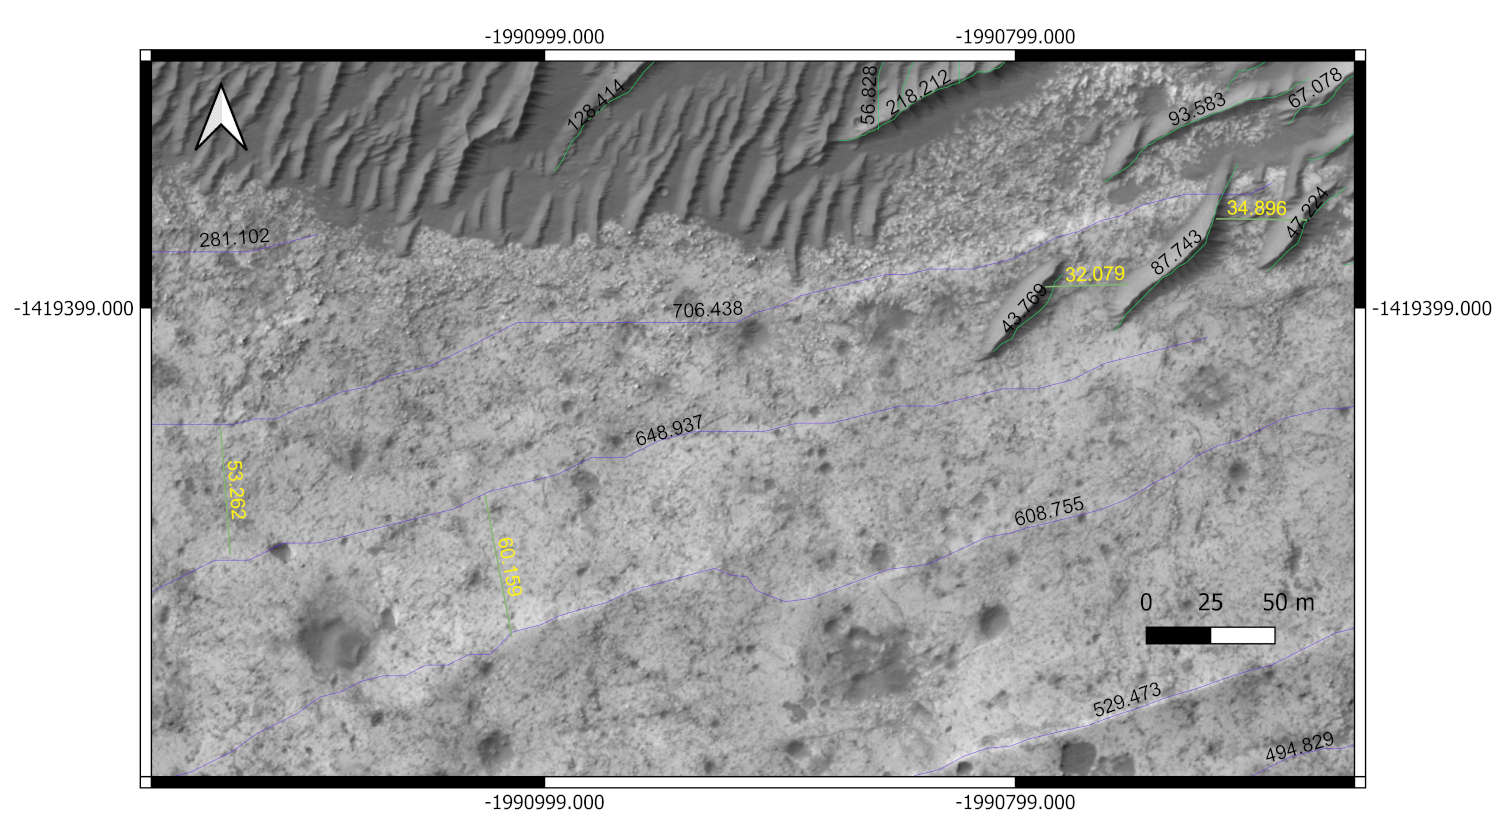
 Figure 4. Detailed view with measured crest lengths (black) and wavelengths (yellow). HiRISE DEM.
- Discussion and future work
The presence of a stratigraphic sequence of bedform deposits indicating different wind generations in the Eberswalde crater suggests a complex history of aeolian activity. The occurrence of least two distinct wind regimes, indicated by bedforms different generations, reflects depositional events driven by varying wind patterns.
The presence of star dunes suggests a dynamic environment with high wind variability, where bedforms elongate along the wind flow and display multiple orientations (Courrech du Pont et al. 2024).
Barchan dunes were also observed, with heights of about 3-4 meters, and their wavelengths varied. Longer wavelengths were associated with the older dunes generation, while shorter wavelengths corresponded to megaripples or recent dunes. It is possible that the changes in spacing indicate shifts in sediment availability.
Ongoing work will include mapping of all the Eberswalde basin in order to realize a stratigraphic column of the aeolian deposits.
Then the wind direction will be inferred for each bedform, taking into account the influence of topography, to ultimately understand wind direction changes through time. Moreover, crater size–frequency analysis will be attempted to try and date the mapped bedforms.
This will refine timing estimates for wind regimes and will constrain the changes in wind circulation pattern and their potential significance for a climatic change.
Acknowledgements
We acknowledge financial support under the National Recovery and Resilience Plan (NRRP), Mission 4, Component 2, Investment 1.1, Call for tender No. 104 published on 2.2.2022 by the Italian Ministry of University and Research (MUR), funded by the European Union – NextGenerationEU– Project Title Tanezrouft salt flat deposits (Sahara Desert): a priority target for a Mars Sample Return mission – CUP D53D23002600006 - Grant Assignment Decree No. 962 adopted on 30/06/2023 by the Italian Ministry of Ministry of University and Research (MUR).
This study was carried out within the Space It Up project funded by the Italian Space Agency, ASI, and the Ministry of University and Research, MUR, under contract n. 2024-5-E.0 - CUP n. I53D24000060005.
REFERENCES
Beyer Ross A. et al (2018) “The Ames Stereo Pipeline: NASA's open source software for deriving and processing terrain data”. Earth and Space Science, 5.
Courrech du Pont, S. et al. (2024) “Complementary classifications of aeolian dunes based on morphology, dynamics, and fluid mechanics” Earth-Science Reviews 255 (2024) 104772.
Grant, J. A. and Parker, T. J. (2002) “Drainage evolution in the Margaritifer Sinus region, Mars” Journal of Geophysical Research 107, 5066 doi:10.1029/2001JE001678.
Irwin, R. P. III, and Grant, J. A. (2011) “Geologic map of MTM -15027, -20027, -25027 and -25032 quadrangles, Margaritifer Terra region of Mars, scale 1:500,000” U.S. Geol. Surv. Sci. Invest. Map.
Laura, J. et al. (2023) “Integrated Software for Imagers and Spectrometers (7.2.0_RC1)”. Zenodo. https://doi.org/10.5281/zenodo.7644616.
Malin, M. C. and Edgett, K. S. (2003) “Evidence for Persistent Flow and Aqueous Sedimentation on Early Mars” Science 302, 1931-1934. doi:10.1126/science.1090544.
Mangold, N. (2011) “Post-early Mars fluvial landforms on mid-latitude impact ejecta” Lunar and Planetary Science XXXXII, p. 1370.
Mcwen, A.S. et al. (2007) “Mars Reconnaissance Orbiter’s High Resolution Imaging Science Experiment (HiRISE)” Journal of Geophysical Research 112, doi:10.1029/2005JE002605. E05S02.
Pondrelli, M. et al. (2008) "Evolution and depositional environments of the Eberswalde fan delta, Mars" Icarus 197, 429-451.
Rice M.S. et al. (2005) “A detailed geologic characterization of Eberswalde crater, Mars” The International Journal of Mars Science and Exploration MARS 1, 1-13, 2005; doi:10.1555/mars.2005.1.0.
Silvestro, S. et al (2020) “Megaripple Migration on Mars” Journal of Geophysical Research: Planets doi:10.1029/2020JE006446.
How to cite: Piscopo, A., Pondrelli, M., Marinangeli, L., and Cavalazzi, B.: Preliminary analysis of aeolian bedforms present in the Eberswalde preserved delta, Mars, EPSC-DPS Joint Meeting 2025, Helsinki, Finland, 7–13 Sep 2025, EPSC-DPS2025-398, https://doi.org/10.5194/epsc-dps2025-398, 2025.
Over nearly two decades numerous studies have revealed evidence for widespread aqueous activities on Mars’ surface, likely occurring from Noachian to Hesperian epochs [1,2]. Clay-bearing deposits are valuable targets to constrain the water history on early Mars and consequently search for signs of life [3]. The possible co-occurrence of carbonates throughout these deposits may also suggest a high potential for biosignature preservation. Nevertheless, the definitive characterization of these deposits remains a challenging task. This study builds upon our previous works [4–6] by focusing on hyperspectral data gathered by the CRISM instrument onboard NASA’s Mars Reconnaissance Orbiter mission [7] to analyze the spectral signatures of clay deposits in the 1–4 µm range, and their potential mixtures with carbonates. We collected data along the Martian crustal dichotomy (Figure 1) – the boundary between the ancient, cratered highlands and the northern lowlands – where extensive clay deposits are exposed, selecting several regions of interest (ROIs). For all ROIs we conducted a spectral survey to determine the exact positions of the band centers for key clay absorptions around 1.4, 2.3, and 2.4 µm, and after applying a continuum removal to emphasize the absorptions. Band centers observed for the clay deposits show some variations from one region to another, as expected from ferromagnesian (Fe,Mg-rich) clays on Mars.
Figure 1 – Global map of Mars with colorized topography (MOLA). We investigated more than 600 CRISM cubes along the crustal dichotomy (color-coded circles). We found ferromagnesian clays in around 400 cubes, mostly concentrated in the vicinity of Mawrth Vallis, Nili Fossae, Libya Montes. Other mineral phases are also detected, such as sulfates in Aram Chaos and Meridiani Planum, or even chlorites in Lyot crater.
Nontronites (Fe-rich) are extensively detected around Mawrth Vallis, whereas saponites (Mg-rich) are more locally distributed across Nili Fossae and Lybia Montes. Oxia Planum – ESA’s ExoMars rover landing site – exhibits more “intermediate” clays such as vermiculites or even ferrosaponites. These variations may depend on the relative abundance of iron and magnesium in the clay structure, or even the oxidation state of iron [8]. Additionally, clay deposits often display a shallow absorption near 2.50–2.53 µm, suggesting the presence of carbonates intermixed with the clays. Overall, the carbonates possibly found in these deposits appear to have variable compositions, spanning within the siderite (Fe-rich) and magnesite (Mg-rich) series. This may indicate the presence of carbonates as siderite/magnesite solid solutions, likely reflecting multiple alteration events [9].
This work follows previous in-situ and orbital measurements and prepares for upcoming missions and campaigns on Mars (e.g., ExoMars rover mission, Mars Sample Return, etc.), by offering a more comprehensive understanding of clay mineralogies to inform the search for biomarkers.
Fundings: This work is supported by the Italian Space Agency (ASI) [ASI-INAF n.23-3-HH.0]
References: [1] Carter et al. (2013) JGR Planets 118: 831–858. [2] Ehlmann and Edwards (2014) Ann. Rev. Earth Planet. Sci. 42:291–315. [3] Vago et al. (2017) Astrobiology 17: 471–510. [4] Brossier et al. (2022) Icarus 386: 115114. [5] Brossier et al. (2023) PSJ 4:27. [6] Brossier et al. (2024) PSS 247: 115924. [7] Murchie et al. (2007) JGR Planets 112: E05S03. [8] Michalski et al. (2015) EPSL 427: 215–225. [9] Beck et al. (2024) Earth and Space Science 11: e2024EA003666
How to cite: Brossier, J., Altieri, F., De Sanctis, M. C., Frigeri, A., Ferrari, M., De Angelis, S., Bruschini, E., Apuzzo, A., Rasmussen, M., and Trisic Ponce, J.: Clay Minerals Distribution across the Martian Crustal Dichotomy: Insights into Aqueous Environments on Early Mars, EPSC-DPS Joint Meeting 2025, Helsinki, Finland, 7–13 Sep 2025, EPSC-DPS2025-467, https://doi.org/10.5194/epsc-dps2025-467, 2025.
Previous studies have shown that the Nepenthes/Amenthes region on Mars contains a large number of unusual kilometer-scale landforms—including cones, domes, and mounds—whose origins remain uncertain. Two main hypotheses have been proposed: one suggests these features are the result of subsurface sediment mobilization, potentially forming Martian analogs to terrestrial mud volcanoes, while the other attributes them to explosive volcanic activity involving magma–water interactions. This study aims to shed new light on this debate by analyzing the morphological and morphometric properties of these landforms.

Fig. 1: Examples of cones, and mounds in the Nepenthes/Amenthes. Based on CTX global mosaic.
The Nepenthes/Amenthes region, located at the boundary between the southern highlands and the northern lowlands of Mars, displays significant morphological diversity. The area's geological history includes tectonic deformation, sedimentary processes, and possible volcanic activity (Tanaka et al., 2003; 2005; Skinner and Tanaka, 2007). One interpretation considers the observed conical and mound-like features as sedimentary in origin—specifically, mud volcanoes. This view is supported by similarities to analogous structures in Azerbaijan and by the absence of characteristic volcanic features such as lava flows or well-defined craters (Skinner and Tanaka, 2007). Additional arguments include their isolation from known volcanic centers, lack of dike-related surface expressions, occurrence within a narrow latitudinal and elevation band, and the setting in a compressional tectonic regime between impact-generated structural rings of Utopia basin —conditions favorable for fluid overpressure and sediment mobilization.
Alternatively, another study argues these landforms are volcanic in origin, formed by explosive phreatomagmatic eruptions resulting from interactions between magma and water (Brož and Hauber, 2012). Their morphological resemblance to terrestrial tuff rings and cones, which feature shallow craters surrounded by ring-shaped ejecta deposits, supports this view (Lorenz, 1986).
Similar features have been identified elsewhere on Mars. In the Lederberg Crater, conical structures are interpreted as volcanic due to the surrounding igneous geological context. In contrast, pie-like mounds in Chryse Planitia are considered products of sediment mobilization based on their environmental setting (Komatsu et al., 2016; Brož et al., 2019; 2021). However, a detailed morphological and morphometric comparison between the pie-like mounds of the Nepenthes/Amenthes and Chryse Planitia regions has not yet been conducted (Fig. 2).

Fig. 2: Examples of mounds in the Nepenthes/Amenthes (a-c) and Chryse Planitia (d-f) regions.
To address this gap, we performed a comparative analysis of these features in both regions. We used the global Context Camera (CTX) mosaic compiled by Dickson et al. (2024), which provides ~5 m/px resolution imagery from the CTX instrument aboard the Mars Reconnaissance Orbiter (MRO; Malin et al., 2007). This dataset enabled us to identify and map kilometer-scale landforms and their associated flow-like structures. For finer-scale analysis, we used selected HiRISE images from the same spacecraft, which offer a resolution of approximately 50 cm/px (McEwen et al., 2007). Elevation data were derived from a blended digital elevation model with 200 m/px resolution, combining data from the Mars Orbiter Laser Altimeter (MOLA), and the High-Resolution Stereo Camera (HRSC; Gwinner et al., 2016).
To quantify the morphological similarity between features in the two study regions, we measured key morphometric parameters, including feature width, circularity, and height. These measurements form the basis for comparing the two populations and contribute to a better understanding of the processes that shaped them.
References: Komatsu et al. (2016), Icarus, 268; Brož et al. (2019), J. Geophys. Res., 124.; Brož et al., (2021), Icarus, 382, Skinner and Tanaka (2007), Icarus, 186, Gwinner et al. (2016), Planetary and Space Science, 126; Tanaka et al. (2003), J. Geophys. Res., 108(E12) ; Tanaka et al. (2005), Geologic map of the northern plains of Mars; Lorenz (1987), Chem. Geol., 62, McEwen et al. (2007), J. Geophys. Res., 112; Malin et al. (2007), J. Geophys. Res., 112.
Acknowledgements:: This work was funded by the Czech Grant Agency grant No. 25-15473S.
How to cite: Rolland, M., Brož, P., and Hauber, E.: Pie-like Mounds on Mars: A Comparative Morphometric Study of Features in Nepenthes/Amenthes and Chryse Planitia, EPSC-DPS Joint Meeting 2025, Helsinki, Finland, 7–13 Sep 2025, EPSC-DPS2025-473, https://doi.org/10.5194/epsc-dps2025-473, 2025.
Introduction
The documented climate change on Mars between the late Noachian and the Hesperian marked a shift from relatively humid to arid-cold conditions (e.g., McLennan et al., 2019 and references therein). While the broad trajectory of this evolution is established, the controlling factors, the contribution of periodic versus episodic events, and the precise timing remain largely unresolved. Sedimentary deposits are key archives of past environments and of their changes through time. Arabia Terra represents a key region for analyzing these records. Unlike most of Mars, it is a gently sloping region that links southern highlands and northern lowlands (Fig. 1), allowing for a more extensive distribution of sedimentary environments. Moreover, the region hosts abundant and well-preserved sedimentary landforms and deposits exhibiting stratigraphic, geomorphological, and mineralogical characteristics (e.g., Pondrelli et al. 2015; Davis et al., 2016; Salese et al., 2019; Schmidt et al., 2021). We aim to reconstruct the lateral distribution (environment associations) and vertical evolution (stratigraphic trend) of these deposits and morphologies. Here, we present our preliminary results based on both new analyses and critical reassessment of existing literature, with the goal of defining the elements for a future cartographic legend.
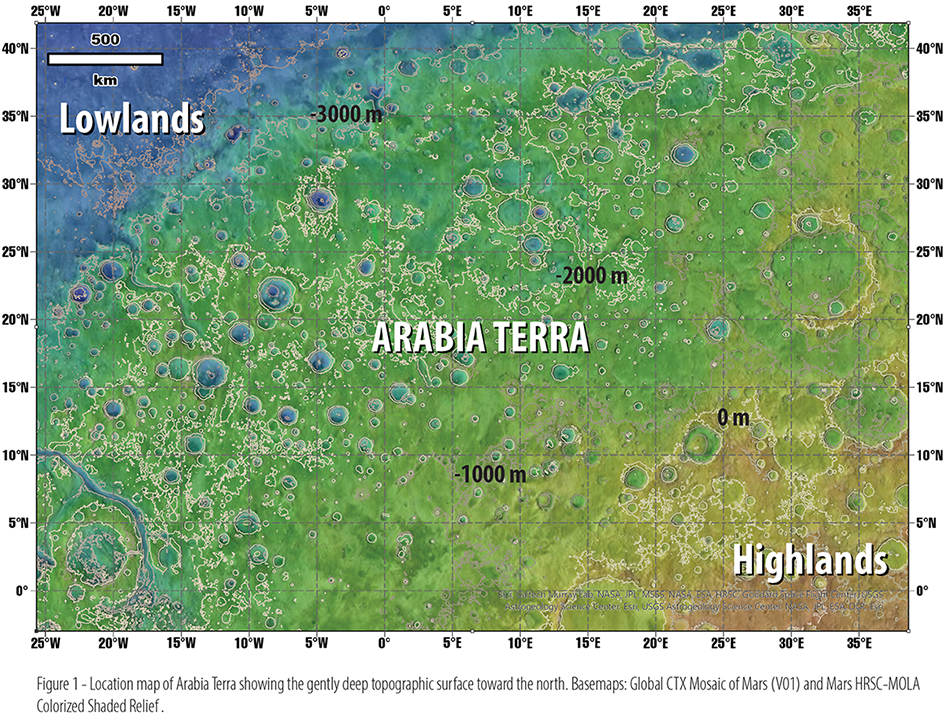
Data and Methods
Our approach combines regional-scale and basin-scale analyses. At the regional level, we employed Thermal Emission Imaging System (THEMIS) imagery (resolution ~100 m/pixel) and Context Camera (CTX) data (~6 m/pixel), supported by digital elevation models (DEMs) derived from High Resolution Stereo Camera (HRSC) data (~50 m vertical resolution). For finer-scale analyses, in areas with pristine preservation of deposits/features and high-resolution data availability, CTX data were integrated with High Resolution Imaging Science Experiment (HiRISE) images (~30 cm/pixel). Topographic data at this scale were obtained using stereo-pairs from CTX (~12 m/pixel vertical resolution) and HiRISE (~1 m/pixel vertical resolution), processed with NASA’s Ames Stereo Pipeline. Preliminary compositional data were derived from the Mars ACT-REACT QuickMap interface, allowing for the identification of mineral phases based on CRISM data.
Sedimentary Deposits in Arabia Terra
Sedimentary materials in Arabia Terra dating to the Noachian and Hesperian periods can be broadly classified into two main types: fluvio-lacustrine deposits, which are relatively well understood in terms of origin and processes and light-toned layered deposits (LTDs), whose genetic interpretations remain debated.
Phyllosilicate-bearing fluvial channels have been documented in intercrater plains (e.g., Davis et al., 2016), sometimes forming part of open-lake systems. These channels can be either incised or exhumed, reflecting the differential erosion of previously existing floodplain sediments (Fig. 2A). Closed paleolacustrine systems have been observed within deep craters (Salese et al., 2019), hydrologically isolated from surrounding intercrater plains and interpreted to have been fed primarily by groundwater upwelling through sapping channels (Fig. 2B). Deltas associated with these systems show evidence for water level fluctuations, ultimately culminating in lake-level decline and desiccation.
The fluvio-lacustrine systems are locally overlain by LTDs in both intercrater and intracrater settings (Fig. 2A). Intercrater LTDs display etched or flat-lying surfaces shaped by wind erosion, though locally they show duneforms and evidence of cross-bedding. LTDs mineralogy shows a latitudinal trend: phyllosilicates dominate in northern Arabia Terra, while sulfates are more common in the south. In some locations, a gradual vertical transition from clay-rich to sulfate-rich layers has been identified, reminiscent of those documented in Meridiani Planum (Flahaut et al., 2015).
Intracrater LTDs can form crater bulges or flat surfaces and may display features such as terraces or erosional bedrock channels cutting the inner crater rim (Fig. 2C). Their thickness appears to decrease northward (Schmidt et al., 2021), reaching > 2 km where crater-centered bulges are developed (Pondrelli et al., 2015).
Some LTDs may have formed in hydrothermal settings. This hypothesis is supported by the presence of mineral assemblages such as Mg–Fe phyllosilicates and carbonates (Michalski et al., 2013), as well as by the occurrence of filled fractures and mounds that suggest fluid expulsion. Although some of these features may be erosional remnants, others appear as depositional (Fig. 2D), based on their shape and their relationships with potential erosional patterns (i.e., wind direction).
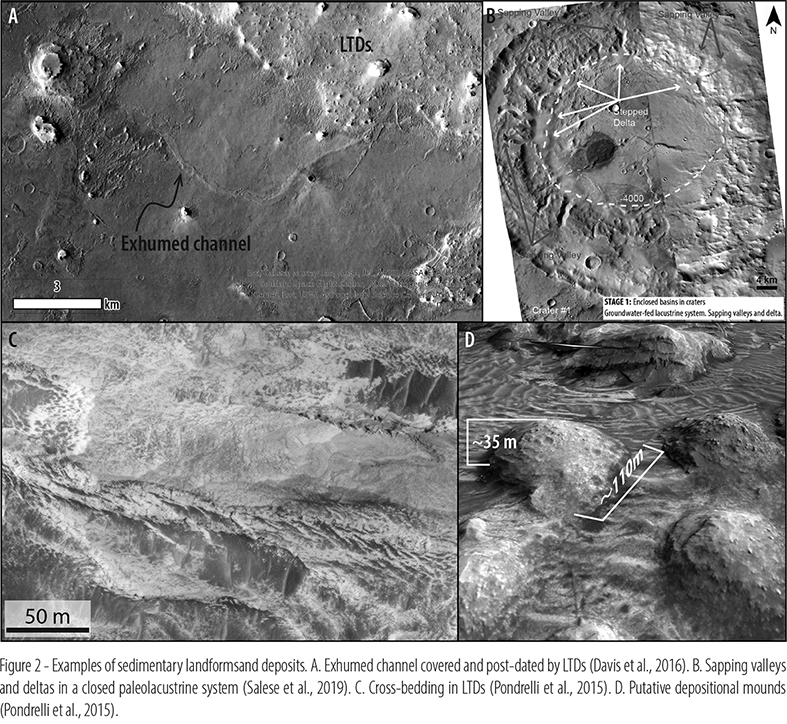
Future Work
The next phase will involve systematic mapping of the distribution of the presented elements at a regional scale with associated metadata, including their geometries (qualitative-quantitative), stratigraphic relationships, and compositional characteristics. Depositional processes and stratigraphic evolution will be refined using detailed geological mapping of selected key areas. In addition, published geologic maps will be updated to incorporate recent hyperspectral data into the legend description.
Acknowledgments
We acknowledge financial support under the National Recovery and Resilience Plan, Mission 4, Component 2, Investment 1.1, Call for tender No. 104 published on 2.2.2022 by the Italian Ministry of University and Research, funded by the European Union – NextGenerationEU–Project Title Tanezrouft salt flat deposits (Sahara Desert): a priority target for a Mars Sample Return mission – CUP D53D23002600006 - Grant Assignment Decree No. 962 adopted on 30/06/2023 by the Italian Ministry of Ministry of University and Research.
This study was carried out within the Space It Up project funded by the Italian Space Agency, ASI, and the Ministry of University and Research, under contract n. 2024-5-E.0 - CUP n. I53D24000060005.
References
Davis, J. M., Balme, M., Grindrod, P. M., Williams, R. M. E., & Gupta, S. (2016). Extensive Noachian fluvial systems in Arabia Terra: Implications for early Martian climate. Geology, 44(10), 847–850. https://doi.org/10.1130/g38247.1
Flahaut, J., et al. (2015). Embedded clays and sulfates in Meridiani Planum, Mars. Icarus, 248, 269–288. https://doi.org/10.1016/j.icarus.2014.10.046
McLennan, S. M., et al. (2019). The Sedimentary Cycle on Early Mars. Annu. Rev. Earth Planet. Sci., 47, 91–118. https://doi.org/10.1146/annurev-earth-053018-060332
Michalski, J. R., et al. (2013). Groundwater activity on Mars and implications for a deep biosphere. Nature Geoscience, 6(2), 133–138. https://doi.org/10.1038/ngeo1706
Pondrelli, M., et al. (2015). Equatorial layered deposits in Arabia Terra, Mars: Facies and process variability. GSA Bulletin, 127(7/8). https://doi.org/10.1130/B31225.1
Salese, F., et al. (2019). Geological Evidence of a Planet-Wide Groundwater System on Mars. JGR Planets, 124(2), 374–395. https://doi.org/10.1029/2018je005802
Schmidt, G., et al. (2021). Depositional controls of the layered deposits of Arabia Terra, Mars: Hints from basin geometries and stratigraphic trends. JGR Planets, 126(11). https://doi.org/10.1029/2021je006974
How to cite: Pondrelli, M., Salese, F., Mancini, F., Caddeo, Y., Piscopo, A., Kokin, O., Ranieri, B., and Cavalazzi, B.: Noachian-Hesperian Sedimentary Evolution of Arabia Terra, Mars: Preliminary Insights, EPSC-DPS Joint Meeting 2025, Helsinki, Finland, 7–13 Sep 2025, EPSC-DPS2025-746, https://doi.org/10.5194/epsc-dps2025-746, 2025.
For the study of the aqueous history of Mars, the knowledge of mineral characteristics for specific geologic environments is essential [1]. Previous studies of regions on Earth suitable as analogs for studying geological processes on planetary surfaces, such as the Italian island Vulcano [2] already enabled the identification of secondary sulfate minerals formed by acid alteration of volcanic deposits due to fumarolic activity. In this work, we extend this study with the spectral investigation of alteration minerals measured on the volcanic island Milos (Greece) during fieldwork performed in 2024.
Milos is a volcanic island in the Aegean Sea and a part of the subduction-related South Aegean Volcanic Arc [3]. Hydrothermal activity changed the initial composition of the rocks and led to the formation of various secondary minerals - making the island an ideal location to extend our spectral library, coupled with geologic context information. Spectral measurements presented here were performed with a portable VIS-NIR spectrometer operating at wavelengths between 0.35 and 2.5 µm in two locations on the island: 1) a persistently active fumarolic field in the area of Kalamos Dome (Fig. 1 a + b) and 2) an abandoned sulfur mine at Paliorema (Fig. 1 c + d), where sulfur was mainly extracted from underground deposits.
Both locations reveal a variety of alteration minerals, in particular sulfates next to native sulfur. Similar to what could be identified on Vulcano, alteration minerals on Milos are dominated by Fe- and Al-bearing sulfates (Fig. 2). However, whereas sulfate minerals such as jarosite (KFe33+[(OH)6(SO4)2]) and alunite (KAl3[(OH)6(SO4)2]) are dominant on Vulcano, different hydrous phases, such as copiapite (Fe2+Fe3+4[(OH)2(SO4)6] x 20H2O) and alunogene (Al2[SO4]3 x 17H2O), are prominent in the area of the Kalamos. This also accounts for hydrated silica, the typical alteration residue. In contrast to Vulcano, where silica occur as amorphous silica gel [4], silica on Milos have a higher water content and crystallinity, mainly identified as chert and chalcedony (Fig. 2). The fossilized hydrothermal system at Paliorema displays more mineralogical diversity. There we have identified jarosite and alunite and also alunogene and copiapite (Fig. 2). Additionally, we see spectral evidence for secondary mineral phases such as melanterite (Fe2+SO4 x 7H2O) and the rare secondary minerals amarantite Fe23+[O(SO4)2] x 7H2O).
The identified minerals are known to occur in the vicinity of fumaroles and are expected to result from the direct interaction between the surface material of the volcanic rocks and fumarolic gases [4]. Secondary minerals form through leaching of the volcanic rock surface, leaving silica behind. Some minerals can also directly precipitate from volcanic gases. The diversity of hydrous minerals compared to what could be observed on Vulcano [2] implies more complex aqueous settings in the formation environments and possible dehydration patterns. The study of altered volcanic deposits on Milos, with its diverse mineralogical assemblages, provides valuable analogs for understanding similar processes on Mars.
Fig. 1: a) Kalamos Dome with b) differently colored hydrothermally altered volcanic deposits and c - d) the sulfur mine in Paliorema. See Fig. 2 for spectra taken at the locations indicated by green letters.
Fig. 2: VIS/NIR spectra acquired in areas of hydrothermal and acid alteration of volcanic deposits on a) the Greek island Milos and b) – d) the Italian island Vulcano [2].
For instance, the detection of sulfates, hydrated silica, and other secondary minerals on Milos mirrors mineralogical findings from Martian regions like Gale Crater and Meridiani Planum [5]. These parallels suggest that fumarolic and hydrothermal systems on Mars may have fostered similar alteration processes, offering clues about the planet's past habitability.
The ongoing work also involves detailed laboratory analyses of Milos samples using VIS-NIR, LIBS, and Raman spectroscopy to expand the mineralogical inventory and to deepen the understanding of hydrothermal alteration processes and their implications for Martian geology and habitability.
References: [1] King P. L. and McSween H. Y. (2005) JGR, 110, E12, doi:10.1029/2005JE002482. [2] Stephan K. et al. (2025) Earth and Space Science, doi: 10.1029/2024EA004036. [3] Fytikas M. et al. (1986) J. Volcanol. Geotherm. Res., 28, 297-317. [4] Rice et al. (2013) Icarus, 223, 499 – 533. [5] Vaniman D. T. et al. (2004) Nature, 431, 663–665.
How to cite: Stephan, K., Xydous, S., Manimanaki, S., Wagner, R., Solomonidou, A., Baque, M., and Rammelkamp, K.: Spectral study of hydrothermally altered volcanic deposits of the Greek island Milos as a Martian analog, EPSC-DPS Joint Meeting 2025, Helsinki, Finland, 7–13 Sep 2025, EPSC-DPS2025-760, https://doi.org/10.5194/epsc-dps2025-760, 2025.
Slopes on Mars can be categorized into a number of classes from Recurring Slope Lineae over dune faces to slope streaks. They all have specific average inclinations within a certain range. But which processes are responsible to set the angle in a given setting on Earth or Mars? There might be more than friction which sets what is known as angle of repose.
Among lifting processes that act on grains on Mars but not on Earth is thermal creep gas flow within the soil. This results in a sub-soil Knudsen compressor if the soil is illuminated, e.g. by sunlight. This support for particles on the surface can induce particle motion and reduce equilibrium slope angles, eventually.
However, the microphysics is very complex. As one approach, we therefore carry out laboratory experiments to gather empirical data. In the study reported here, we focus on the pressure dependence of the Knudsen compressor. To study this, we did form piles of granular samples of JSC Mars 1 with an average grain size of 75 micrometer. We used air at various ambient pressure. The slope angles are initially set by the angle of repose at about 30 degrees. We then illuminated the samples and observed avalanches which result in a lower slope angle. This process takes somewhat longer than 100 s. If the light is turned off, the angles are reduced further for a few seconds. For the sample studied, the reduction in slope angle follows a log-normal distribution in pressure and is strongest at 4.5 mbar during illumination and peaks at 6.7 mbar after the light is turned off (Bila and Wurm, submitted). This places the effect well into the pressure range found on Mars.
How to cite: Bila, T. and Wurm, G.: Martian Slopes in the Laboratory: Pressure Dependence of the Insolation Driven Knudsen Compressor, EPSC-DPS Joint Meeting 2025, Helsinki, Finland, 7–13 Sep 2025, EPSC-DPS2025-569, https://doi.org/10.5194/epsc-dps2025-569, 2025.
There are ongoing discussions if the slopes on Mars are as steep as on Earth or not. With this in mind, we are investigating angles of repose in laboratory experiments. In the particular series of experiments reported here, we study the influence of the low ambient pressure. We started by observing angles of repose for piles of different kinds of grains prepared under normal conditions at 1 bar, representative of Earth. We then built piles of the same material at 3 mbar in the pressure range found on Mars. For some samples we observed a strong change, i.e. a large variation in slope angles and clumping at low pressure. We do not see this change e.g. for metallic particles. As previous work on generating piles under low pressure showed sparking, we speculate that the different behaviour can be attributed to tribocharging. This would make sense due to the reduced amount of water on the sample at low pressure, which makes the grains more insulating and prone to tribocharging. We currently set up charge measurments to verify this hypothesis. Triboelectric effects should influence particle motion on Martian slopes in this case much more than on Earth.
How to cite: Grünebeck, C., Bila, T., Burkhart, N., Teiser, J., and Wurm, G.: Does Tribocharging Influence the Motion of Particles on Martian Slopes?, EPSC-DPS Joint Meeting 2025, Helsinki, Finland, 7–13 Sep 2025, EPSC-DPS2025-563, https://doi.org/10.5194/epsc-dps2025-563, 2025.
The information about the geological history of Mars is contained and codified into the minerals forming the Martian rocks and derived meteorites. Therefore, to understand the physical and chemical processes which occurred on Mars it is necessary to study the mineralogy of its rocks. In this work, we present the results of an in-depth μ-Raman imaging of the Martian shergottite NWA13367. The meteorite was recently discovered and so far, only a preliminary and partial characterization is available [Gattacceca et al. 2021]. We worked on an unpolished 1 mm-thick slab with an exposed area of a few square centimeters. On the sample’s surface, we defined several regions of interest (ROIs). We used Raman spectroscopy to identify the mineral phases and map their distribution in the selected ROIs. The identified phases can be subdivided into: 1) primary minerals, 2) shock-induced phases and 3) secondary minerals. Primary minerals are the most abundant phases in the meteorite where we identified olivine, clinopyroxene, and orthopyroxene. Other primary minerals present in much smaller quantities are chromite and merrillite. The only observed shock-induced phase is maskelynite while calcite represents the secondary minerals. The textural relationships and the distribution of the minerals revealed by our spectral imaging allow us to identify the main processes underwent by the meteorite. The carbonate identified in the sample is present as veins and plagues often found at the boundaries between grains and fractures (Fig. 1) which is consistent with a secondary, terrestrial, origin.
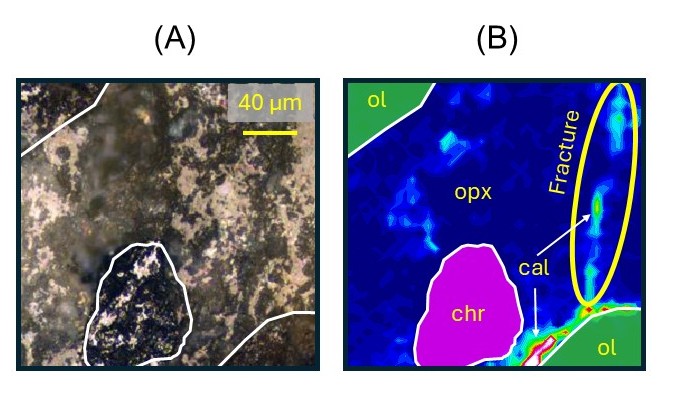
Fig. 1 Main phases and their distribution in Martian shergottite NWA 13367. (A) optical image of one of the selected regions of interest (ROI) of the meteorite. White lines mark the boundaries between different phases. (B) mineral distribution in the same ROI as in panel (A): olivine (ol), orthopyroxene (opx), chromite (chr) and calcite (cal).
The silicate primary phases are characterized by large crystals with a cumulate texture. Maskelynite usually has an irregular distribution while merrillite is rather found as tiny crystals (~ 10μm). Our work will provide new data to support the petrological interpretation of this newly discovered meteorite. In addition, given the current and future presence of Raman spectrometers on Mars (i.e. SHERLOC/Perseverance Rover, RLS/Rosalind Franklin Rover) the sample will be used to test new analytical protocols that could be used to improve the collection of in-situ spectra on the planet.
Fundings: ASI-INAF n. 2023.HH.0 “Attività scientifica di preparazione all’esplorazione marziana”
References:
Gattacceca, J., McCubbin, F. M., Grossman, J., Bouvier, A., Bullock, E., Chennaoui Aoudjehane, H., ... & Schrader, D. L. (2021). The meteoritical bulletin, No. 109. Meteoritics & Planetary Science, 56(8), 1626-1630. https://doi.org/10.1111/maps.13714
How to cite: Bruschini, E., Ferrari, M., Altieri, F., De Angelis, S., Brossier, J., and De Sanctis, C.: Micro-Raman imaging of Martian Shergottite NWA13367, EPSC-DPS Joint Meeting 2025, Helsinki, Finland, 7–13 Sep 2025, EPSC-DPS2025-492, https://doi.org/10.5194/epsc-dps2025-492, 2025.
The ancient terrains of Mars, dating from the Noachian and early Hesperian epochs, display a variety of geomorphological and mineralogical features that point to a past climate that was episodically favorable to liquid water (Figure 1a). These features — including valley networks [1], open- and closed-basin lakes [2], alluvial fans [3], shorelines [4], and alteration minerals such as phyllosilicates and sulfates [5] — suggest the existence of a hydrological cycle involving precipitation, runoff, and groundwater flow. Reconstructing the water distribution and hydrological dynamics of early Mars is essential to constrain past climate scenarios. We have developed a global hydrological model [6] for early Mars to simulate the distribution and dynamics of surface water under warm and wet conditions by exploring different Global Equivalent Layer (GEL) values and evaporation/precipitation schemes as functions of elevation or latitude. Here, we present the model applications and latest developments, including: (1) the comparison of model results from conceptual climate scenarios with observed valley networks, deltas, and lakes; (2) the investigation of transient effects and the formation of valleys from catastrophic outflow events; and (3) the coupling with a groundwater flow model to account for aquifer recharge and groundwater seepage.
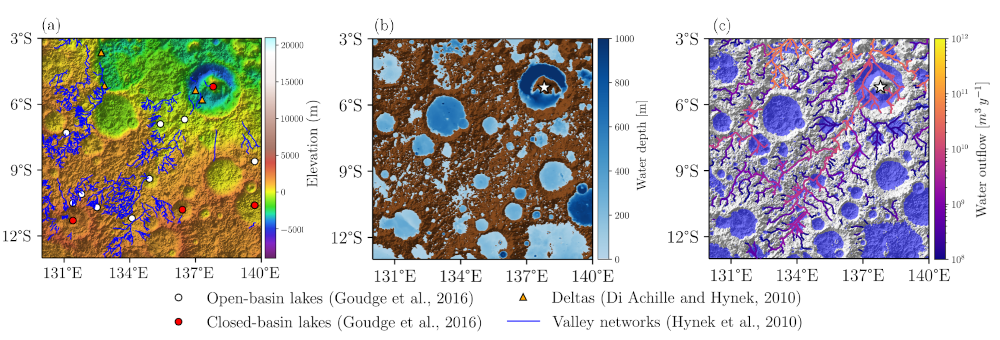
Figure 1. Observed data (a) and model outputs at steady state with a GEL of 100 m (b–c) focused on the Gale Crater watershed (white star). These results are from a global-scale model [6]. (a) Digital Elevation Model from the Mars Orbiter Laser Altimeter (MOLA) [7]. Blue lines represent valley networks [1]. White and red dots indicate open- and closed-basin lakes, respectively [2]. Orange triangles denote deltas [3]. (b) Distribution of surface water reservoirs (blue areas); the color bar shows water depth. (c) Streamflow along the simulated valley network; transparent sky blue areas indicate lake surfaces.
The surface hydrological model [6] simulates the steady-state distribution of water across the Martian surface by iteratively filling depressions and transferring excess water downstream. Water mass is conserved globally, and evaporated water is redistributed planet-wide as a conceptual form of precipitation, simulating a closed water cycle. Model outputs include the extent of surface water reservoirs (Figure 1b) and the overflow rates of depressions that exceed their storage capacity (Figure 1c). To assess model simulations, we compare simulated results with geomorphological data: the locations of lakes, valley networks, and deltas (Figure 1a). We developed quantitative indicators to evaluate the agreement between model outputs and observations, enabling the testing of different climate scenarios and GEL for their consistency with the preserved surface features. To further investigate landscape evolution, an erosion process was implemented to simulate catastrophic outflow events that may form large meander valleys. This addition allows us to study transient responses and long-term geomorphological impacts of such events.
While the surface model captures overland flow and lake formation, it does not account for water infiltration, subsurface storage, or groundwater discharge. To address this, we coupled a groundwater model [8] with the surface model. The coupled system evolves iteratively toward a steady-state distribution under constant climate forcing. We assess the effect of including groundwater processes on simulated surface water by comparing model results to observed geomorphological features. We also apply the coupled model to selected large watersheds derived from valley network catchments to estimate aquifer recharge rates required to sustain valley streamflows. Incorporating groundwater dynamics significantly improves the simulation of subsurface–surface water interactions and the representation of long-term water balance.
This work introduces an efficient framework for simulating early Mars hydrology at the planetary scale. By coupling surface and subsurface processes and comparing model outputs with geomorphological data, we provide new insights into the spatial and temporal distribution of water on early Mars and its implications for paleoclimate. Future work will focus on asynchronous coupling with a 3D Global Climate Model (GCM), enabling precipitation and temperature fields to evolve dynamically with the hydrological model. We also plan to explore transient simulations that account for episodic warming events and variable recharge scenarios.
References:
[1] Hynek et al.: Updated Global Map of Martian Valley Networks and Implications for Climate and Hydrologic Processes, https://doi.org/10.1029/2009JE003548, 2010.
[2] Goudge et al.: Insights into Surface Runoff on Early Mars from Paleolake Basin Morphology and Stratigraphy, https://doi.org/10.1130/G37734.1, 2016.
[3] Di Achille and Hynek: Ancient Ocean on Mars Supported by Global Distribution of Deltas and Valleys, https://doi.org/10.1038/ngeo891, 2010.
[4] Sholes et al.: Where are Mars’ Hypothesized Ocean Shorelines? Large Lateral and Topographic Offsets Between Different Versions of Paleoshoreline Maps, Journal of Geophysical Research: Planets, https://doi.org/10.1029/2020JE006486, 2021.
[5] Carter et al.: Widespread surface weathering on early Mars: A case for a warmer and635wetter climate, Icarus, https://doi.org/10.1016/j.icarus.2014.11.011, 2015.
[6] Gauvain et al: A Global High-Resolution Hydrological Model to Study the Dynamics of Surface Liquid Water Reservoirs on Early Mars, Geoscientific Model Development, EGU, submited.
[7] Smith et al.: Mars Orbiter Laser Altimeter:Experiment summary after the first year of global mapping of Mars, Journal of Geophysical Research: Planets, https://doi.org/10.1029/2000JE001364, 2001.
[8] Langevin et al.: Documentation for the MODFLOW 6 Groundwater Flow Model: U.S. Geological Survey Techniques and Methods, https://doi.org/10.3133/tm6A55, 2017.
How to cite: Gauvain, A., Forget, F., Turbet, M., and Clément, J.-B.: Constraining Early Mars Climate Through Coupled Hydrological Modeling and Comparison with Geomorphological Evidence, EPSC-DPS Joint Meeting 2025, Helsinki, Finland, 7–13 Sep 2025, EPSC-DPS2025-1263, https://doi.org/10.5194/epsc-dps2025-1263, 2025.
Introduction.
Currently, on Earth, we still have large areas that are uninhabited (e.g. Antarctica). The need to terraform Mars could result from various processes, e.g. eruptions of supervolcanoes, extremely strong greenhouse effects, a planetoid impacts, etc.
Atmosphere of Mars.
Atmospheric pressure on the surface of Mars ranges from 72 Pa at Olympus Mons to 1.16 kPa at the lowest lowland [1]. Water at a pressure below 6.25 kPa boils at human body temperature. This pressure determines the Armstrong limit. For p50 = 10 kPa the water boils at ~50oC - Fig. 1.
Fig. 1. Phase diagrams of H2O and CO2. This figure is licensed under the Creative Commons Attribution-Share Alike 3.0 Unsorted license.. Author. Cmglee Wikipedia.
The pressure is approximately proportional to the mass of atmosphere and the gravity. We consider a few terraforming variants v1,...v6, where descriptions are in parentheses (), and M is the required massof volatiles, h=0 corresponds to the reference level [1, 2, 3].
v1 (Armstrong limit at Hellas ), M=1.09E+17 kg.
v2 (Pressure p50 =10 kPa at Hellas), M=1.9E+17 kg
v3 (Armstrong limit at h=0 ), M= 2.31+17kg
v4 (Pressure p50 =10 kPa at h=0 ) M= 3.8E+17 kg,
v5 (Pressure 101.3 kPa at Hellas ), M= 2.1E+18 kg,
v6 (Pressure 101.3 kPa at h=0 ), M=4.12E+18 kg - the most ambitious version.
In the present work we consider only the possibility of building an atmosphere from material supplied from outside Mars. Another possibility is to use the interior of Mars.
 mainly
Fig. 2. Hellas Planitia, Mars' lowest lowland (~7000 m below reference level). Author: NASA / JPL-Caltech / Arizona State University - JMARS, public domain, https://commons.wikimedia.org/w/index.php?curid=29961709
The choice of bodies
Oort Cloud (OC) and Kuiper Belt (KB) are made of volatiles [2, 4]. The time of falling from KB is ~29-63 yr, and from OC is over 15,000yr [2 ] - Table 1. So, KB is better choice. .
Gravity assist and engines
Our idea is to build a thermonuclear reactor on the transported body. This reactor would use hydrogen (from water ice, which the body is made of) to produce electricity used for a ion engine. It will lead to some change of orbit that initiates gravity assist. The required energy is 1-8 times present energy produced annually on Earth. Fortunately, there are a lot of bodies of considerable size in KB and on the way to Mars, the gravitaty assist of large planets can be used.
Table 1
|
1 |
2 |
3 |
4 |
5 |
6 |
|
Kuiper B. inner |
2.90E+01 |
5.43 |
33.23 |
9.13 |
0.000554 |
|
Oort C. inner |
1.58E+04 |
0.67 |
34.10 |
10.00 |
0.000068 |
(1) Source of the matter; (2) Time of falling [yr] from (1) to Mars' orbit. (3) orbital velocity vorb [km/s]. (4) final velocity of falling vfall on Mars' orbit [km/s]. (5) v=vfall – vorbMars [km/s]. (6) mass of propellant used to reducing vorb to 0.99 vorb, for ionic FEEP.
Tidal effects and stability of bodies
To calculate effects of gravity assist we used formulas developed in [5]. They describe a minor body consisted of 2 parts m1 and m2 moving close to a large body. Motion of the part m1 of the minor body is descibed by:
m1 d/dt2 r'1 = F'1 + F'c + F'g + P' - m1 d/dt2 rs ,
where r'1=(x'1,y'1) is radius vector of the part 1 of the minor body in relation to non-inertial primed frame of reference, F'1is gravity force acting (from the large body) on part 1 of the minor body, F'c is the centrifugal forces and F'g is the gravitational attraction of part 1 by part 2. Component P'x and P'y are friction and reaction forces, respectively. The rsis the position of the center of the satellite in an inertial system. Our calculation indicates substantial problems. The effect of a gravity assist often depends on the cohasive forces of the KB bodies. Low cohesion leads to disruption. Moreover, KB bodies can be unstable close to the Sun. In such situation volatile substances escape, creating a natural rocket engine with thrust that is difficult to control. The disruption and the natural engine can lead to the body being directed in the wrong direction, e.g. towards a collision with the Earth.
Problem of impacts
The gravity assist can be used to reduce the relative velocity of impact. It is important because heating of the atmosphere will lead to the escape of gases.
Conclusions. Terraforming of Mars is possible by importing matter from other celestial bodies. The main problem is the control of the gravity assist. Note that after the construction of thermonuclear power plants and the determination of the gravity assist series, the transport process would not require additional energy. About 100 bodies with a radius of 12 km would be enough.
Acknowledgments: The research was partially performed as part of the statutory activities of CBK PAN.
References [1] Mars Fact Sheet". NASA Retrieved 2 December 2024. [2] Czechowski L. „Horizont Mars”. Conference Wroclaw, Poland, October, 24, 2024; [3] Czechowski L., LPSC2025, 1858pdf [4] Hargitai, H. and Kereszturi, A., 2015, Encyclopedia of Planetary Landforms,. ISBN 978-1-4614-3133-6. [5] Czechowski L. 1991, Earth, Moon and planets, 52, 113.
How to cite: Czechowski, L.: Terraforming of Mars and some problems of gravity assist, EPSC-DPS Joint Meeting 2025, Helsinki, Finland, 7–13 Sep 2025, EPSC-DPS2025-1345, https://doi.org/10.5194/epsc-dps2025-1345, 2025.
Introduction : Knowing the surface albedo of a celestial body is crucial not only for understanding its composition, but also as a key input for radiative transfer models and retrieval algorithms used to derive atmospheric parameters such as aerosol optical depth. Within the MIRS (MMX InfraRed Spectrometer, 0.9–3.6 µm) team, we are specifically investigating the use of surface albedo maps to support upcoming observations of the Martian atmosphere by this near-infrared imaging spectrometer [1]. MIRS is one of the scientific instruments aboard the JAXA Martian Moons eXploration (MMX) mission [2], scheduled for launch in 2026. While the primary goal of MMX is to explore the Martian moons Phobos and Deimos and return samples to Earth by 2031, the mission also includes a significant atmospheric science component. MIRS will contribute to this by performing high-temporal resolution observations of dust storms, ice clouds, and water vapor, thereby improving our understanding of dust and water transport processes in the Martian atmosphere [1]. In preparation for the mission, it is essential to simulate MIRS observations. We are developing a Martian aerosol retrieval algorithms by building a look-up table of Mars atmosphere spectra simulated using a radiative transfer code with different parameters from which we will be able to compare MIRS observations and deducing aerosol properties such as optical depths (see details in [3]). Building this spectra database requires a global albedo map of the Martian surface in the MIRS spectral range (0.9–3.6 µm). One available dataset is the albedo map at 1.08 µm from the OMEGA (Observatoire pour la Minéralogie, l’Eau, les Glaces et l’Activité) instrument onboard the Mars Express spacecraft [4], but it contains some gaps in the data coverage (figure 1.b). The goal of this work is to develop a method to fill these gaps to generate a complete map.
Method : This method processes and merges the OMEGA albedo map (figure 1.b) (in near-IR at 1.08 µm) with data from another instrument: MARCI (Mars Color Imager) onboard the Mars Climate Orbiter [5]. Since OMEGA and MARCI have different spatial resolutions, the first step was to ensure that the two datasets could be combined effectively. First, we co-register the MARCI map (figure 1.a) onto the OMEGA grid, since they originally operate on different coordinate systems using 2D linear interpolation. Then we compute the pixel-by-pixel differences between the interpolated MARCI map and the OMEGA map, considering only valid/filled OMEGA pixels which will be used to convert MARCI UV-visible albedo values to OMEGA near-IR albedo values. To address the missing/dark pixels in the OMEGA map (Figure 1b), the script locates the nearest valid pixel for each dark pixel using the Euclidean distance [6]. It then retrieves the corresponding albedo difference from the earlier step based on the closest valid pixel. This local correction is then applied to the MARCI value at the same location, effectively estimating a new albedo value for the previously dark OMEGA pixel, resulting in a corrected OMEGA albedo map without missing data (figure 1.c). After this step, some artifacts, seen as abnormally bright pixels, remain. After filling in the dark pixels, a new difference map is calculated to compare the updated OMEGA and MARCI maps. Then, the focus shifts to correcting these abnormally bright pixels within the latitude range of 60°S to 60°N, which will be of interest for MMX observations. The map is divided into 20x20 pixels blocks, and in any block with abnormally bright pixels, those pixels are replaced using the same method described above for the dark pixels. The application of a Gaussian smoothing [6] in the final step helps to smooth the remaining artifacts by reducing abrupt changes and making the map more physically plausible (figure 1.d).
Discussion : This process allows us to produce a complete and reliable albedo map (figure 1.d), especially in high contrast albedo regions. The use of local corrections ensures that regional characteristics are preserved, and the step-wise correction of both dark and bright artifacts enhances the scientific quality of the dataset. However, it’s important to acknowledge that this method involves some assumptions, especially where no OMEGA data existed, and while the corrected values are likely reasonable, they do not come from direct measurements.
Figure 1. a) The MARCI albedo map in UV/Visible. b) The OMEGA albedo map at 1.08 µm. c) The OMEGA albedo map after filling all the dark pixels with the MARCI map. d) The final OMEGA albedo map after correcting both dark pixels and white pixels (artifacts), and smoothed with a Gaussian filter.
Conclusion : In summary, this method completes and corrects the OMEGA near-IR albedo map using MARCI UV-visible albedo map, to generate a reference OMEGA surface albedo map of Mars at 1.08 µm. The final output is a high-coverage albedo dataset, which will be useful for accurate atmospheric simulations and spectral matching during the MMX mission. This dataset may further benefit diverse planetary science studies, such as investigations of Martian surface composition. It could also support future mission planning by providing improved surface characterization in regions of interest.
Acknowledgments :
We thank M. Wolff who provided us the MARCI albedo map which came from a personal communication with S. W. Lee. We thank the MMX JAXA teams for their efforts and CNES for the financial support and collaboration to build the MIRS instrument.
References :
[1] Barucci M. A. et al. (2021) Earth, Plan. and Space, 73, 211.
[2] Kuramoto K. et al. (2022) Earth, Plan. and Space, 74, 12.
[3] Leseigneur Y. et al. (2025) EPSC-DPS2025, abstract
[4] Ody A. et al. (2012) Journal of Geophysical Research, Vol. 117.
[5] Genda H. et al. (2024) Earth, Plan. and Space, 76, 8.
[6] Virtanen P. et al. (2020) Nat. Methods, 17, 261–272.
How to cite: Le Bail, G., Lasue, J., Stcherbinine, A., Leseigneur, Y., Bertrand, T., and Gautier, T.: A new reference surface albedo map of Mars : An improved OMEGA/Mars Express albedo map at 1.08 µm, EPSC-DPS Joint Meeting 2025, Helsinki, Finland, 7–13 Sep 2025, EPSC-DPS2025-1459, https://doi.org/10.5194/epsc-dps2025-1459, 2025.
Introduction:
The High-Resolution Stereo Camera (HRSC) onboard the Mars Express has been capturing multispectral images of Mars since 2004 [1]. In addition to its nadir and stereo-imaging capabilities, HRSC also acquires medium-resolution (~25–100 m/pixel) multispectral data in four colour channels—Blue (444.0 nm), Green (538.0 nm), Red (748.0 nm), and Near-Infrared (955.5 nm)—though not consistently across all observations. Products and mosaics derived from these channels have been widely utilized for surface characterization, particularly in geological mapping, geomorphological analysis, and investigations of seasonal, polar, and atmospheric processes (e.g., [2-4]). Despite its extensive use for morphologic and contextual analysis, HRSC multispectral data have been underutilized for mineralogical discrimination. This is largely due to the availability of more spectrally resolved hyperspectral datasets from OMEGA (also aboard Mars Express) [5] and CRISM on the Mars Reconnaissance Orbiter [6]. However, with CRISM now non-operational and OMEGA currently limited to the VNIR, there is renewed relevance in evaluating the spectral utility of HRSC.
This study investigates the spectral sensitivity of HRSC’s colour channels with a goal to determine the theoretical detectability and separability of various mineral types using HRSC, thereby enhancing its value as a bridging dataset between lower-resolution hyperspectral (i.e., OMEGA) and high-resolution instruments like HiRISE [7] and CaSSIS [8].
Methods:
For this analysis, we utilize the comprehensive database of CRISM-based Martian mineral detections [9]. Corresponding laboratory reference spectra for these minerals/mineral-groups were sourced from the USGS Spectral Library [10] and the RELAB spectral database [11]. The latest spectral response functions for HRSC were adopted from [1], and all laboratory spectra were resampled to match the four HRSC spectral bands. Each mineral-group was then examined individually to characterize its spectral behavior within the HRSC wavelength range. Based on these resampled spectra, we derive potential diagnostic band ratios/spectral parameters tailored to HRSC bands, based on similar sensitivity studies performed for CaSSIS [12-13] and HiRISE [14-15].
Results:
Figure 1 presents a series of plots illustrating laboratory reference spectra for all mineral groups identified on the Martian surface [9], resampled to HRSC wavelengths.

Mafic Minerals: Mafic minerals, including Fe-olivine, Mg-olivine, and low-Ca pyroxene-bearing materials, exhibit a sharp downward deflection towards the near-infrared (NIR), driven by an absorption feature near 1000 nm, attributed to Fe²⁺ crystal field transitions. Olivine, in particular, shows a broader absorption, leading to a noticeable decrease in reflectance starting from the green channel and continuing through the red and NIR channels (Fig. 1a). In contrast, low-Ca pyroxene (LCP) demonstrates a more confined drop-off, limited to the red and NIR channels, though its spectral behavior remains distinctive (Fig. 1c).
Hematite: Hematite reveals a unique spectral signature in the HRSC wavelength range (Fig. 1f), primarily due to its diagnostic absorption feature ~860 nm. Although HRSC cannot fully resolve this absorption like CaSSIS can [13,16], the combination of green, red, and NIR channels captures the leading limb of the absorption, suggesting that hematite could potentially be identified using HRSC.
Ices: Water-ice exhibits a characteristic spectral shape in the VNIR range, with a high reflectance in Blue followed by a gradual decrease towards the NIR, partially due to weak OH absorption near 1000 nm. CO₂ ice, however, remains spectrally featureless in the HRSC wavelength range (Fig. 1k). [14] note that this behaviour for water- and CO₂ ice is typically observed only in coarse-grained or pure ice. Hence, if the ice is sufficiently pure, HRSC should be able to distinguish between the two ices.
Halides: Chlorides are generally featureless in the VNIR range. However, the unique combination of them being relatively brighter (generally higher blue value than most other minerals, except perhaps for ices) and among the only few minerals with a significantly positive RED-IR slope may allow for their separation (Fig. 1g; [16]). Other minerals that show a positive RED-IR slope include hydrated silica (Fig. 1j), epidote (Fig. 1b), Fe/Ca carbonates (Fig. 1i), kaolinite (Fig. 1d) and alunite (Fig. 1h).
Other Minerals: A range of other minerals, including most phyllosilicates (Fig. 1d), sulfates (Fig. 1h), and tectosilicates (Fig. 1e), exhibit similar spectral behaviors at HRSC wavelengths, with subtle variations in their red-to-infrared slopes. While a definitive four-point spectral detection for these minerals may be challenging at the HRSC resolution, some of these minerals may be partially separable using specific colour-band-ratio-composites.
Table 1 presents a series of non-exhaustive spectral band ratios/parameters and their rationale. This list continues to be tested and updated.

Conclusions and Future Work:
Preliminary results from the study of laboratory-based spectra show that HRSC colour may be able to confidently separate between most mafic vs ferric-bearing mineral phases, as well as ices. More particularly, the unique position of the four HRSC wavelengths should theoretically allow for identification of hematite-bearing minerals on the surface. [1] and [17] report of radiometric discrepancies (sometimes upto 10%) in the HRSC red and NIR channels, relative to OMEGA. Work is currently underway to better understand and constrain absolute calibration uncertainties of the instrument, following which, a detailed investigation into the true sensitivity of the colour filters for mineral differentiation based on HRSC images of the type locality sites is planned.
References:
[1] Jaumann et al. (2007), PSS 55, 928-952. https://doi.org/10.1016/j.pss.2006.12.003
[2] Jaumann et al. (2014), LPSC 45, 1772. https://www.hou.usra.edu/meetings/lpsc2014/pdf/1772.pdf
[3] Tirsch et al. (2016), LPSC 47, 1849. https://www.hou.usra.edu/meetings/lpsc2016/pdf/1849.pdf
[4] Michael et al. (2025), Icarus 425, 116350. https://doi.org/10.1016/j.icarus.2024.116350
[5] Bibring et al. (2004), ESA SP-1240, 37-49. https://adsabs.harvard.edu/pdf/2004ESASP1240...37B
[6] Murchie et al. (2007), JGR 112, E05S03. https://doi.org/10.1029/2006JE002682
[7] McEwen et al. (2007), JGR 112, E05S02. https://doi.org/10.1029/2005JE002605
[8] Thomas et al. (2017), SSR 212, 1897-1944. https://doi:10.1007/s11214-017-0421-1
[9] Viviano et al. (2014), JGR 119, 1403-1431. https://doi.org/10.1002/2014JE004627
[10] Kokaly et al. (2017), USGS v7, https://doi.org/10.3133/ds1035
[11] Milliken et al. (2016), LPSC 47, 2058. https://www.hou.usra.edu/meetings/lpsc2016/pdf/2058.pdf
[12] Tornabene et al. (2018), SSR 214, 1-61. https://doi.org/10.1007/s11214-017-0436-7
[13] Tornabene et al. (2024), EPSC 17, 1321. https://doi.org/10.5194/epsc2024-1321
[14] Rangarajan et al. (2024a), Icarus 419, 115849. https://doi.org/10.1016/j.icarus.2023.115849
[15] Rangarajan et al. (2025), EGU25, 18947. https://doi.org/10.5194/egusphere-egu25-18947
[16] Rangarajan et al. (2024b), EPSC 17, 687. https://doi.org/10.5194/epsc2024-687
[17] Combe and McCord (2009), ASR 43, 128-137. https://doi.org/10.1016/j.asr.2008.05.008
[18] Hapke (2012), Cambridge University Press, 1-513. https://doi.org/10.1017/CBO9781139025683
How to cite: Rangarajan, V. G., Hauber, E., Adeli, S., Tirsch, D., and Matz, K.-D.: Assessing the Sensitivity of the High Resolution Stereo Camera (HRSC) Colour Channels onboard Mars Express for Surface Material Discrimination, EPSC-DPS Joint Meeting 2025, Helsinki, Finland, 7–13 Sep 2025, EPSC-DPS2025-390, https://doi.org/10.5194/epsc-dps2025-390, 2025.
Introduction
The Colour and Stereo Surface Imaging System (CaSSIS) is an advanced stereo camera developed for the ExoMars Trace Gas Orbiter mission, which has been orbiting Mars since April 2018. The CaSSIS camera can produce detailed 3D maps and capture images in four distinct color bands, providing essential data for analyzing the Martian surface and its composition [1].
An innovative telescope rotation system creates a convergence angle of approximately 22° between the images of the stereo pairs, making CaSSIS's stereo configuration possible. Operating from a circular orbit approximately 400 km above the Martian surface, CaSSIS's average ground resolution is 4.5 m per pixel, resulting in digital terrain models (DTMs) with a resolution of about 13.5 m per pixel [2].
CaSSIS has captured over 50,000 images, covering more than 8% of Mars' surface, including over 2,250 stereo-pairs. The planning of CaSSIS observations, which is guided by requests from the scientific community and the team, has focused on acquiring multiple images in areas of particular scientific interest. This has recently allowed for the acquisition of partially overlapping stereo pairs, enabling a more in-depth and comprehensive analysis of these regions.
The work outlines the new methods for creating CaSSIS mosaics of DTMs and orthophoto and their application in various areas of Mars.
Methods
The 3DPD software, developed by the INAF OAPd team [2,3], serves as the foundation for generating Digital Terrain Models (DTMs) and orthorectified images. It is also the official tool for creating CaSSIS DTMs. Since the establishment of the framework, the software has been continuously updated to enhance the performance and quality of stereo data product generation. As a result, over 450 DTMs and orthoimages have been produced and are available in the OAPD-hosted repository (https://cassis.oapd.inaf.it/archive/) and soon in the ASI Space Science Data Center repository (SSDC).
The developed pipeline enables the generation of stereo products from radiometrically calibrated CaSSIS frames by following several processing steps. Recent pre-processing improvements include a Bundle Block Adjustment phase and geometric corrections necessary for mosaicking the framelets, which help resolve misalignments that could otherwise lead to step artifacts and projection errors. The stereogrammetric processing of 3DPD, detailed by [3], is based on a two-step approach: a preliminary rough, feature-based step followed by an advanced multiscale refinement (dense-matching) step. According to [2], this process achieves a vertical accuracy of up to 8 meters, while the best horizontal accuracy is estimated at up to 13.5 meters per pixel, corresponding to CaSSIS DTM GSD (Ground Sample Distance) (3 pixel on ground). The resulting point cloud (PC), which has a heterogeneous density due to perspective viewing, is then interpolated onto a regular grid of height values within a reference coordinate system. To enhance geographical projection and absolute elevation, the point cloud is co-registered with the global MOLA-HRSC DTM [4]. This improves the accuracy to a standard deviation generally below 50 meters when compared to MOLA, effectively correcting any residual tilting. The point cloud is then interpolated, and the two original panchromatic images are orthorectified. The co-registration with MOLA simplifies the mosaicking of adjacent DTMs, as their georeferencing often requires minimal or no mutual corrections. These can typically be addressed through simple horizontal and vertical rigid translations. The seamless mosaicking process is based on the "feathering" approach, in which the overlapping areas are averaged using a weighted average that considers the inverse of the distance from the image edges and, in this implementation, from null pixels.
Region of interests
The number of areas potentially interested by multiple contiguous stereo pairs of CaSSIS is constantly being updated. Six areas have been selected for the initial assessment of the potential of CaSSIS DTM mosaics. Two of these are of particular interest for landing site studies: the north-western area of the Jezero crater (Fig. X), the location of NASA Mars 2020 surface mission [5], and Oxia Planum in Arabia Terra, chosen as the landing site for the second ESA ExoMars mission [6], currently postponed to 2028. The areas are currently interested by 14 and 13 contiguous DTMs, respectively.
The other mosaic areas include various geological contexts in different regions of Mars: southern Isidis Planitia, well-preserved craters in Utopia and Daedalia Planitiae, and peri-glacial features in the Northern Plains.
In addition to being applied in targeted geological studies, the preliminary mosaics will be evaluated globally using lower-resolution data (HRSC and MOLA) and locally using high-resolution HiRISE DTMs to verify vertical accuracy and georeferencing precision.
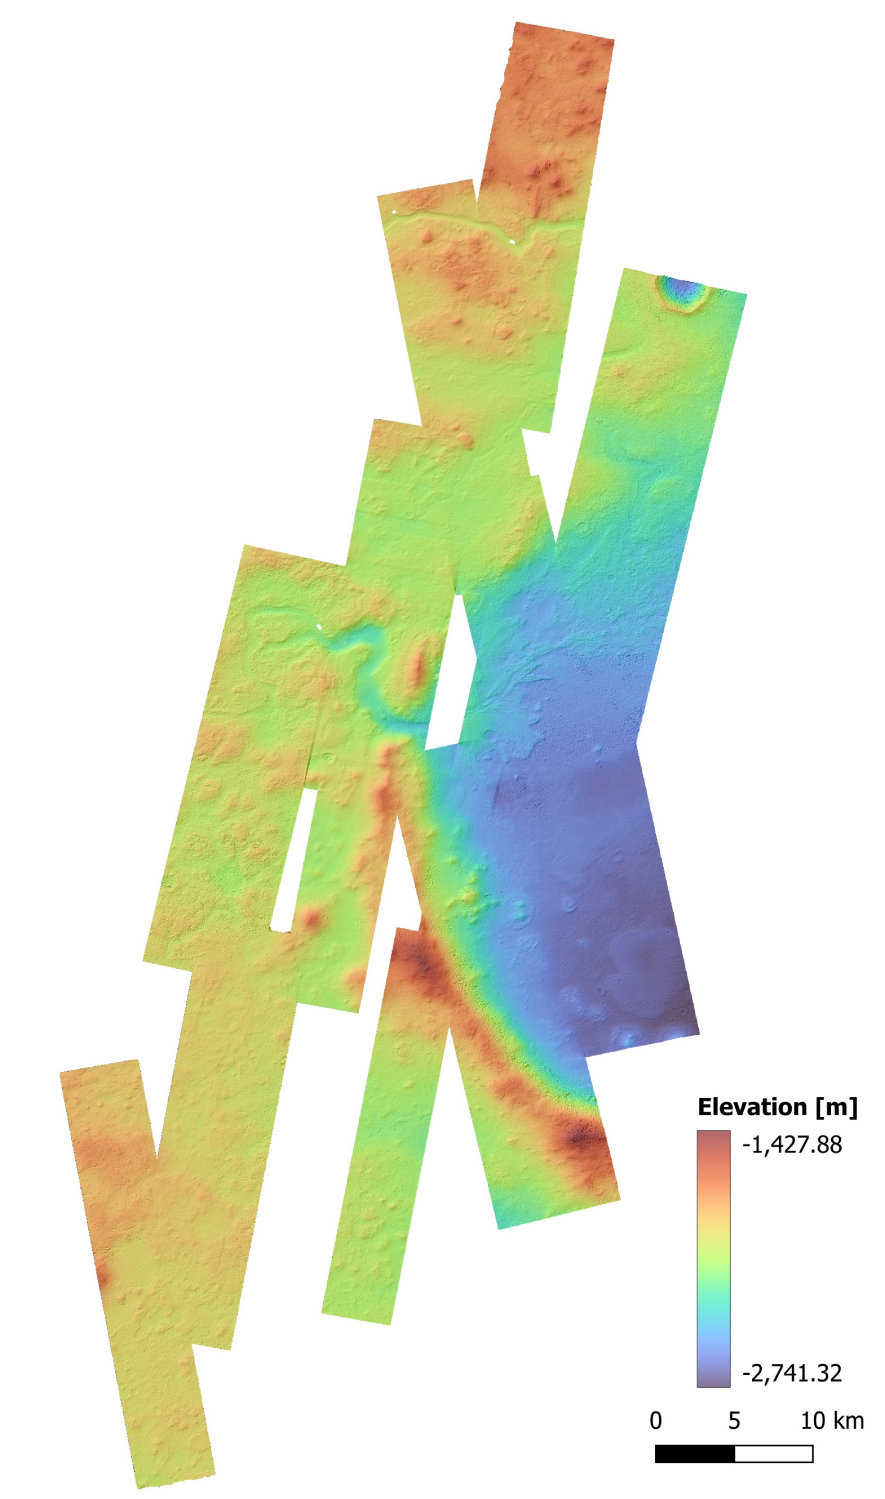
Fig, 1 Mosaic of CaSSIS DTMs at 13.5 m/px of the northwestern part of Jezero Crater. The data is derived from the composition of 14 different DTMs. The display shows the elevation in transparency on a hillshade map.
Acknowledgement
This work has been developed under the ASI-INAF agreement n. 2024-40-HH.0
References
[1] Thomas, N. et al., 2017. Space Sci. Rev., 212, 1897–1944. https://doi.org/10.1007/s11214-017-0421-1
[2] Re, C. et al., 2022. Planet. Space Sci., 219, 105515. https://doi.org/10.1016/j.pss.2022.105515
[3] Simioni, E. et al., 2021. Planet. Space Sci., 198, 105165. https://doi.org/10.1016/j.pss.2021.105165
[4] Fergason, R.L. et al., 2018. USGS Astrogeology PDS Annex.
[5] Williford, K.H. et al., 2018. In: Grotzinger, J.-P. & Webster, C.R. (Eds.), From Habitability to Life on Mars, Elsevier, pp. 275–308.
[6] Quantin-Nataf, C. et al., 2021. Astrobiology, 21(3), 345–366. https://doi.org/10.1089/ast.2020.2244
How to cite: Tullo, A., Re, C., Bertoli, S., Simioni, E., La Grassa, R., Cremonese, G., and Thomas, N.: Controlled DTM and orthoimages mosaics from ExoMars TGO CaSSIS stereo-pairs, EPSC-DPS Joint Meeting 2025, Helsinki, Finland, 7–13 Sep 2025, EPSC-DPS2025-1469, https://doi.org/10.5194/epsc-dps2025-1469, 2025.
Geological modelling refers to developing models of geologic units and structures in the underground, starting from information from geological maps, geophysical surveys, or borehole logs. On Earth, geologic information from the subsurface, such as borehole observation data and geophysical surveys, is the key element for the development of models of the underground at various scales for the purpose of scientific investigation, urban planning, water resources, geothermal, and mineral resources.
Besides Apollo missions, which included drilling and geophysical prospecting, planetary exploration in the last 50 years has mainly returned data from the surfaces. However, over the past 20 years, a new wave of orbital and rover-mounted planetary subsurface radar sounders has unveiled the subsurface of the first hundreds of meters at various vertical resolutions. On Mars, the shallow subsurface of the first few meters represents the primary target for both biosignatures and access to ice/water resources, and drilling is the most practical way to access this underground world. Within the payload of the latest generation of missions to the Moon, we found radar sounders and drills to explore the shallow underground.
Geologic models of extra-terrestrial undergrounds have started to be developed in the last decade. Yuan et al. (2017) developed a model to explain the dynamics of the emplacement of a sequence of lava flows on the Moon starting from the radar sounder data. Another geologic model has been developed from the combination of the geologic context and the analysis of the seismometer data from InSight mission on Mars. Katayama and Akamatsu (2024) interpreted a seismic discontinuity as being generated from the volume of rock cracks filled by liquid water at a depth of a few tens of meters.
These examples prove how we can apply the geologic modeling techniques we use on Earth also to other worlds, where resource mapping is becoming of primary importance for future robotic and human exploration. We have to adapt to different balances between the quantity and quality of surface and subsurface data, and concentrate on the specific scale imposed by the information returned by a particular mission or series of missions. The interoperability of data, reference systems, and open formats represents a critical point for developing models that are not only accessible to other scientists but also to engineers and personnel involved in mission operations.
Acknowledgements: This study is supported by the Space It Up project funded by the Italian Space Agency, ASI, and the Ministry of University and Research, MUR, under contract n. 2024-5-E.0 - CUP n. I53D24000060005.
Bibliographic References: Ikuo Katayama, Yuya Akamatsu, 2024. Seismic discontinuity in the Martian crust possibly caused by water-filled cracks. Geology 52 (12), 939–942; Yuan, Y., Zhu, P., Zhao, N., Xiao, L., Garnero, E., Xiao, Z., Zhao, J., Qiao, L., 2017. The 3‐D geological model around Chang’E‐3 landing site based on lunar penetrating radar Channel 1 data. Geophysical Research Letters 44, 6553–6561.
How to cite: Frigeri, A.: Geologic Modeling for Resource Mapping in Planetary Exploration, EPSC-DPS Joint Meeting 2025, Helsinki, Finland, 7–13 Sep 2025, EPSC-DPS2025-229, https://doi.org/10.5194/epsc-dps2025-229, 2025.
Introduction:
The HRSC camera onboard the ESA‘s Mars Express spacecraft has been operational in Mars Orbit since January 2004. Since then, it has been acquiring image data of the Martian surface in colour and photogrammetric stereo, achieving a near-complete coverage at resolutions better than 50 m, and complete coverage at lower resolutions.
One of the main mission goals is the creation of a global high-resolution image mosaic, using the HRSC global Digital Elevation Model (DEM) as a basis for geometric correction [1]. In addition, we are creating a mosaic based on the Level-3 images, which are orthorectified using the MOLA DEM. These images are created automatically after data acquisition. While they possess a significantly lower geometric accuracy than the HRSC DEM based level 5 images, they are available much earlier.
The idea of the Level 3 image mosaics is to use this independent processing chain to produce a high-quality image product - with lower resolution - at a much faster pace than it would be possible when relying on the labour-intensive Level 5 data. Using Level 3 data, a complete HRSC mosaic of Mars Chart MC quadrangle can be finished within one month. In the last months, we finished this Level-3 mosaic for the Martian mid-latitudes and equatorial regions, and created a consistent, high quality dataset.
Image 1: The HRSC Level-3 Mars mosaic (MC-30 scheme). New mid-latitude mosaics are outlined in red.
Methods:
Image selection: Images are selected based on the Mars Charts MC-30 scheme.
Lambert correction: A Lambert correction is applied to each image to correct different lighting conditions, planetary curvature etc.
Brightness adjustment: For brightness adjustment, an external brightness reference is used [2,3]. This ensures a consistent brightness for all images of a location regardless of imaging conditions.
Sorting and Adjustment: Initially, all images are sorted by projected resolution. As this does not necessarily reflect image quality, a parameter „effective ground resolution“ was introduced. Using QGIS, images are sorted according to their perceived quality, if necessary, a new effective resolution is assigned manually. A contrast adjustment factor is also assigned, to ensure a good usability of the mosaic for optical interpretation. Along-track, different contrast adjustment values can be assigned. All these changes are recorded in the QGIS project file, which is used by the processing software to provide both image sequencing and contrast adjustments for the next iteration.
Master catalog: All changes to the “effective ground resolution” and contrast adjustments for all images are recorded in a master catalog document. This master catalog allow to process a HRSC mosaic for any region on Mars, providing the settings required for an optimal sequence and contrast. If a new mosaic is created where an adjacent mosaic already exists, adjustments made for images which are part of both regions are applied. These changes can then be revised and adjusted.
Finalizing: The process of sorting and adjustment takes several iterations. For the final version, a mosaic with a fixed resolution of 50 m/pixel is produced. The image borders are processed with a feathering algorithm to minimize visual differences. The final image mosaics are then uploaded to the HRSC mapserver at Freie Universität Berlin [4] and made available as a COG file (cloud-optimized GeoTIFFs [5]) for direct integration in a GIS without download.
Image 2: Mawrth Vallis (MC-11). Image width is approximatey 600 km.
Results:
The resulting Level 3 mosaic provides a unique high-resolution view of the Martian surface between 60° north and 60° south. The resolution surpasses that of the available global THEMIS IR mosaic. It has been referenced to an albedo map, which offers two distinct advantages: Brightness is linked to the TES reference and thus reflects the real visual brightness of the Martian surface, and the different images are homogeneous and offer a possibility for image analysis without accounting for brightness breaks.
The Master catalog for Level 3 data can also be used when creating mosaics based on higher processing levels. These mosaics just require some fine-tuning to compensate for different coverage. For the production of Level-5 mosaics, it has turned out that only minor adjustments are required to create a high-quality image.
The Level 3 mosaics are geometrically inferior to higher-level products, leading to some offsets along image borders. The overall image quality is very good, and the lower geodetic requirements for the image data lead to a more complete coverage.
Outlook:
We are currently using the Master catalog data to create Level 5 mosaics. In addition, we investigate how to transfer the method to polar mosaics with their specific difficulties, and how the methods and tools can be applied to mosaic creation using other datasets.
Acknowledgments: The authors wish to thank the DLR for funding this work by DLR grant 50OO2204 (Koregistrierung), and ESA for the continued support and operations of the Mars Express mission
Data availability: The data and the current coverage is available on the HRSC Mapserver at Freie Universität Berlin via the following links:
COG file:
https://maps.planet.fu-berlin.de/level3/hrsc3-mos.tif
ArcGIS VRT file:
https://maps.planet.fu-berlin.de/level3/hrsc3-mos.vrt
References:
[1] Gwinner et al. (2016), P&SS 126, DOI: 10.1016/j.pss.2016.02.014
[2] Michael, G.G. et al. (2016), P&SS 121, DOI: 10.1016/j.pss.2015.12.002
[3] Michael, G.G. et al., 2025 Icarus 425, DOI: 10.1016/j.icarus.2024.116350
[4] Walter, S.H.G- et al., 2018 ESS 5, DOI: 10.1029/2018EA000389
How to cite: Zuschneid, W., Michael, G., Walter, S., and Postberg, F.: The HRSC Level 3 Mosaic of Mars - now with mid-latitudes, EPSC-DPS Joint Meeting 2025, Helsinki, Finland, 7–13 Sep 2025, EPSC-DPS2025-1801, https://doi.org/10.5194/epsc-dps2025-1801, 2025.
Recent advancements in processing capabilities and software interoperability have significantly improved photogeological analysis. However, the sheer volume of image datasets continues to present scientists with challenges. Effective analysis requires specialist knowledge of camera instruments, particularly for Mars exploration, where missions have continuously delivered images since the 1960s and several new missions are already in the pipeline. We present a typical workflow for Mars remote sensing imagery, emphasising the importance of combining accumulated information in the form of its spatiotemporal context (see Fig.1).
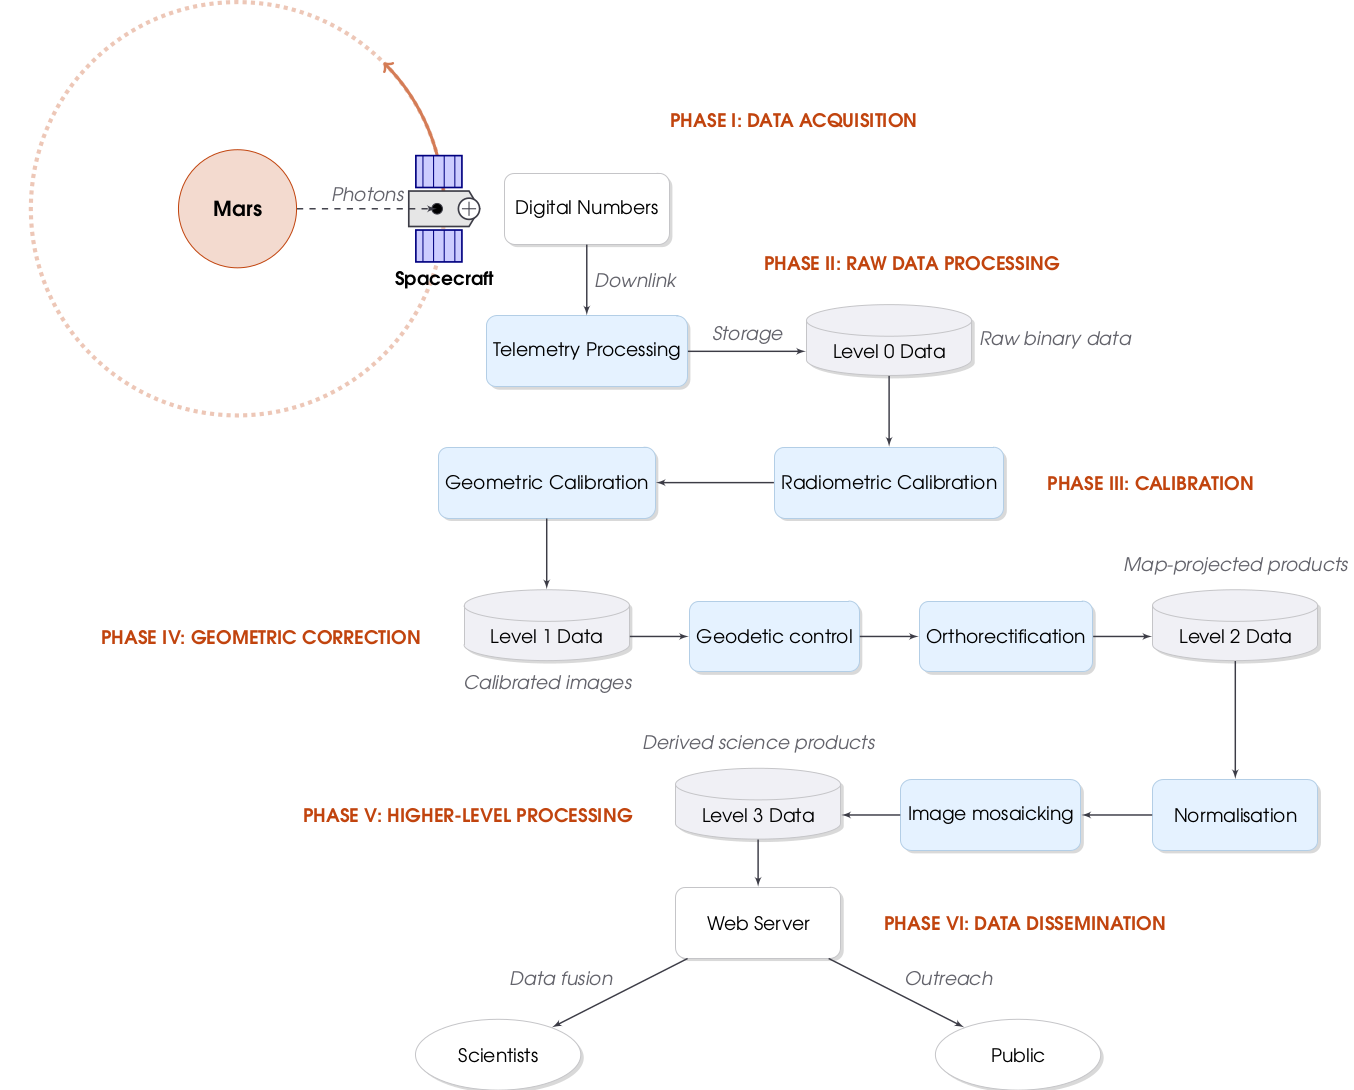
Fig. 1: Flowchart for a typical life-cycle of planetary remote sensing image data from acquisition to dissemination.
Although data fusion with other instruments and thematic maps offers new interpretative possibilities, it is difficult due to several challenges. High-resolution imagery often suffers from insufficient geodetic control, resulting in misplaced images. Although multi-instrument co-registration to well-controlled reference datasets can address this issue, it requires specialised expertise. Brightness normalisation methods have improved, but they incorporate secondary derived data that is not fully reproducible. The strong influence of illumination-induced shading, which often varies between dataset acquisitions, poses a significant challenge. Furthermore, certain applications prohibit altering the physical values of image contents.
These challenges highlight the urgent need for improved image pre-processing, including radiometric and geometric calibration. Such processing requires in-depth knowledge of the instruments, which can take years to acquire and which analysing scientists may not possess. As a key example, we address the radiometric calibration of the CTX camera. This instrument has orbited Mars since 2006 and suffered from a significant defect that caused darkening of 8% towards the edges, known as the 'smile/frown effect'. Our new in-flight calibration eliminates this effect entirely, enabling more precise albedo measurements and seamless mosaicking (see Fig. 2).
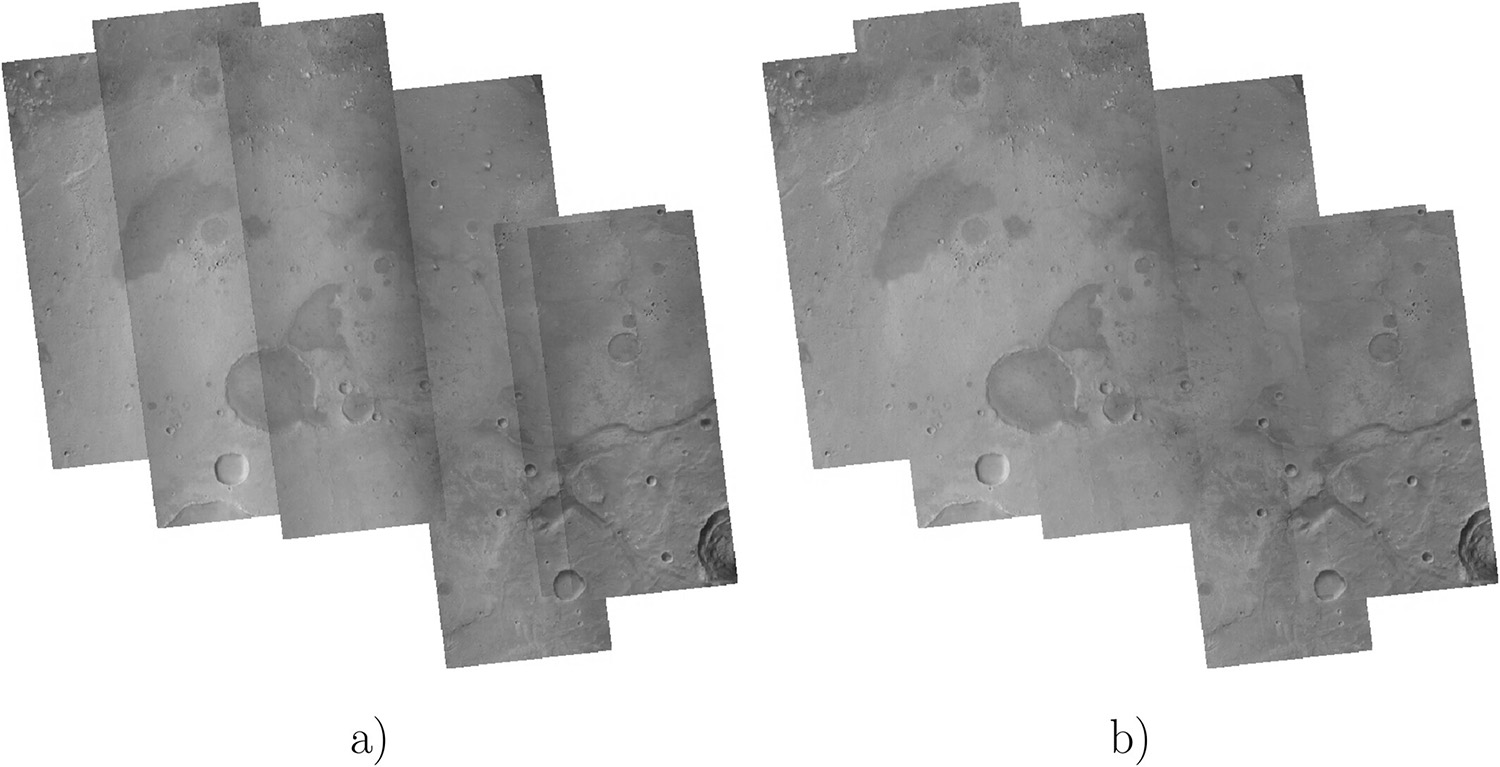
Fig. 2: Example CTX mosaic of the Oxia Planum region, ExoMars Rosalind Franklin Rover landing site. Images were chosen from Martian Year 33. (a) before, (b) after the new flat-field calibration [1].
The vast data volumes make tracking the availability and accessibility of data difficult. Proper mapping requires access to the original data, since mosaicking can destroy information that cannot be reproduced by every analyst. Scientists often have to analyse thousands of images for a single region of interest, which overwhelms standard tools. While numerous initiatives aim to process planetary image data on a large scale to make it more easily accessible to scientists, interoperability between proprietary software vendors remains inconsistent. We introduce innovative methods for managing these vast image collections, providing enhanced functionality through interactive, web-based mapping tools. These tools facilitate spatiotemporal analysis both online and within specialised research environments, such as GIS.
Our work demonstrates the practical application of these approaches through geological case studies of surface changes and spatiotemporal analyses on Mars.
[1] Walter, S. H. G., Aye, K.-M., Jaumann, R., & Postberg, F. (2024). Mars reconnaissance orbiter context camera updated in-flight calibration. Earth and Space Science, 11, e2023EA003491. https://doi.org/10.1029/2023EA003491
How to cite: Walter, S.: Life cycle of planetary images from Mars orbit - from raw data processing to high-level data dissemination, EPSC-DPS Joint Meeting 2025, Helsinki, Finland, 7–13 Sep 2025, EPSC-DPS2025-1959, https://doi.org/10.5194/epsc-dps2025-1959, 2025.
Introduction
OMEGA-Py [1,2] is a Python 3 module dedicated to the scientific use of data provided by the Observatoire pour la Minéralogie, l’Eau, les Glaces et l’Activité (OMEGA) instrument onboard the ESA Mars Express (MEx) orbiter [3]. It has been developed as an alternative to the IDL routines of the OMEGA legacy software provided by the instrument team for the past 20 years [4] and its validation by comparison with the results of the IDL routines has been endorsed by the OMEGA PI. The module notably includes a Python reimplementation of the most recent release of the IDL OMEGA software (v10, SOFT10) [4], which performs the reading, calibration, and reduction of the level 1B data publicly available on the ESA PSA to produce level 2A data (calibrated reflectances cubes) that can be used for the scientific analysis. In addition, the module also includes built-in functions to perform the atmospheric and thermal corrections of the data (using previously published methods) and graphic tools dedicated to the OMEGA hyperspectral data including interactive visualization of the cubes or generation of composite OMEGA maps. Also, since the release of its version 3.0 in October 2023 (currently in version 3.2, released on January 2025), OMEGA-Py is now distributed as part of the official OMEGA software ecosystem (https://www.ias.u-psud.fr/omega/software.html).
Why this module?
The accessibility of data returned by space missions is a crucial point to ensure the development of open science, and unfortunately the OMEGA dataset has acquired over the past years a reputation in the community for being challenging and requiring a significant amount of investment to use. With OMEGA-Py we aim to tackle this reputation by providing a free all-in-one toolbox to load, correct, analyze, and visualize the OMEGA data, along with a full online documentation with examples.
Data handling
OMEGA-Py includes a reimplementation of the readomega.pro routine of the IDL software, which reads and processes the L1B data that can be downloaded from the PSA to generate the L2A. A sensible improvement with OMEGA-Py is its implementation in Object Oriented Programming, which makes the simultaneous handling of several OMEGA observations easier. When loading an OMEGA observation, all the extracted data are stored within an OMEGAdata object. In addition, the wavelengths are also automatically reordered in ascending order and the spectra are ”cleaned” to remove the overlaps between the three channels (V, C, L) as well as the identified corrupted pixels. This allows the user to have direct access to reflectance spectra that can be used for scientific analysis purposes.
Data correction
Using orbital remote sensing observations like OMEGA data for scientific analysis and research may require to apply some corrections to remove the atmospheric and/or thermal contributions that affect the spectra, as shown on Figure 1. Methods to correct the OMEGA observations have been described in several publications and extensively used over the past 20 years [e.g., 5, 6], but they have never been part of the distributed IDL software.
Here OMEGA-Py provides to the users built-in functions to easily correct the data from the atmosphere using the typical volcano-scan technique [5], and from the thermal emission of the planet [6,7]. Plus, as the thermal correction of an OMEGA data cube is time-consuming, parallel processing using the multiprocessing module has been implemented to fasten the process.

Figure 1 – Correction steps of an OMEGA spectrum with OMEGA-Py (reproduced from [8]).
Visualization
OMEGA-Py also comes with a set of visualization functions specifically developed for the OMEGA data, including:
- Projection of the data maps on a longitude/latitude equatorial or polar grid, according to the geometry of the observation.
- Generation of composite maps from a series of OMEGA observations, either for the reflectance or a previously computed spectral criteria (see Figure 2).
- Interactive display of an OMEGA observation that allows the user to display the spectra by clicking with their mouse on the pixels of the map (see Figure 3).
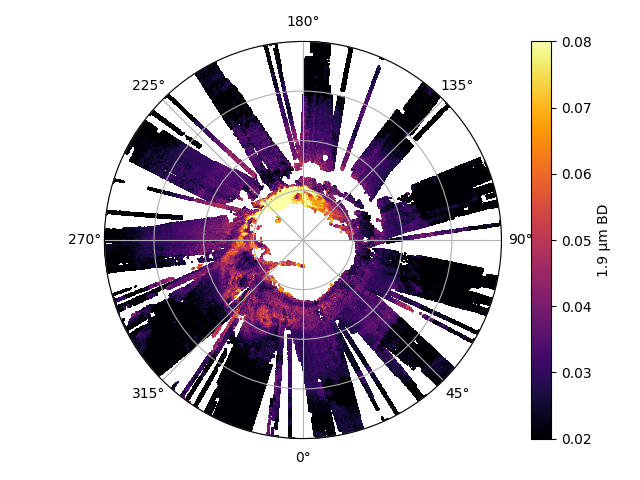
Figure 2 – 1.9 µm band depth map in the North polar regions from OMEGA observations, excluding areas covered by water ice, made with OMEGA-Py [8].
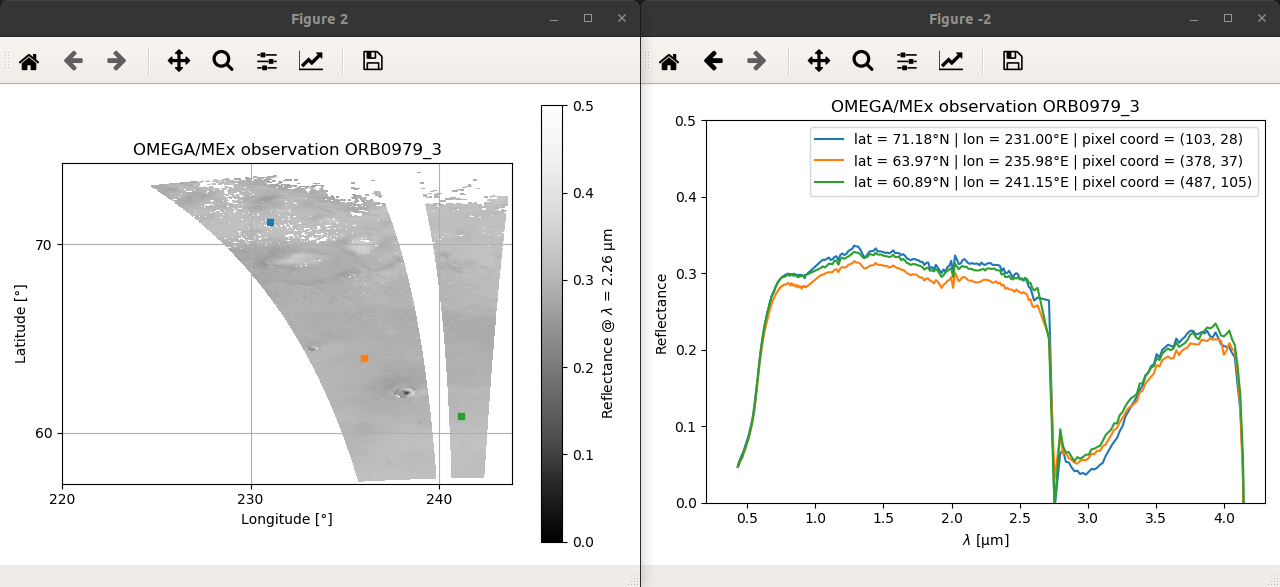
Figure 3 – Interactive visualization of an OMEGA observation with OMEGA-Py.
Conclusion & Perspectives
With OMEGA-Py we provide a new and complete solution to use and analyze the data that are returned since 2004 by the OMEGA instrument. The Python implementation and the presence of built-in correction and visualization functions will help in making the huge and very complete OMEGA dataset more accessible, especially for the younger generation of scientists and students, or for people who want to have a quick and easy access to some OMEGA data for comparison with other instruments, models or lab work. Plus, its very easy way to load OMEGA data and the functionalities to improve the processing time make the module perfectly suitable for batch processing or data mining. The official validation of the module by the instrument team in 2023, as an alternative solution to the legacy IDL software, has been an important step for the project. Since its first release in 2020, OMEGA-Py has been used in several published studies and ongoing projects [e.g., 8–11].
Acknowledgments
The full documentation of the OMEGA-Py Python module is available at https://astcherbinine.github.io/omegapy.
References
[1] Stcherbinine A. et al. (2024) JOSS, 9(99), 6566. [2] Stcherbinine A. et al. (2025) OMEGA-Py:Python tools for OMEGA data, (v3.2), Zenodo. [3] Bibring J.-P. et al. (2004) ESA Publication Division, 1240:37–49. [4] OMEGA Team , SOFT 10 IDL routines (2004). [5] Langevin Y. et al. (2005) Science, 307(5715):1584–1586. [6] Jouglet D. et al. (2007) JGR: Planets, 112(E8). [7] Audouard J., Ph.D. thesis Université Paris-Sud XI (2014). [8] Stcherbinine A. et al. (2021) Icarus, 369:114627. [9] Leseigneur Y. and Vincendon M. (2023) Icarus, 392:115366. [10] Barraud O. et al. (2024) EPSC2024-921. [11] Brasil F. et al. (2025) JGR: Planets, 130, e2024JE008726
How to cite: Stcherbinine, A., Langevin, Y., Carter, J., Vincendon, M., Leseigneur, Y., Barraud, O., and Schmidt, F.: The OMEGA-Py Python module: a complete and easy way to work with OMEGA/MEX observations, EPSC-DPS Joint Meeting 2025, Helsinki, Finland, 7–13 Sep 2025, EPSC-DPS2025-1434, https://doi.org/10.5194/epsc-dps2025-1434, 2025.
Please decide on your access
Please use the buttons below to download the supplementary material or to visit the external website where the presentation is linked. Regarding the external link, please note that Copernicus Meetings cannot accept any liability for the content and the website you will visit.
Forward to presentation link
You are going to open an external link to the presentation as indicated by the authors. Copernicus Meetings cannot accept any liability for the content and the website you will visit.
We are sorry, but presentations are only available for users who registered for the conference. Thank you.
Please decide on your access
Please use the buttons below to download the supplementary material or to visit the external website where the presentation is linked. Regarding the external link, please note that Copernicus Meetings cannot accept any liability for the content and the website you will visit.
Forward to session asset
You are going to open an external link to the asset as indicated by the session. Copernicus Meetings cannot accept any liability for the content and the website you will visit.
We are sorry, but presentations are only available for users who registered for the conference. Thank you.