
 1,3,1,4,4,4,5,6,5,7,1,3,1
- 1Centro de Astrobiologia (INTA-CSIC), Madrid, Spain (gmm@cab.inta-csic.es)
- 2Jet Propulsion Laboratory, California Institute of Technology, Pasadena, CA, USA
- 3Instituto Nacional de Técnica Aeroespacial, Torrejón de Ardoz, Spain
- 4Finnish Meteorological Institute, Helsink, Finland
- 5Universidad del País Vasco, Euskal Herriko Unibertsitatea, Leioa, Spain
- 6Space Science Institute, Boulder, CO, USA
- 7Aeolis Research, Chandler, AZ, USA
1. Introduction
The Mars Environmental Dynamics Analyzer (MEDA) instrument onboard the Mars 2020 Perseverance rover [1] has been measuring the environmental conditions at Jezero Crater for over 1450 sols since landing, covering from Ls ~ 5° in MY 36 to Ls ~ 70° in MY 38, and it continues to operate. Here we detail MEDA’s evolving measurement strategy under changing resource constraints, describe sensor performance, and present processed data through sol 1450.
2. MEDA Measurement Strategy
MEDA’s daily measurement cadence has varied throughout the mission in response to available resources (Fig. 1). Until sol 1116, MEDA followed a nominal cadence of 1h-and-5' blocks starting at odd hours on odd sols, and even hours on even sols, with 3 to 4 SkyCam images per sol. Additional blocks were added when resources allowed. During each block, MEDA sensors operated at 1 Hz, although some sensors occasionally recorded at 2 Hz.
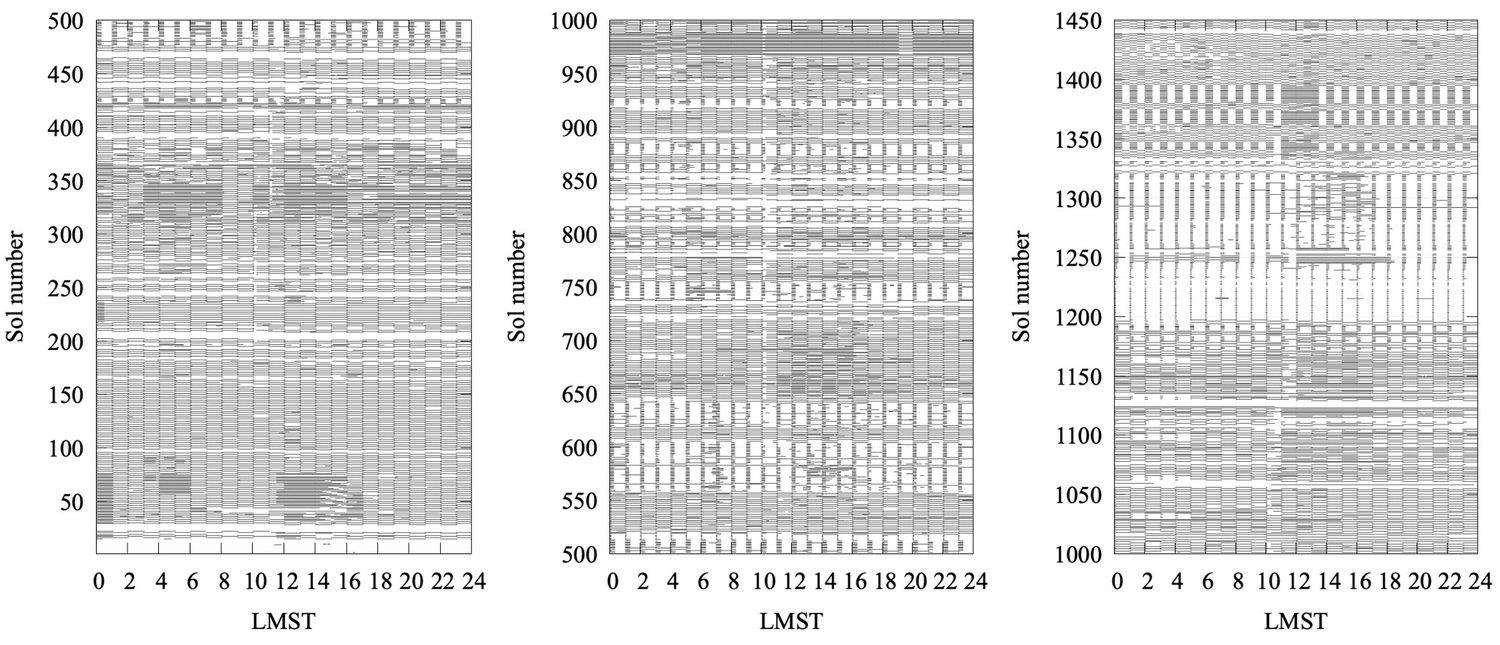
Figure 1. Temporal coverage through sol 1450.
A reduced cadence was implemented from sol 1197 to 1319, consisting of 5’ or 10' blocks at the start of each hour, 1 Hz sampling, and 2 SkyCam images per sol. Beginning on sol 1320, and due to Wind Sensor (WS) degradation from sand abrasion, a new nominal cadence was adopted with 30’ blocks covering hh:00-hh:30 on even sols, and hh:30-hh:00 on odd sols, two additional 30’ floating blocks to support science activities, and 2 SkyCam images. Under this cadence, the WS is only active for 15’ every 2h for a total of 4h per sol, while the Atmospheric Temperature Sensor (ATS), Thermal Infrared Sensor (TIRS), Pressure Sensor (PS), Humidity Sensor (HS), and Radiation and Dust Sensor (RDS) operate 13h per sol.
3. Sensor Performance
All MEDA sensors are operating nominally except for the WS, which has suffered progressive damage from saltating sand and dust grains (Fig. 2, left). The first major damage occurred during a dust devil encounter on sol 313, limiting WS measurements of the highest confidence to the first 313 sols. The WS was reactivated on sol 345 with reduced capability, and further failures have since occurred. Optimized methods are being developed to interpret wind conditions from the remaining sensor outputs, with plans to release these data soon.
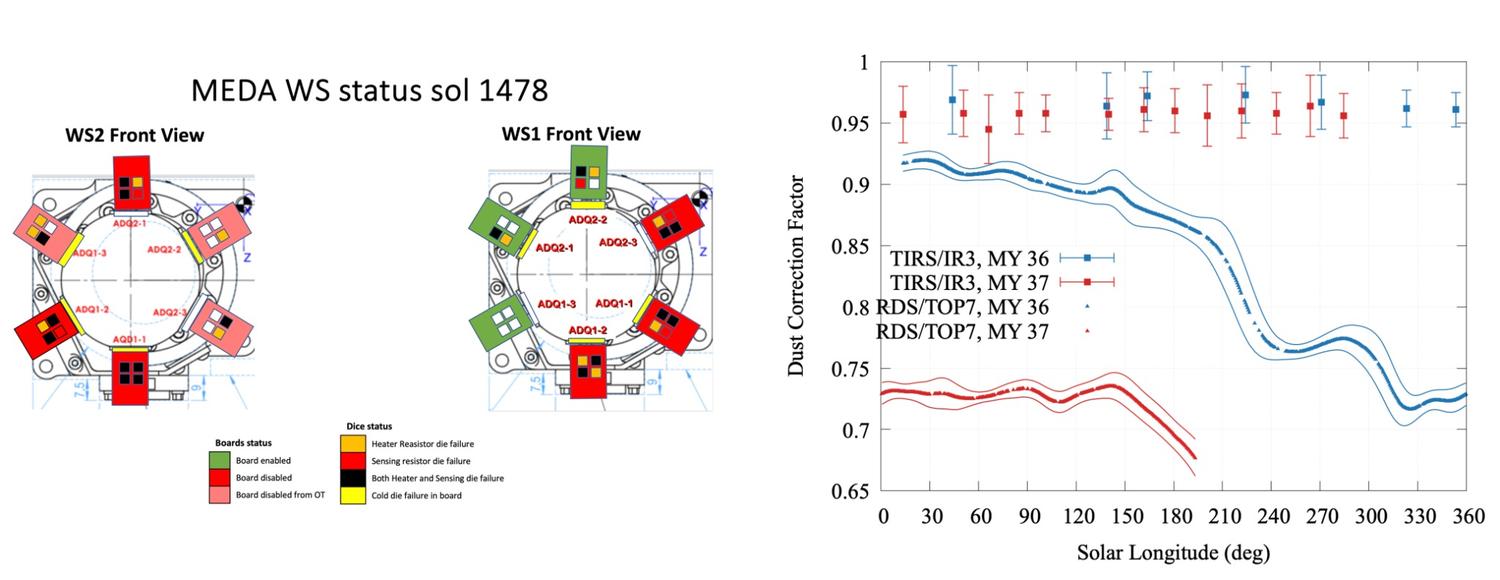 Figure 2. (Left) WS status as of sol 1478, showing the damage to the boards and dice, color-coded by severity. (Right) DCF as a function of Ls for the upward-looking TIRS/IR3 (0.3–3 µm) and RDS/TOP7 (0.19–1.2 µm) channels during MY 36 and 37.
While TIRS and RDS continue to operate nominally, dust accumulation on them requires corrections to their readings. The Dust Correction Factor (Fig. 2, right) is used to quantify the fraction of the incoming surface radiation that reaches the RDS/TOP7 and TIRS/IR3, respectively [2,3]. While TIRS measurements available in NASA’s PDS are corrected for this effect, RDS measurements are not.
4. Processed MEDA Data through Sol 1450
Fig. 3 shows the seasonal and interannual evolution of the environmental quantities measured by MEDA. Data from TIRS, PS, WS, and ATS were calculated as averages over the first 5’ of each hour and half-hour. For the HS, only measurements taken during the first few seconds after the HS was activated (following at least ~5 minutes of inactivity) were considered to avoid heating effects [4]. Water vapor volume mixing ratio was calculated as VMR = RH × es(T)/P, where esis the saturation vapor pressure over ice. Due to low daytime RH, MEDA-derived VMR values are restricted to nighttime.
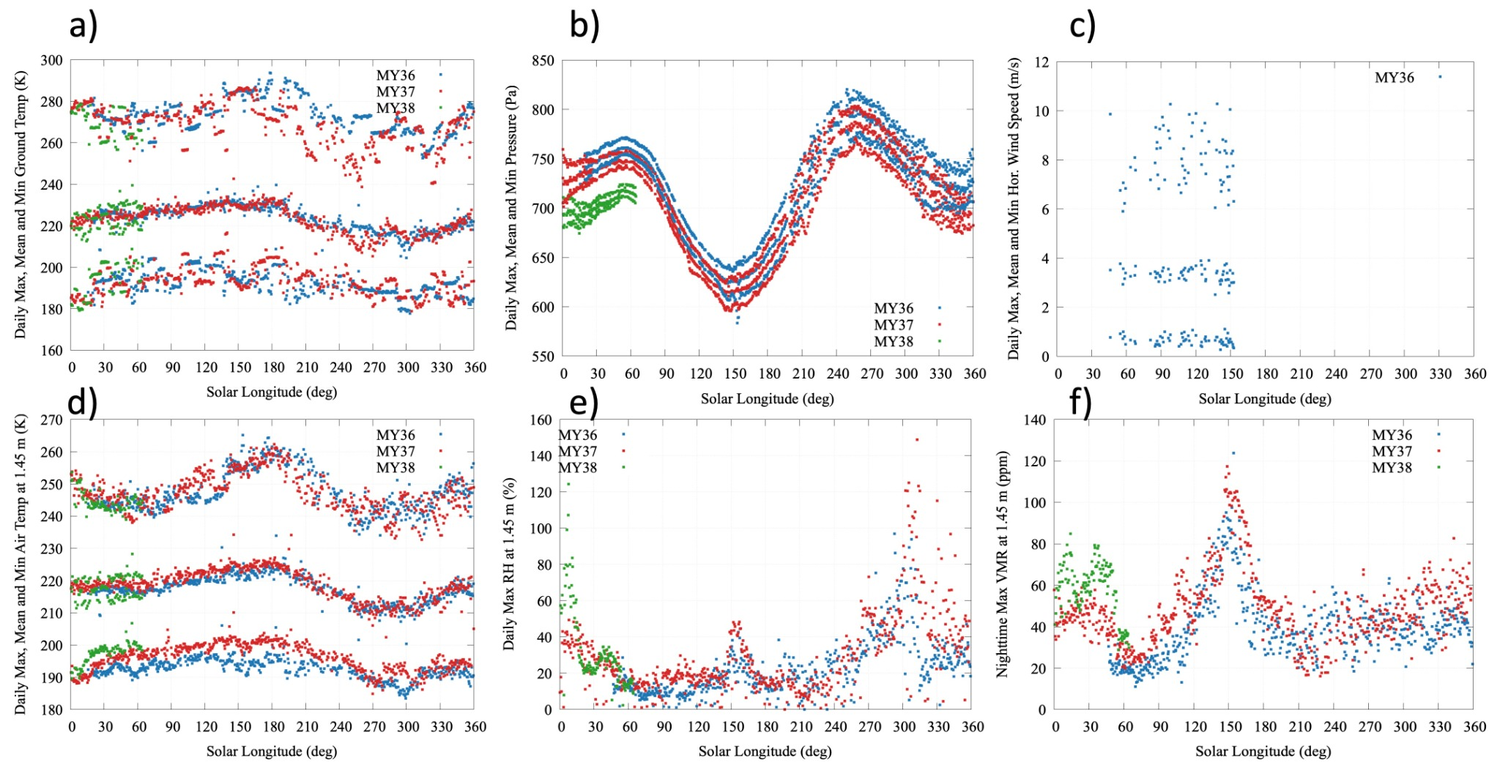 Figure 3. Environmental conditions through sol 1450. Daily maximum, mean, and minimum ground temperature (a); atmospheric pressure (b); horizontal wind speed (c); air temperature (d), where only ATS1, ATS2, and ATS3 have been considered; daily maximum relative humidity (e); and nighttime maximum water vapor VMR (f).
Fig. 4 shows the aerosol opacity retrieved from SkyCam through sol 1450. For comparison, retrievals from the ZCAM instrument [5] are also shown. After approximately sol 700, sand and dust particles accumulated on the SkyCam may have introduced outliers.
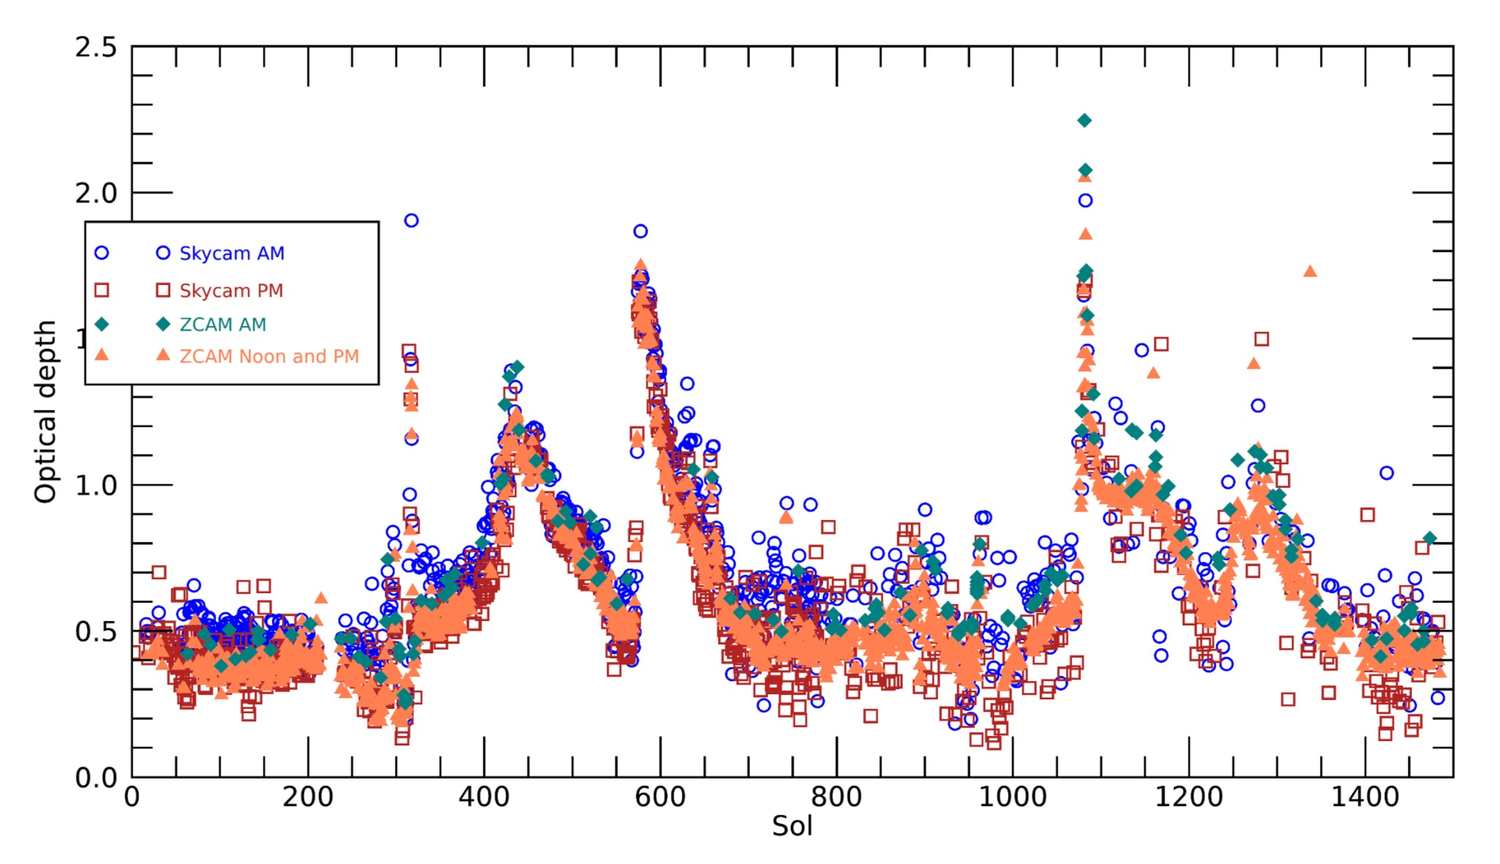
Figure 4. Aerosol opacity (dust + water ice) retrieved from SkyCam (0.691 µm) and ZCAM (0.88 µm), color-coded by acquisition time.
Fig. 5 shows the seasonal and interannual evolution of each surface energy budget term. Downwelling and reflected solar fluxes have been extended to the full solar range (0.19–5 mm) as described in [6]. The limited coverage of the downwelling solar flux and the sensible heat flux is due to the availability of the DCF, which has only been calculated through sol 1051 (Fig. 2, right), and to the availability of WS data. Similarly, the net heat flux into the ground has been computed only through sol 1051, based on the availability of dust-corrected downwelling solar fluxes. Daily minimum net heat flux values in MY 37 centered around Ls ~50° and 150° are caused by shadows affecting the RDS, which result in artificially low net heat flux values.
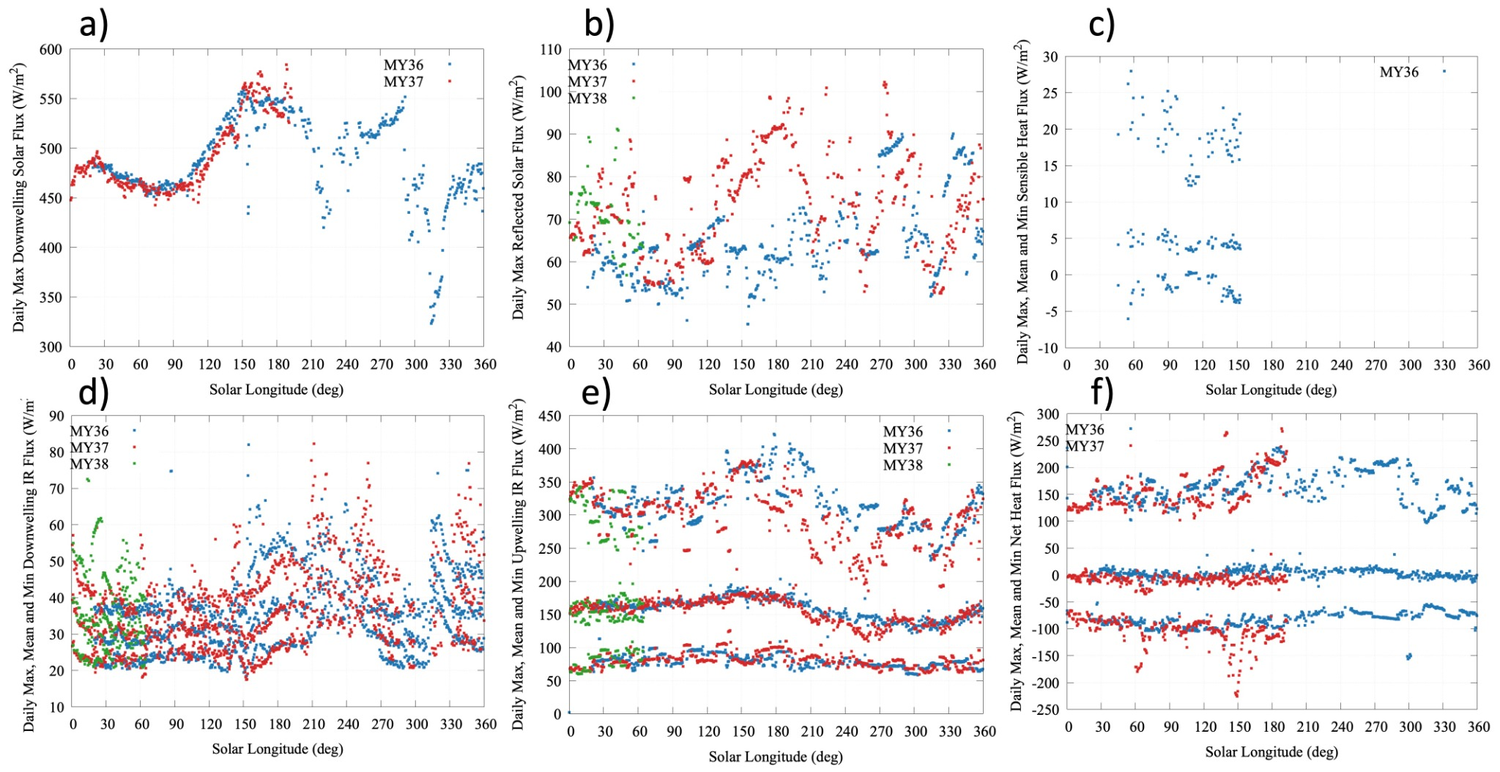
Figure 5. Surface energy budget at Jezero Crater through sol 1450. (a) Daily maximum downwelling solar flux (0.19–5 µm). (b) Daily maximum reflected solar flux (0.19–5 µm). (c) Daily maximum, mean, and minimum sensible heat flux. (d) Daily maximum, mean, and minimum downwelling longwave flux (5–80 µm). (e) Daily maximum, mean, and minimum upwelling longwave flux emitted by the surface (5–80 µm). (f) Daily maximum, mean, and minimum net heat flux.
Acknowledgments
This work has been funded by the Spanish MEC, through projects No. ESP2014-54256-C4-1-R and AYA2015- 65041-P; MCIU, No. ESP2016-79612-C3-1-R, ESP2016-80320-C2-1-R, RTI2018-098728-B-C31, RTI2018-099825-B-C31, MDM-2017-0737 and PID2021-126719OB-C41; INTA and CDTI.
References
[1] Rodríguez-Manfredi, J. A., et al. (2021). Space Sci. Rev., 217(3), 1–86. [2] Sebastián, E., et al. (2025), Acta Astronaut., 226, 791–802. [3] Vicente‐Retortillo, A., et al. (2024). Geophys. Res. Lett., 51, e2023GL107975. [4] Polkko, J., et al. (2023). J. Geophys. Res. Planets 128, e2022JE007447. [5] Bell, J. F., et al. (2021). Space Sci. Rev., 217, 24. [6] Martínez, G. M., et al. (2023). J. Geophys. Res. Planets, 128, e2022JE007537.
How to cite: Martinez, G., Manfredi, J. A., de la Torre-Juarez, M., Apéstigue, V., Gomez, F., Genzer, M., Harri, A.-M., Hieta, M., Hueso, R., Lemmon, M., McConnochie, T., Munguira, A., Newman, C., Pla-Garcia, J., Polkko, J., Sanchez-Lavega, A., Sebastian, E., Tamppari, L., Toledo, D., and Vicente-Retortillo, A.: MEDA on Mars 2020: Environmental Data and Sensor Insights through Sol 1450, EPSC-DPS Joint Meeting 2025, Helsinki, Finland, 7–13 Sep 2025, EPSC-DPS2025-1461, https://doi.org/10.5194/epsc-dps2025-1461, 2025.