Multiple terms: term1 term2
red apples
returns results with all terms like:
Fructose levels in red and green apples
Precise match in quotes: "term1 term2"
"red apples"
returns results matching exactly like:
Anthocyanin biosynthesis in red apples
Exclude a term with -: term1 -term2
apples -red
returns results containing apples but not red:
Malic acid in green apples
hits for "" in
Network problems
Server timeout
Invalid search term
Too many requests
Empty search term
TP6

modeling that help to understand processes at past, present or future landing sites.
Session assets
1. Introduction
The Mars Environmental Dynamics Analyzer (MEDA) instrument onboard the Mars 2020 Perseverance rover [1] has been measuring the environmental conditions at Jezero Crater for over 1450 sols since landing, covering from Ls ~ 5° in MY 36 to Ls ~ 70° in MY 38, and it continues to operate. Here we detail MEDA’s evolving measurement strategy under changing resource constraints, describe sensor performance, and present processed data through sol 1450.
2. MEDA Measurement Strategy
MEDA’s daily measurement cadence has varied throughout the mission in response to available resources (Fig. 1). Until sol 1116, MEDA followed a nominal cadence of 1h-and-5' blocks starting at odd hours on odd sols, and even hours on even sols, with 3 to 4 SkyCam images per sol. Additional blocks were added when resources allowed. During each block, MEDA sensors operated at 1 Hz, although some sensors occasionally recorded at 2 Hz.
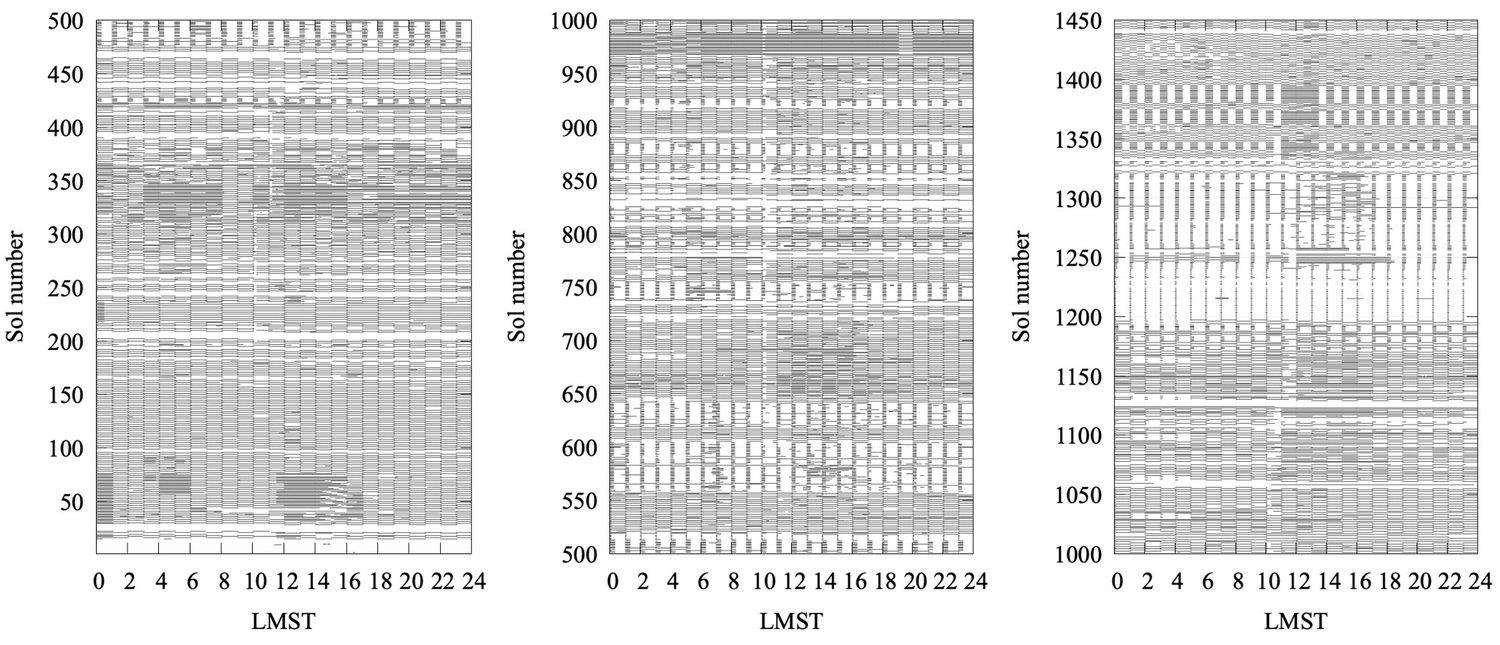
Figure 1. Temporal coverage through sol 1450.
A reduced cadence was implemented from sol 1197 to 1319, consisting of 5’ or 10' blocks at the start of each hour, 1 Hz sampling, and 2 SkyCam images per sol. Beginning on sol 1320, and due to Wind Sensor (WS) degradation from sand abrasion, a new nominal cadence was adopted with 30’ blocks covering hh:00-hh:30 on even sols, and hh:30-hh:00 on odd sols, two additional 30’ floating blocks to support science activities, and 2 SkyCam images. Under this cadence, the WS is only active for 15’ every 2h for a total of 4h per sol, while the Atmospheric Temperature Sensor (ATS), Thermal Infrared Sensor (TIRS), Pressure Sensor (PS), Humidity Sensor (HS), and Radiation and Dust Sensor (RDS) operate 13h per sol.
3. Sensor Performance
All MEDA sensors are operating nominally except for the WS, which has suffered progressive damage from saltating sand and dust grains (Fig. 2, left). The first major damage occurred during a dust devil encounter on sol 313, limiting WS measurements of the highest confidence to the first 313 sols. The WS was reactivated on sol 345 with reduced capability, and further failures have since occurred. Optimized methods are being developed to interpret wind conditions from the remaining sensor outputs, with plans to release these data soon.
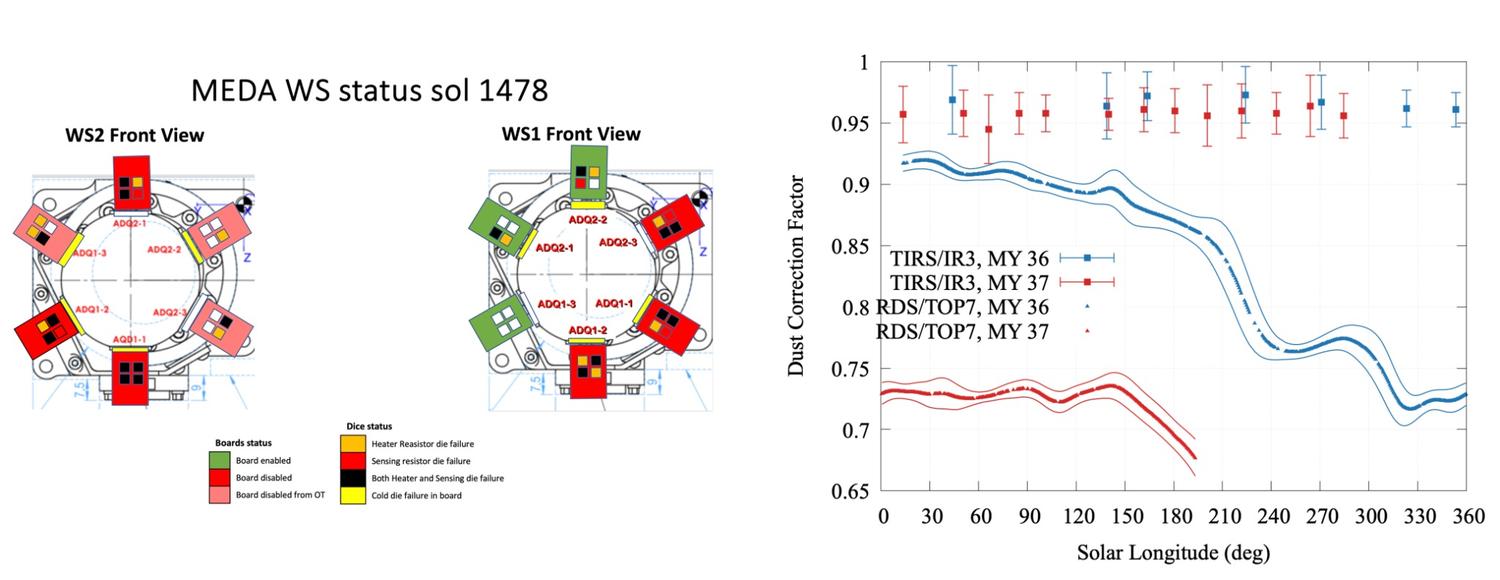 Figure 2. (Left) WS status as of sol 1478, showing the damage to the boards and dice, color-coded by severity. (Right) DCF as a function of Ls for the upward-looking TIRS/IR3 (0.3–3 µm) and RDS/TOP7 (0.19–1.2 µm) channels during MY 36 and 37.
While TIRS and RDS continue to operate nominally, dust accumulation on them requires corrections to their readings. The Dust Correction Factor (Fig. 2, right) is used to quantify the fraction of the incoming surface radiation that reaches the RDS/TOP7 and TIRS/IR3, respectively [2,3]. While TIRS measurements available in NASA’s PDS are corrected for this effect, RDS measurements are not.
4. Processed MEDA Data through Sol 1450
Fig. 3 shows the seasonal and interannual evolution of the environmental quantities measured by MEDA. Data from TIRS, PS, WS, and ATS were calculated as averages over the first 5’ of each hour and half-hour. For the HS, only measurements taken during the first few seconds after the HS was activated (following at least ~5 minutes of inactivity) were considered to avoid heating effects [4]. Water vapor volume mixing ratio was calculated as VMR = RH × es(T)/P, where esis the saturation vapor pressure over ice. Due to low daytime RH, MEDA-derived VMR values are restricted to nighttime.
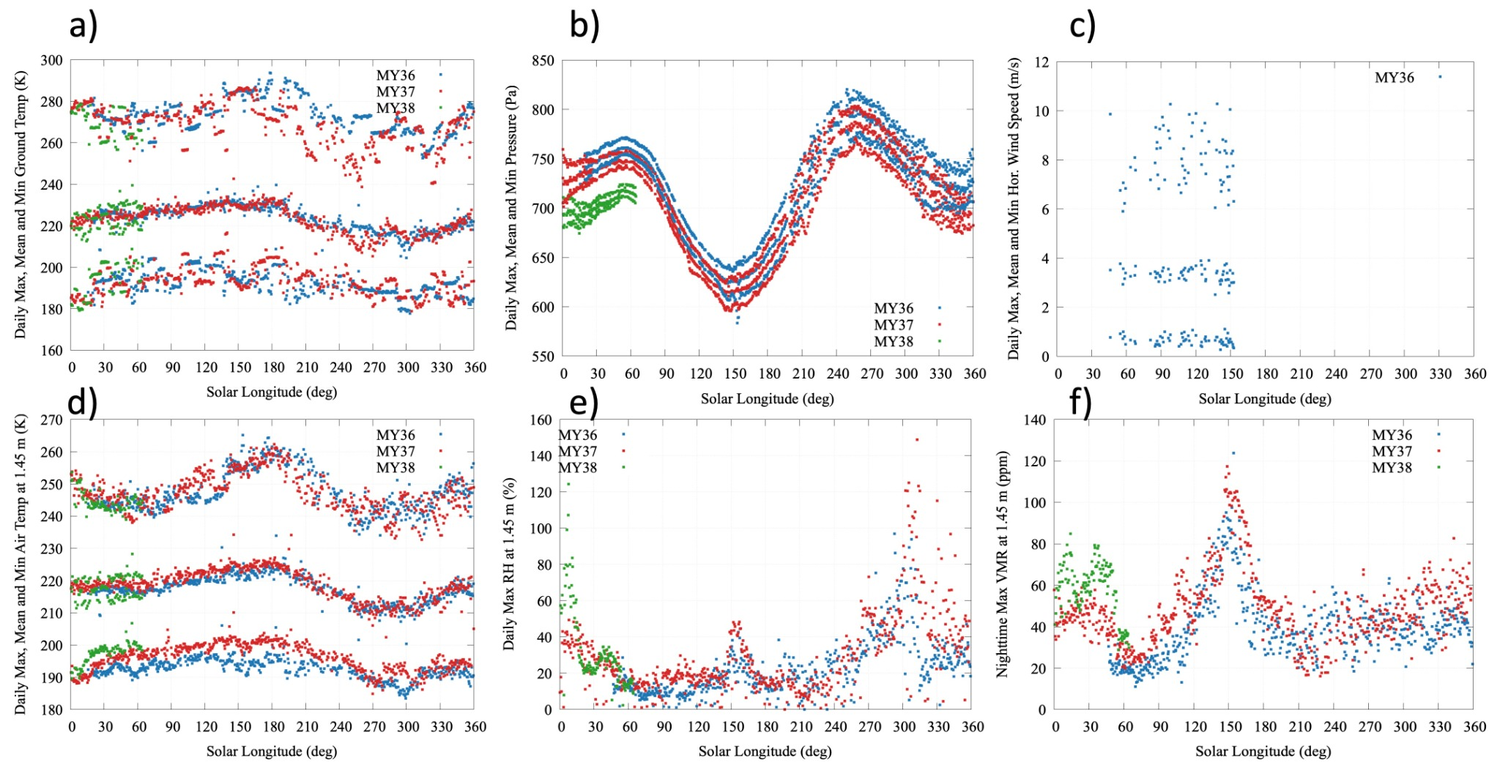 Figure 3. Environmental conditions through sol 1450. Daily maximum, mean, and minimum ground temperature (a); atmospheric pressure (b); horizontal wind speed (c); air temperature (d), where only ATS1, ATS2, and ATS3 have been considered; daily maximum relative humidity (e); and nighttime maximum water vapor VMR (f).
Fig. 4 shows the aerosol opacity retrieved from SkyCam through sol 1450. For comparison, retrievals from the ZCAM instrument [5] are also shown. After approximately sol 700, sand and dust particles accumulated on the SkyCam may have introduced outliers.
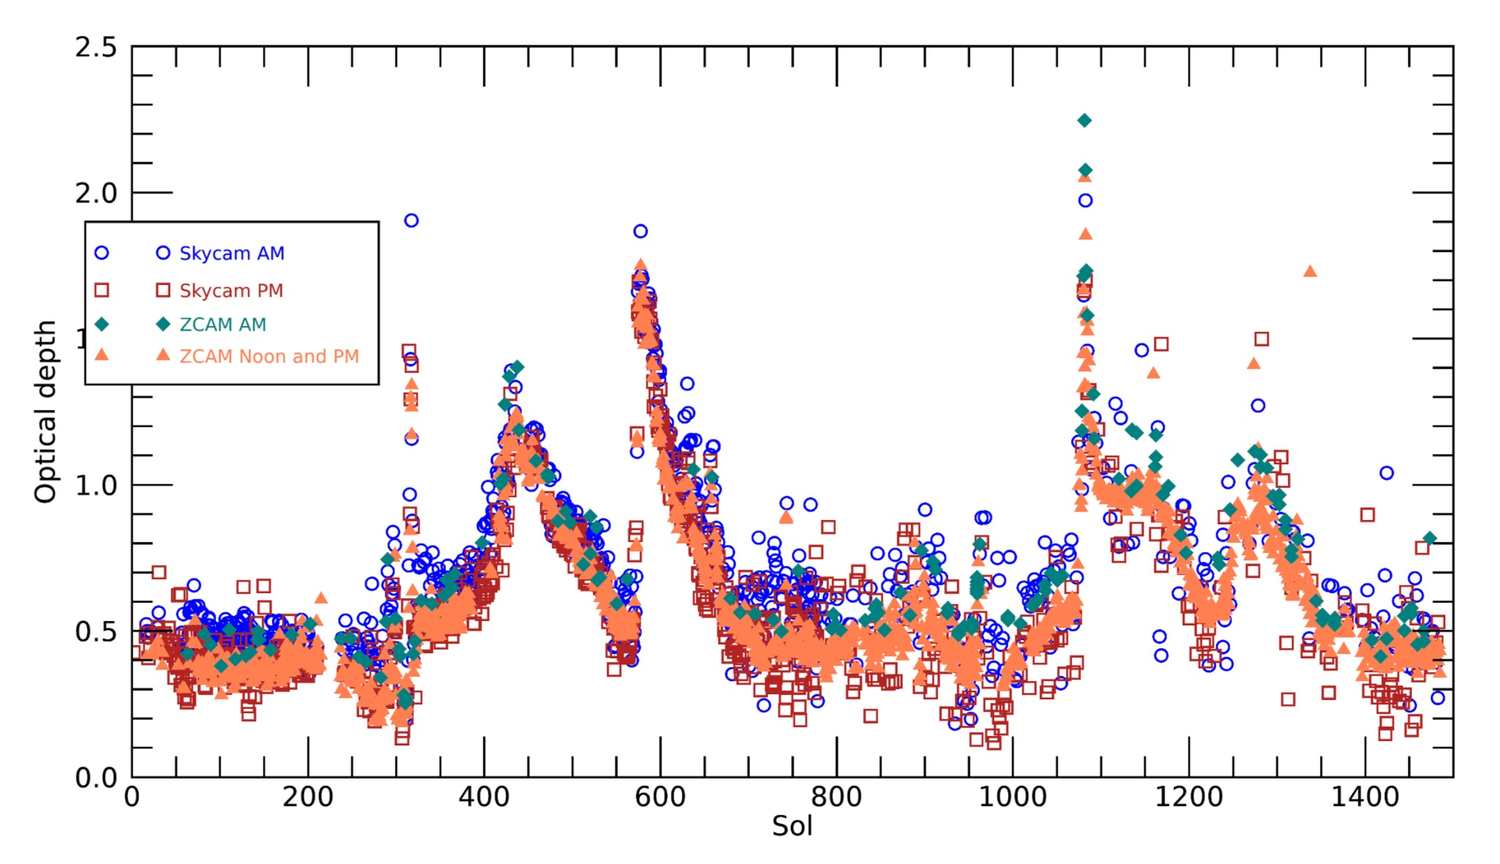
Figure 4. Aerosol opacity (dust + water ice) retrieved from SkyCam (0.691 µm) and ZCAM (0.88 µm), color-coded by acquisition time.
Fig. 5 shows the seasonal and interannual evolution of each surface energy budget term. Downwelling and reflected solar fluxes have been extended to the full solar range (0.19–5 mm) as described in [6]. The limited coverage of the downwelling solar flux and the sensible heat flux is due to the availability of the DCF, which has only been calculated through sol 1051 (Fig. 2, right), and to the availability of WS data. Similarly, the net heat flux into the ground has been computed only through sol 1051, based on the availability of dust-corrected downwelling solar fluxes. Daily minimum net heat flux values in MY 37 centered around Ls ~50° and 150° are caused by shadows affecting the RDS, which result in artificially low net heat flux values.
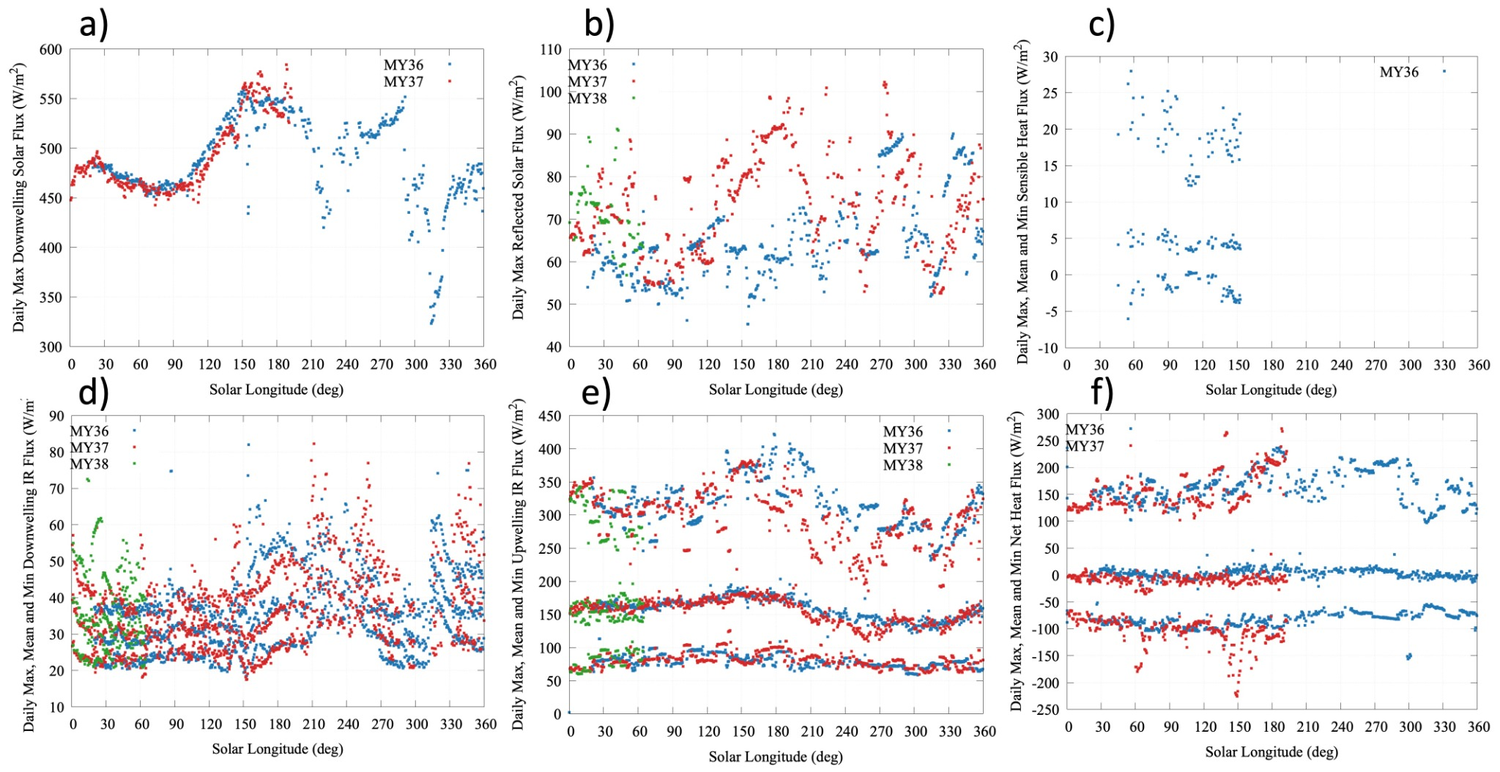
Figure 5. Surface energy budget at Jezero Crater through sol 1450. (a) Daily maximum downwelling solar flux (0.19–5 µm). (b) Daily maximum reflected solar flux (0.19–5 µm). (c) Daily maximum, mean, and minimum sensible heat flux. (d) Daily maximum, mean, and minimum downwelling longwave flux (5–80 µm). (e) Daily maximum, mean, and minimum upwelling longwave flux emitted by the surface (5–80 µm). (f) Daily maximum, mean, and minimum net heat flux.
Acknowledgments
This work has been funded by the Spanish MEC, through projects No. ESP2014-54256-C4-1-R and AYA2015- 65041-P; MCIU, No. ESP2016-79612-C3-1-R, ESP2016-80320-C2-1-R, RTI2018-098728-B-C31, RTI2018-099825-B-C31, MDM-2017-0737 and PID2021-126719OB-C41; INTA and CDTI.
References
[1] Rodríguez-Manfredi, J. A., et al. (2021). Space Sci. Rev., 217(3), 1–86. [2] Sebastián, E., et al. (2025), Acta Astronaut., 226, 791–802. [3] Vicente‐Retortillo, A., et al. (2024). Geophys. Res. Lett., 51, e2023GL107975. [4] Polkko, J., et al. (2023). J. Geophys. Res. Planets 128, e2022JE007447. [5] Bell, J. F., et al. (2021). Space Sci. Rev., 217, 24. [6] Martínez, G. M., et al. (2023). J. Geophys. Res. Planets, 128, e2022JE007537.
How to cite: Martinez, G., Manfredi, J. A., de la Torre-Juarez, M., Apéstigue, V., Gomez, F., Genzer, M., Harri, A.-M., Hieta, M., Hueso, R., Lemmon, M., McConnochie, T., Munguira, A., Newman, C., Pla-Garcia, J., Polkko, J., Sanchez-Lavega, A., Sebastian, E., Tamppari, L., Toledo, D., and Vicente-Retortillo, A.: MEDA on Mars 2020: Environmental Data and Sensor Insights through Sol 1450, EPSC-DPS Joint Meeting 2025, Helsinki, Finland, 7–13 Sep 2025, EPSC-DPS2025-1461, https://doi.org/10.5194/epsc-dps2025-1461, 2025.
Understanding Martian meteorology at the surface is essential for future robotic and human exploration. The Mars 2020 Perseverance rover has provided an unprecedented opportunity to analyze the atmospheric environment of Jezero crater through its onboard weather station, MEDA (Mars Environmental Dynamics Analyzer, [1]). Prior to landing, [2] and [3] presented a set of model-based predictions for atmospheric behavior at the landing site. The purpose was to guide mission operations and serve as a baseline for post-landing model validation using real data. This study represents the fulfillment of that goal, providing a detailed comparison between in situ observations and mesoscale model predictions on Mars.
We compare MEDA observations of pressure, air and ground temperature, and horizontal wind speed and direction with MRAMS simulations at high spatial and temporal resolution. Unlike previous efforts that focused on four seasonal snapshots (solstices and equinoxes), our study incorporates MRAMS simulations of full diurnal cycles every 30° of solar longitudes (Ls) across two full Martian years. This represents the highest frequency of mesoscale modeling ever conducted at high resolution (330 m horizontal grid spacing) on Mars, offering unprecedented insight into both seasonal and interannual variability.
A diurnal structure variation of the pressure throughout the year is shown both in modeling and observations. The diurnal pressure amplitude is generally well matched in the model. Pressure normalization techniques were applied to correct for model biases, leading to improved alignment with MEDA values.
The general shape of the diurnal cycle of surface temperature is similar between the two datasets. MRAMS surface properties are interpolated from TES-derived thermal inertia datasets, which lack the spatial resolution necessary to fully capture Jezero’s known heterogeneity. This limitation likely contributes to inaccuracies in the modeled diurnal temperature amplitude.
There is a good match in wind directions between MRAMS and MEDA in most cases, but MRAMS wind speeds are generally higher than those observed with MEDA, especially between 01:00 and dawn. Those wind speed differences could be so strong because the downslope winds penetrate a little bit too far into the crater for that time of sol when compared with other modeling predictions. It is also noticeable that the wind speeds are systematically very low after sunset both in MRAMS and MEDA, following the collapse of daytime convection, but then at 20:00 the wind speeds start to increase again both in modeling and observations.
This study extends the investigation of nighttime turbulence over two Martian years presented in [4], which showed that turbulence increases as the rover approaches the western rim of Jezero crater. This enhancement may be caused by wind shear originating from the passage of an atmospheric bore wave associated with downslope winds descending from the crater’s western rim.
Overall, the agreement between MEDA and MRAMS supports the use of high-resolution mesoscale modeling as a predictive and diagnostic tool for Mars surface meteorology, and justifies the use of the model results to investigate the broader meteorological environment of the Jezero crater region. These findings support ongoing efforts to refine mesoscale modeling approaches for Mars and highlight the value of MEDA in validating model outputs at unprecedented temporal resolution. The enhanced temporal frequency of simulations—combined with careful pressure normalization and detailed analysis—provides a robust validation framework. This work also highlights the need for improved surface property characterization to enhance model fidelity, particularly for thermal processes. These results are not only valuable for reconstructing the meteorological environment of Jezero crater during the Mars 2020 mission, but also for informing future landing site selection, engineering planning, and science operations in similar terrain.
References:
[1] Rodriguez-Manfredi, J. A., De la Torre Juárez, M., Alonso, A., Apéstigue, V., Arruego, I., Atienza, T., ... & MEDA team. (2021). The Mars Environmental Dynamics Analyzer, MEDA. A suite of environmental sensors for the Mars 2020 mission. Space science reviews, 217, 1-86.
[2] Pla-García, J., Rafkin, S. C., Martinez, G. M., Vicente-Retortillo, Á., Newman, C. E., Savijärvi, H., ... & Harri, A. M. (2020). Meteorological predictions for Mars 2020 Perseverance Rover landing site at Jezero crater. Space science reviews, 216(8), 148.
[3] Newman, C. E., de la Torre Juárez, M., Pla-García, J., Wilson, R. J., Lewis, S. R., Neary, L., ... & Rodriguez-Manfredi, J. A. (2021). Multi-model meteorological and aeolian predictions for Mars 2020 and the Jezero crater region. Space Science Reviews, 217, 1-68.
[4] Pla‐García, J., Munguira, A., Rafkin, S., Newman, C., Bertrand, T., Martínez, G., ... & Rodríguez‐Manfredi, J. A. (2023). Nocturnal turbulence at Jezero crater as determined from MEDA measurements and modeling. Journal of Geophysical Research: Planets, 128(8), e2022JE007607
How to cite: Pla-Garcia, J., Newman, C., and Rodríguez-Manfredi, J. A.: The meteo of Jezero crater as determined from MEDA observations and modeling, EPSC-DPS Joint Meeting 2025, Helsinki, Finland, 7–13 Sep 2025, EPSC-DPS2025-1003, https://doi.org/10.5194/epsc-dps2025-1003, 2025.
Aerosols on Mars are a primary element for studying the interaction between the solar radiation and the atmosphere and surface. Depending on properties such as aerosol number density, particle radius, or refractive index, the aerosols can provide positive or negative radiative feedbacks on the atmospheric dynamics. Previous studies have revealed large temporal and spatial variability in the aerosol optical properties, emphasizing the need for continuous monitoring throughout the day and at multiple locations. To address these measurements, the Radiation and Dust Sensor (RDS) [1] was included as part of the Mars Environmental Dynamics Analyzer (MEDA) [2] payload onboard the Perseverance rover of the Mars 2020 mission. The RDS instrument is composed of two sets of eight photodiodes (RDS-DP) and a sky-pointed camera (RDS-SkyCam). One set, oriented toward the zenith, captures radiation from 190 to 1200 nm, while the other, inclined 20° above the horizon at 45° azimuthal intervals, samples a single wavelength. The analysis of these observations, through a radiative transfer model [3], allows for the retrieval of key aerosol parameters such as aerosol opacity at different wavelengths (Figure 1) and particle radius (Figure 2). However, the continuous deposition of dust over the sensors [4], since the beginning of the mission, introduces modifications in their optical response. In particular, the zenith-pointed photodiodes require angular response calibration due to the progressive accumulation of dust on their optical surfaces. This calibration is essential to ensure the accuracy of aerosol property retrievals and the reliability of long-term atmospheric monitoring. Here, we present the ongoing development of our radiative transfer model for signal calibration, incorporating dust deposition corrections, along with preliminary results from the analysis of the initial sols of the Mars 2020 mission.
Figure 1. Retrieved aerosol optical depth at 650nm from sols 60 to 115, simulated using signals from MEDA-RDS TOPs 4, 5, 6, and 8 between 08:00–10:00 and 15:00–17:00 LTST.
Figure 2. Retrieved dust effective radius from sols 60 to 115, simulated using signals from MEDA-RDS TOPs 4, 5, 6, and 8 between 08:00–10:00 and 15:00–17:00 LTST.
[1] Apestigue, V., et al. “Radiation and Dust Sensor for Mars Environmental Dynamic Analyzer Onboard M2020 Rover”. Sensor 22.8 (2022): 2907.
[2] Rodriguez-Manfredi, Jose Antonio, et al. “The Mars Enviromental Dynamics Analyzer, MEDA. A suite of enviromental sensors for the Mars 2020 mission.”Space science reviews 217.3 (2021): 1-86.
[3] Toledo, D., et al. “Measurement of aerosol optical depth and sub-visual cloud detection using the optical depth sensor (ODS)”. Atmospheric Measurement Techniques 9.2 (2016): 455-467.
[4] Vicente-Retortillo, A., et al. “Dust Accumulation and Lifting at the Landing Site of the Mars 2020 Mssion, Jezero Crater, as Observed From MEDA.” Geophysical Research Letters 51 (2024).
How to cite: Rodriguez-Veloso, R., Toledo, D., Apestigue, V., Arruego, I., Lemmon, M. T., Smith, M. D., Martínez, G. M., Vicente-Retortillo, Á., Jiménez-Martín, J. J., García-Menéndez, E., Viudez-Moreiras, D., Sanchéz-Lavega, A., de la Torre-Juárez, M., and Rodríguez-Manfredi, J. A.: Aerosol optical properties observed by MEDA Radiation and Dust Sensor (RDS) at Jezero Crater, Mars, EPSC-DPS Joint Meeting 2025, Helsinki, Finland, 7–13 Sep 2025, EPSC-DPS2025-680, https://doi.org/10.5194/epsc-dps2025-680, 2025.
The MEDA instrument on Mars 2020 has been operating on the surface of Mars for more than 1500 sols obtaining measurements of pressure, temperature and other environmental properties with a fast cadence. Vortices and dust devils appear often in the MEDA measurements obtained by the pressure sensor and the Radiation and Dust Sensor (RDS) suite, and the vortex signature is some times present in other MEDA sensors, particularly on the Thermal and Infrared Sensor (TIRS). Current data covers a period of nearly 2 Martian years that allows a deep investigation of the properties of dust devils on the Jezero area. We identify the close approaches of vortices to the Perseverance rover from pressure drops measured with MEDA and identified by a search algorithm that uses a variety of time windows to find and characterize both short and long pressure drops [1, 2]. Some of these vortices are identified as dust devils from simultaneous or nearly simultaneous drops of light measured by the RDS Top sensor [3].
Seasonal variability repeats similarly over 2 Martian Years but interannual variability is also observed. Dust devil activity peaks over summer at Ls=150º-160º and strongly declines in the autumn to early winter season, especially during Martian Year 37 around sol 1200 of the mission. The inter-annual variability is linked to varying properties of the terrain over the traverse followed by Perseverance as it explores different terrains from the crater floor to the crater rim and the delta over an accumulated distance of 35 km. Some particularly intense events with pressure drops as deep as 7.7 Pa raise significant amounts of dust. The trajectory of these very strong dust devils can be studied by the RDS lateral sensors, thus, constraining the geometry of the encounter and the physical properties of the dust devil. A combined dataset of nearly 4,000 vortices and nearly 700 dust devils will be presented. For a small subset of events, we investigate ranges of models of drifting vortices that can fit the diameter and closest approach to the vortex encounter from the combination of pressure and RDS data.
References: [1] Newman et al. The dynamic atmospheric and aeolian environment of Jezero crater, Mars.Science Advances, 8, eabn3783 (2022) 25 May 2022, doi: 10.1126/sciadv.abn378 (2022). [2] Hueso et al. Convective vortices and dust devils detected and characterized by Mars 2020, Journal of Geophysical Research Planets, 128, e2022JE007516, https://doi.org/10.1029/2022JE007516 (2023). [3] Toledo et al. Dust devil frequency of occurrence and radiative effects at Jezero crater, Mars, as measured by MEDA Radiation and Dust Sensor (RDS) Journal of Geophysical Research: Planets, 128, e2022JE007494, doi: https://doi.org/10.1029/2022JE007494 (2023).
How to cite: Hueso, R., Newman, C., Toledo, D., Martínez, G., Munguira, A., Apéstigue, V., Vicente-Retortillo, Á., Sánchez-Lavega, A., and del Río-Gaztelurrutia, T.: An Updated Catalog of Vortices and Dust Devils on Jezero Crater, Mars from MEDA data, EPSC-DPS Joint Meeting 2025, Helsinki, Finland, 7–13 Sep 2025, EPSC-DPS2025-343, https://doi.org/10.5194/epsc-dps2025-343, 2025.
With the success of the Ingenuity helicopter onboard the Perseverance Rover, there is increased interest in exploring aerial vehicle concepts to assist with long-range reconnaissance and geological sampling on Mars [1]. Preliminary studies of more capable rotorcraft have suggested that such craft could carry science payloads of at least 2 to 5 kg at altitudes of at least 200 m along ranges of at least 1 to 5 km [2,3]. Clearly, such a vehicle could revolutionize our exploration of the martian surface.
However, a next generation rotorcraft could also revolutionize our understanding of the near-surface martian atmospheric planetary boundary layer (PBL). This layer is largely inaccessible to orbiters and landers, yet links the datasets obtained by both. Within this zone, dust is lifted and deposited, water ice sublimates and falls as snow, and gas-solid chemistry alters the mixture of trace gasses within the bulk atmosphere [4,5]. Furthermore, any gasses which vent from the subsurface will form a plume within this layer that is detectable at large distances, allowing such vents to be localized for follow-on in-situ exploration.
This presentation will therefore outline atmospheric science goals that could be accomplished from a rotorcraft [2,3]. These goals will be divided into four categories
Meteorology: Meteorological packages can be compact providing high-frequency in-situ data on atmospheric parameters (e.g. [6]) while generating relatively little data volume. The most advantageous parameters to measure would include (1) single or multi-axis measurements of wind speed and direction, e.g. from sonic anemometers, (2) temperature, (3) pressure, (4) relative humidity and (4) upwelling or downwelling radiometry in a variety of wavebands, e.g. by photovoltaic sensors.
These measurements could be used to improve numerical models of the atmosphere. Vertical profiles of meteorological parameters would be particularly useful. For instance, by determining the wind profile, friction velocities can be obtained which will inform studies of aeolian transport of materials in the near surface. Relative humidity as a function of height can be used to examine surface-atmosphere exchange of water. Pressure and temperature can be used to profile the cores of dust devils. Changes in upwelling and downwelling radiation as altitude changes provides information on atmospheric aerosol radiative properties.
Dust and Ice Cloud Aerosols: The rotorcraft will need a downward facing camera not just for reconnaissance but also to be able to position itself relative to the landscape. Previous spacecraft cameras have shown themselves to be adept at retrieving the optical depth of dust at different layers within the atmosphere [7] and by allowing the rotorcraft to vary its altitude, a full tomographic profile of atmospheric dust can be obtained. However, beyond imaging clouds and dust directly, more active sensing techniques could be considered. For instance, a lidar or small laser could induce backscattering from dust or ice aerosols, allowing low-altitude clouds, fog, or dust plumes/devils to be investigated in situ. A nephelometer [8] could be used to observe the scattering properties of the aerosols, obtaining particle size and shape as a function of altitude.
Trace Gasses and Fluxes: While many atmospheric gasses have been quantified from orbit, the processes that take place within the PBL prevent these gas concentrations from being directly compared to landed measurements and to subsurface fluxes. For instance, TGO is incapable of observing the methane that is regularly seen by the Curiosity rover at Gale Crater [9,10]. Somewhere between the rover and the airmass aloft being sampled by the orbiter, the gas is chemically transformed [4]. Furthermore, there are changes observed in oxygen (the fourth most abundant atmospheric species), carbon monoxide [5] and peroxide that are poorly explored over altitude, to say nothing of isotopic ratios within each chemical constituent.
Measuring bulk composition and trace gas composition require different instrumentation. However, no matter the species, a great deal about surface chemistry on Mars could be learned by creating profiles at different times of day and season. Advanced spectroscopic systems using techniques such as OA-ICOS [11] allow measurements of even trace gasses to be performed on the scale of minutes using instruments capable of being carried aloft. The most tantalizing possibility here is the ability to use the capabilities of the rotorcraft to detect and localize subsurface vents by tracing gas plumes in the PBL.
Aeolian and Geophysical Platform: Rotorcraft also permit an ideal vantage point from which to observe aeolian systems and to perform geophysical measurements. A rotorcraft can observe ripple forms and can conduct change detection of aeolian features through repeat observations at locations beyond a rover’s line-of-sight even over terrain that is inaccessible to rovers. Meanwhile, modern gravimeters may be able to help identify different types of subsurface geology, including deep deposits of aeolian sediments or dust/loess. Magnetic field sensors could add richness to these datasets and have been entirely unexplored at these geographic scales on Mars previously.
Conclusion: Just as the InSight Lander was targeted as a pathfinder to demystify the deep Martian interior, a PBL explorer could address significant scientific questions about the atmosphere of Mars today. Modern instrumentation can enrich the science return from such a rotorcraft at relatively little cost, given the compact nature of most atmospheric instrumentation.
References: [1] Wadhwa and Farley (2022) AGUFM abstract P56A-03 [2] Withrow-Maser et al (2020) ASCEND 2020 Conference https://doi.org/10.2514/6.2020-4029 [3] Johnson et al (2020) NASA/TM-2020-220485 [4] Korablev et al. (2021) Science Advances 7(7) doi: 10.1126/sciadv.abe4386 [5] Trainer, M.G. (2019) JGR: Planets v124 (11) pp. 3000-3024 doi: 10.1029/2016JE006175 [6] Gómez-Elvira et al (2012) SSR 170 pp 583-640 [7] Smith et al (2020) JGRE doi: 10.1029/2020JE006465 [8] Ragent et al. (1996) Science 272(5263) pp 854-856 [9] Webster et al. (2018) Science 360 pp. 1093-1096 doi: 10.1126/science.aaq0131 [10] Korablev et al. (2019) Nature 568 pp 517-520 [11] Walters et al (2024) Acta Astronautica doi: 10.1016/j.actaastro.2024.02.031
How to cite: Moores, J., Bischof, G., Axelrod, K., Innanen, A., Dong, E., Hayes, C., Markovich, M., Newton, A., and Marincic, I.: At the altitude where it happens: science goals for exploring the martian boundary layer with rotorcraft, EPSC-DPS Joint Meeting 2025, Helsinki, Finland, 7–13 Sep 2025, EPSC-DPS2025-47, https://doi.org/10.5194/epsc-dps2025-47, 2025.
Please decide on your access
Please use the buttons below to download the supplementary material or to visit the external website where the presentation is linked. Regarding the external link, please note that Copernicus Meetings cannot accept any liability for the content and the website you will visit.
Forward to presentation link
You are going to open an external link to the presentation as indicated by the authors. Copernicus Meetings cannot accept any liability for the content and the website you will visit.
We are sorry, but presentations are only available for users who registered for the conference. Thank you.
Human missions to Mars will require detailed knowledge of local meteorological conditions. Continuous measurement of winds in the vicinity of a landing site is needed to provide accurate local weather monitoring and forecasting, thus preparing future expeditions to safeguard against the operational impact of hazardous dust events. These measurements are also required to ensure compliance with COSPAR planetary protection requirements regarding potential contamination of ‘special regions’ within the human exploration zone through the atmospheric transport of contaminants from human activities.
Key to understanding this local-scale atmospheric transport will be obtaining accurate measurements of the 3-D wind vector, most likely through a network of landers equipped with meteorological instrumentation. Here we build on a prior ESA internal study on a Mars Weather Network Mission to present an analysis of wind variability and reconstruction across six test-case landing sites - Chryse Planitia, Gusev and Schiaparelli craters, Mesopotamia, Mawrth Vallis and Hypanis Vallis - which have been proposed as future human exploration zones.
Local winds were simulated using the Laboratoire de Météorologie Dynamique Mars Mesoscale Model (Figure 1). An Empirical Orthogonal Function analysis was then performed, which decomposed the near-surface wind into orthogonal spatial patterns (EOFs). We found that the first 4 EOFs captured between 70-90% of wind variability at most sites.
By simulating continuous wind measurements from a network of four landers, we then calculated reconstructions of both the horizontal near-surface wind field as well as the full 3-D wind field for the first five kilometres above the surface. We found that Hypanis Vallis and Mesopotamia were the sites with the lowest reconstruction errors, and that reconstruction was poorer at sites with greater topographic variation such as the Gusev and Schiaparelli craters.
Our results provide the first quantification of wind field reconstruction error for meteorological monitoring using a network of landers on the Martian surface and therefore constitute a useful benchmark for future work.
Figure 1 - Sample simulation output of the 3-D wind field at Chryse Planitia. The wind field has been visualised by initialising 1,000 particles at random locations, then using a Lagrangian trajectory algorithm to calculate how the particles are advected by the wind field. Particles are coloured by wind speed.
How to cite: Rajendran, K., Holmes, J. A., Patel, M. R., Parfitt, C. E., Paardekooper, D., Ball, A. J., Svedhem, H., and Wilson, C. F.: Reconstructing martian winds at potential future landing sites with a regional lander network, EPSC-DPS Joint Meeting 2025, Helsinki, Finland, 7–13 Sep 2025, EPSC-DPS2025-715, https://doi.org/10.5194/epsc-dps2025-715, 2025.
Introduction
Dust deposition poses the challenges to the survival of instruments and solar-powered missions on Mars [1, 2]. Zhurong in-situ observations provide an opportunity to study dust dynamics. Here, we present the dust evolution at the Zhurong landing site by means of the deposited optical depth on the Multispectral Camera (MSCam) calibration target and dust factor measured by the solar panels.
In-situ observation
MSCam calibration target observation: the deposited dust would modify the reflectance properties of the MSCam calibration target. A dust correction model based on the two-layer radiative transfer model [3, 4] is applied to estimate the dust deposited optical depth on the MSCam calibration targets.
Solar panel observation: the progressive deposition of dust can also decline the solar panel current output. We calculate the dust factor, indicating the ratio of the measured power output to that of an array without any dust [5], to measure the dust accumulation on the rover.
Results and discussion
The dust deposited optical depths on the MSCam calibration target are very low for the first 110 sols (Fig. 1a), suggesting that there is almost no dust deposited on the calibration target or the deposited dust is too thin to modify the reflectance of the calibration targets. After the solar conjunction, dust starts to accumulate on the calibration target with a deposition rate of 0.12%-0.19% per sol. The dust factor derived from the solar panel exhibits a similar trend with the observation from the MSCam calibration target (Fig. 1b). The dust factor shows a relatively slow decrease for the first 200 sols with an exponential decay of 0.07% per sol but a severe decline after Sol 200 with a rate of 0.46% per sol .
The two separate observations reveal two distinct dust deposition stages at the Zhurong landing site: very slow dust deposition for the initial 200 sols, then followed by a significant acceleration in dust deposition rate after Sol 200. The increasing deposited optical depth and declining dust factor also suggest the lack of dust cleaning events during the 300 sols’ traverse.
Fig. 1 (a) The deposited optical depth on the MSCam calibration target as a function of time [6]. (b) dust factor derived from solar panels as a function of time [7]. The two vertical gray dashed lines represent the last MSCam observation before the solar conjunction and first observation after the solar conjunction, respectively. The black lines are dust factor exponential decline of two different stages, and the black dashed line shows a 0.18% per sol exponential decline of the first 300 sols observations.
References. [1] Landis, G. A. (1996). Acta Astronautica, 38(11), 885-891. [2] Johnson, J. R., et al. (2003). Icarus, 163(2), 330-346. [3] Johnson, J. R., et al. (2006). JGR: Planets, 111(E12). [4] Kinch, K. M., et al. (2015). ESS, 2(5), 144-172. [5] Lorenz, R. D., et al. (2021). PSS, 207, 105337. [6] Zhang, Q., et al. (2023). GRL, 50(13). [7] Zhang, Q., and Liu, J. (2025). Quaternary Sciences, 45(4).
How to cite: Zhang, Q. and Liu, J.: Dust deposition and lifting at the Zhurong landing site, EPSC-DPS Joint Meeting 2025, Helsinki, Finland, 7–13 Sep 2025, EPSC-DPS2025-1270, https://doi.org/10.5194/epsc-dps2025-1270, 2025.
Introduction
The solar-powered ESA ExoMars Rosalind Franklin (EMRF) rover will land in Oxia Planum in 2030. Given the importance of dust-lifting events in clearing solar panels for energy production on previous in situ missions [e.g. 1,2], it is vital to understand the likely frequency of such events at Oxia Planum. A global machine learning study found “3 small and 3 large” dust devils in the Oxia region over 8 Mars years [Conway, 2025]; of these dust devils, only one intersects the landing ellipses for the EMRF rover. Our earlier study in Oxia Planum found 2 active dust devils in a single High Resolution Stereo Camera (HRSC, [3]) image, and 4 active dust devils using a ratio of 2 Context Camera (CTX, [4]) images [5]. The aim of this study is to expand previous studies to identify active dust devils in Oxia Planum using all available orbital data, to determine the spatial and temporal distribution of possible dust lifting events in the landing site for the EMRF rover.
Data
Our analysis covers the time period May 2006 to April 2024, corresponding to Mars Years 28 to 37. Our study uses visible wavelength image data from instruments on three different spacecraft: HRSC on Mars Express, CTX (49 images) and High Resolution Imaging Science Experiment (HiRISE, [6]) on Mars Reconnaissance Orbiter, and Colour and Stereo Surface Imaging System (CaSSIS, [7]) on Trace Gas Orbiter.
The main study site was selected on the basis of maximizing the temporal range available for identifying dust devils in a representative part of the EMRF landing site. As such, our study focuses on the center of the landing ellipses, and contains the majority (69%) of the 1s landing ellipses as positioned at the time of this study. In addition, we used the InSight mission landing site as an area to test our methods in the same time periods used in a previous study using higher spatial resolution data [8].
Method
The main novelty in our approach is the rigorous coregistration, and, through the use of a stereo Digital Terrain Model (DTM), orthorectification of many overlapping CTX images. At the main Oxia study site, we produced 49 co-registered CTX orthoimages. At the InSight test site we produced 2 co-registered CTX orthoimages. We first identified changes between orthoimages by creating image ratios. Additional dust devils were also identified using an image ‘flicker’ approach. At Oxia Planum, we searched HRSC (11 images), CaSSIS (37 images), and HiRISE (50 images) image data for the presence of active dust devils. For HRSC and CaSSIS, we manually georeferenced images to our CTX orthoimages, and exploited the multispectral capabilities to help identify any active dust devils (e.g. [e.g. 9, 10]). For HiRISE, we used stereo pair anaglyphs to look for evidence of change between images. Although our main goal throughout the study was to identify the presence of active dust devils, we also traced changing surface albedo features that correspond to dust devil tracks and/or wind streaks when possible [e.g. 5, 8].
Results
We identified a total of 37 active dust devils in the Oxia Planum study area. Of these dust devils, 32 were in CTX images, and 5 in HRSC images. We did not identify any active dust devils in our Oxia Planum study site in CaSSIS or HiRISE images. Dust devil diameters range from 30 to 200 m, with a mean and standard deviation of 110 and 48 m respectively. The velocity of dust devils identified in HRSC images ranged from 10 to 23 ms-1, and were moving in roughly NE or SE directions. Dust devil activity in Oxia Planum was concentrated in two seasonal periods, peaking at both Ls ~ 15° and 180°. Peak activity occurred in Mars Year (MY) 33 and 36, with 13 and 14 dust devils respectively. We identified almost 800 new dust devil tracks across 2 different time periods, which had mean directions of 92° and 94°, and median lengths of 1.9 and 1.8 km.
Figure 1. Examples of active dust devils identified in Oxia Planum in CTX images.
Implications
Using the mean dust devil diameters, and all track lengths from 2 different time periods, we can estimate the formation rate of dust devils in Oxia Planum. Inverting this formation rate gives us the clearing interval, as calculated at other landing sites on Mars [e.g. 11]. We estimate solar panel clearing intervals for the EMRF rover of 3708 to 4218 sols. For comparison, Spirit experienced a solar panel clearing interval of 100 – 700 sols [1].
References: [1] Lorenz R.D. & D. Reiss (2015) Icarus, 248,162-164. [2] Lorenz R.D. et al. (2021) PSS 207, 105337. [3] Jaumann R. et al. (2007) PSS 55, 928-952. [4] Malin M.C. et al. (2007) JGR 112, E05S04. [5] Favaro E.A. et al. (2021) JGR 126, 2020JE006723. [6] McEwen A.S. et al. (2007) JGR 112, E05S02. [7] Thomas N. et al. (2017) Space Sci. Rev. 212, 1897-1944. [8] Perrin C. et al. (2020) GRL 47, e2020GL087234. [9] Stanzel C. et al. (2006) GRL 33, L11202. [10] Rangarajan V.G. et al. (2023) Icarus 394, 115443. [11] Reiss D. & R.D. Lorenz (2016) Icarus 266, 315-330.
How to cite: Grindrod, P., Favaro, E. A., Balme, M., and Patel, M.: Long-Term Orbital Monitoring of Oxia Planum, Mars: Active Dust Devils at the ExoMars Rosalind Franklin Rover Landing Site, EPSC-DPS Joint Meeting 2025, Helsinki, Finland, 7–13 Sep 2025, EPSC-DPS2025-128, https://doi.org/10.5194/epsc-dps2025-128, 2025.
Aeolian Landforms in the ExoMars 2028 Landing Site
Intro & Methods
ESA’s ExoMars Rosalind Franklin Mission will land a rover at Oxia Planum to search for signs of life on Mars [1, 2]. Bright bedforms (Transverse Aeolian Ridges [TARs]), and erosive wind-formed ridges (Periodic Bedrock Ridges [PBRs]) have been documented in the landing site [3-6]. In this study, we compare automated and manual mapping of aeolian features in CTX (6 m/pixel), CaSSIS (5 m/pixel) and HiRISE (25 cm/pixel) images in the landing site with sand fluxes from the NASA Ames GCM [7] obtained with the Martian Surface/Atmosphere Web Interface [8]. In particular, we focus our attention on bright bedforms, ridges and wind streaks. Since these features are widespread on Mars, the observations made here on ridge and bedform are also relevant to other areas and landing sites [9-13].
Results
Different aeolian features are observed in the landing area thanks to the new automatic mapping methodology employed in this work (Fig. 1a). Wind streaks (n = 87) were manually mapped on the CTX image mosaic [15] in a GIS environment. Most of the mapped streaks are bright-toned (n = 85), indicating winds originating from the NNW–NNE (Fig. 1b, c). A few dark-toned streaks (n = 2), formed by winds from the E–ESE, were also identified. Bright bedforms (TARs) were automatically mapped within the study area using the method described in [16]. They are widespread, especially in the SE, suggesting a higher sand supply and availability. Ridges (PBRs) were automatically mapped as well (Fig. 1a). These features are bright-toned as they are directly carved into the clay-enriched Noachain bedrock [4-6]. Together with the bright-toned ridge set, here we identified a new class of WNW–ESE-oriented cratered ridges (Fig. 1d). These features are mostly located in the NW of the study area but can also be found elsewhere. Theses sets of ridges display Y-junctions, can be found inside degraded impact craters, and may be locally covered by boulders from nearby impacts [4]. However, unlike PBRs, they are not directly carved into the underlying bedrock (Fig. 1d).
Discussion
The consistent orientation of bright wind streaks in the study area suggests contemporary regional winds predominantly blowing from the north, corresponding to the return flows of the Hadley cell circulation [17]. We also identified a secondary mode formed by winds from the ESE. Interestingly, a bimodal sand flux direction is also predicted by the GCM (Fig. 1e), with one mode (~172°–188°) closely matching the observed bright-toned wind streak orientations (Fig. 1b, c). This, along with no observed changes in orientation or modification of the bright streaks, indicates that these winds continue to blow at the surface and/or that winds from other directions are not strong or frequent enough to rework the wind streaks.
Bright bedforms (TARs) are likely relict or static features shaped by past wind conditions [4, 5]. This is supported by the GCM-predicted bedform orientation (red line in Fig. 1e), which does not align with either the observed TARs’ orientation or that of the older periodic bedrock ridges (PBRs) [4-6].
The newly segmented “Ridge 2” class of landform has previously been interpreted as precursor bedforms that initiated the formation of the underlying PBRs [4]. This interpretation is supported by (1) the close spatial association between PBRs and the “ridge 2” class, and (2) their similar orientation. However, in the example shown in Fig. 2, the ridges are located on a flat bedrock surface and are not associated with PBRs. The morphology of the “Ridge 2” class varies across the study area, with some ridges appearing subdued and eroded making them similar to ghost-dune pits [18]. Alternatively, such a relationship between positive and subdued morphologies might represent an assemblage of erosional scars and bedforms, similar to those observed at Meridiani Planum (see Fig. 6b in [10]). In this scenario, ridges are thought to have migrated southwest, leaving behind erosional scars.
Detailed examination of the relationships among ridges and TARs by the RFM rover will be crucial for advancing our understanding of ridges and PBR formation mechanisms [19, 20], the winds responsible for shaping TARs, and broader Martian climatic changes [9, 10].
Figure 1: (a) Automatically mapped ridges and TARs within the study area. (b, c) Wind streak in the landing area (CaSSIS RGB image MY35_007623_019_0). (d) WNW-ESE ridge 2 inside an eroded impact crater (HiRISE ESP_062481_1985). (e) GCM output at 18.2°N, 24.3°W. RDD = resultant drift direction [21]. Red line = predicted orientation (bed-instability mode) [22, 23]. "Finger direction" (fingering mode) [23].
References
[1] Vago J. et al. (2017). Astrobiology, 17. [2] Quantin et al. (2021), Astrobiology, 21. [3] Balme M. et al. (2017), PSS, 153, 39-53. [4] Silvestro S. et al. (2021), GRL, 48. [5] Favaro E. et al. (2021), JGR, 126. [6] Favaro E. et al. (2024), EPSL, 626. [7] Haberle R.M. et al. (2003), Icarus, 161. [8] Grasso F.M. et al. (2025), this issue. [9] Golombek M. et al. (2010), JGR, 115, 1-34. [10] Fenton L.K. et al. (2018), JGR, 123, 1–15. [11] Stack K.M. et al. (2022), JGR, 127, e2021JE007096. [12] Sullivan et al. (2022), 53rd LPSC, 2887. [13] Lu Y. et al. 2022, EPSL, 595, 117785. [14] Gou S. et al. 2022, EPSL, 595, 117764. [15] Fawdon et al. (2024), Journal of Maps, 20(1), 2302361. [16] Vaz D.A. et al. (2023), EPSL, 614. [17] Greeley et al. (1993), JGR, 98, E2, 3183-3196. [18] Day M.D. & Catling D.C. (2018), JGR, 123. [19] Montgomery D.R. et al. (2012), JGR, 117, E03005. [20] Hugenholtz C.H. et al. (2015), Aeol. Res., 18, 135–144. [21] Fryberger S.G. & Dean G. (1979), USGS prof. paper, 1052. [22] Rubin D.M. & Hunter R.E. (1987), Science, 237. [23] du Pont S.C. et al. (2014), Geology, 42.
Acknowledgement: The results were obtained in the context of the Earth-Moon-Mars (EMM) project (INAF/ASI & CNR), funded under the National Recovery and Resilience Plan, Mission 4, Component 2, Investment 3.1: “Fund for the realisation of an integrated system of research and innovation infrastructures" Action 3.1.1, NextGenerationEU.
How to cite: Silvestro, S., Vaz, D. A., Grasso, F. M., Rizza, U., Fenton, L., Pacifici, A., Tirsch, D., Favaro, E., Tao, Y., Salese, F., Popa, C., Franzese, G., Mongelluzzo, G., Porto, C., Pajola, M., and Esposito, F.: Aeolian Landforms in the ExoMars 2028 Landing Site, EPSC-DPS Joint Meeting 2025, Helsinki, Finland, 7–13 Sep 2025, EPSC-DPS2025-53, https://doi.org/10.5194/epsc-dps2025-53, 2025.
Oxia Planum is the chosen landing site for the European Space Agency’s ExoMars Rosalind Franklin rover mission for its evidence of multi-episodic sustained aqueous activity and astrobiological potential[1,2]. Previous works have aimed to characterise various mineralogical and morphological units present in Oxia Planum. Two distinct clay-bearing units have been identified based on spectral and morphological variations: an orange and a blue unit [2,3]. The blue unit stratigraphically overlies the orange unit, and while they are similar texturally, they exhibit some subtle textural as well as spectral differences from one another.Compositionally, the orange unit is associated with the strongest clay signatures, while the blue unit appears to be consistent with a clay signature mixed with a mafic component[2,3]. Several hypotheses have been proposed to explain their formation, including pedogenesis, groundwater alteration, and subaqueous sedimentation of either authigenic or clastic nature[3]. However, these scenarios need to be further constrained and may also need to be further expanded to include clay formation under less warm and wet conditions on early Mars [4]. Impact craters serve as windows into the subsurface by excavating, uplifting, and exposing materials that may not be visible at the surface. In this study, we use impact craters to investigate local and regional variations in the stratigraphy of Oxia Planum.
Methods: We characterized the colour/spectral characteristics of exposed layers within a ~1.5- and a ~2.1-km crater and compared them with units on the basin floor (stars in Fig. 1). Here we use DS-corrected [8-10] multispectral data from the 3-band High Resolution Imaging Science Experiment (HiRISE) (50-60 cm/px) [11], the 4-band Colour and Stereo Surface Imaging System (CaSSIS) (4 m/px) [12], and the hyperspectral Compact Reconnaissance Imaging Spectrometer for Mars (CRISM) (20 m/px) [13]. CRISM is no longer operational, and the data is limited, while CaSSIS and HiRISE effectively extend the detailed spectral information from CRISM across the region. By identifying specific mineral phases with CRISM and then spectrally resampling them to CaSSIS and HiRISE, we establish a method to extensively map mineralogical units.
Representative orange and blue unit CRISM spectra (FRTs 9A16 & 810D) were collected from sites 1,3 and 4 (Fig. 1) and resampled to the responses of CaSSIS for direct comparisons with image-derived CaSSIS and HiRISE spectra [14,15].
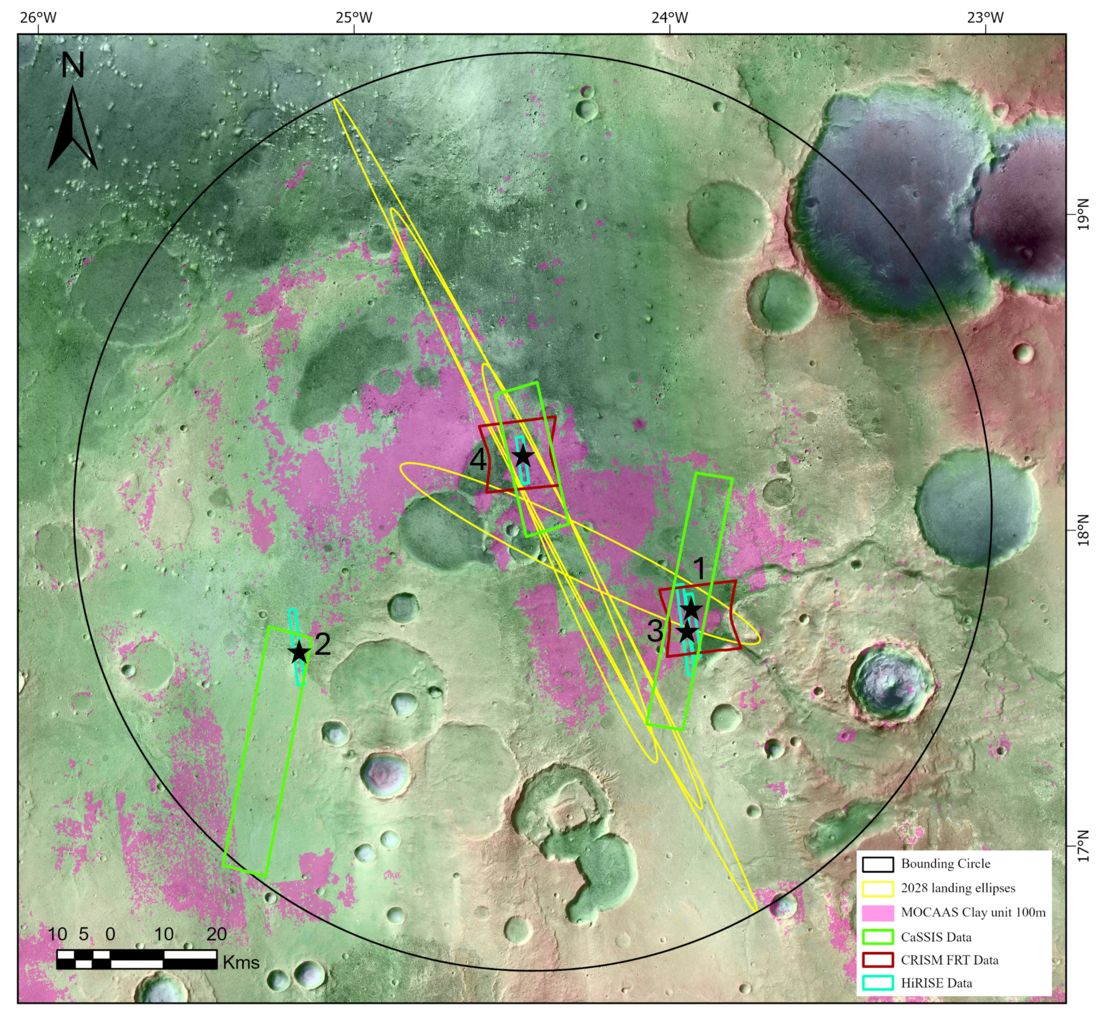
Fig. 1. HRSC-MOLA overlain on CTX and with a spectral map of clay detections in magenta[16]. The latest 2028 landing ellipses (yellow) and bounding circle (black) are shown. Black stars indicate the locations of craters (1 & 2) and basin floor (3 & 4) for spectral analysis.
Results and Discussion: Previous mapping [5], reveals as many as 7 orange and 5 blue layers to date (location 2) (Fig. 2). Crater rim formation is a complicated process with the possibility of an overturned strata. However, any overturned flap would be limited to the uppermost section of the crater wall.
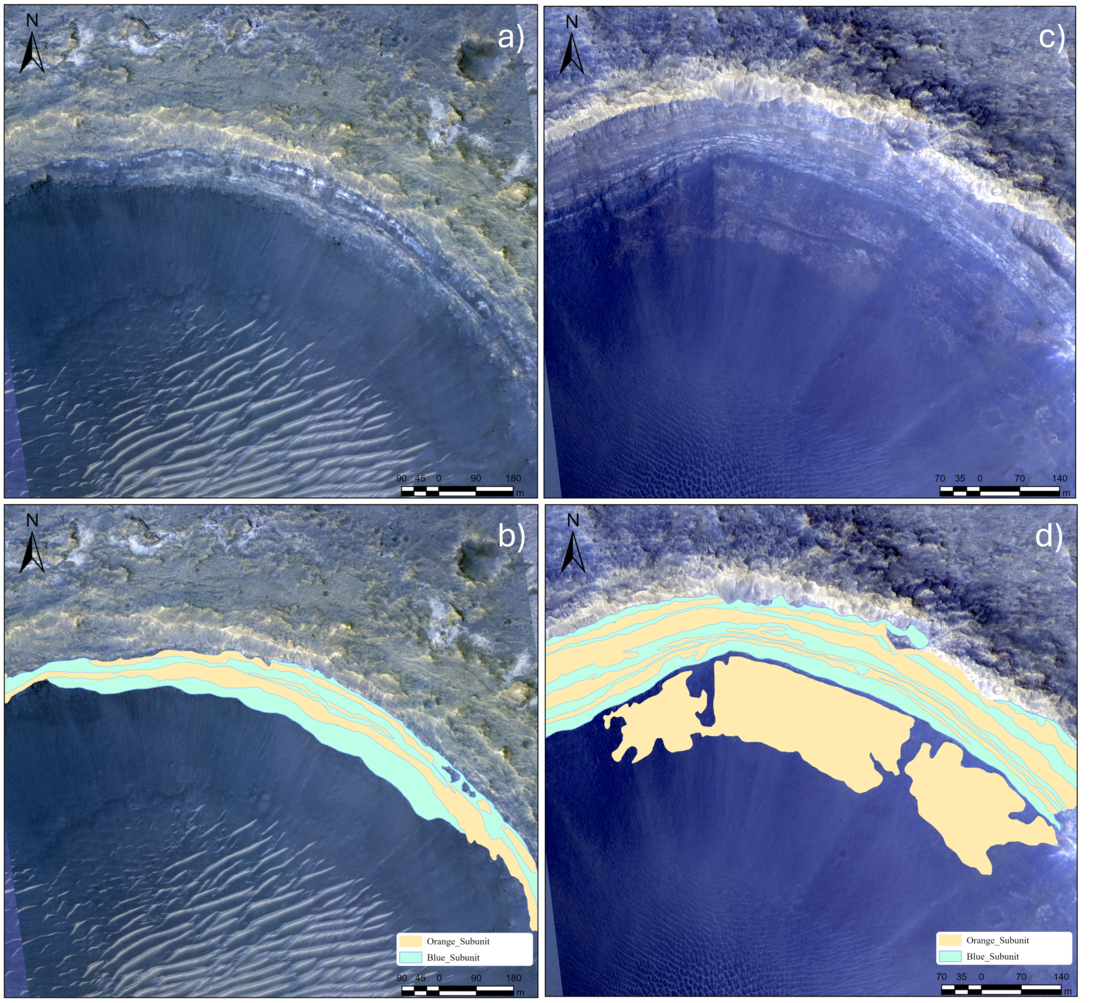
Fig. 2 Crater wall exposures. (a), (b) HiRISE IRB ESP_073652_1980 location #1 with mapped units; (c), (d) HiRISE IRB ESP_077041_1980 location #2 with mapped units.
The presence of multiple alternating layers raises questions about their origin—whether they represent the same or different units—and how these materials have evolved over time. Our spectral results show overall consistency in spectral shape between the three datasets, despite differences in their spectral and spatial resolution.
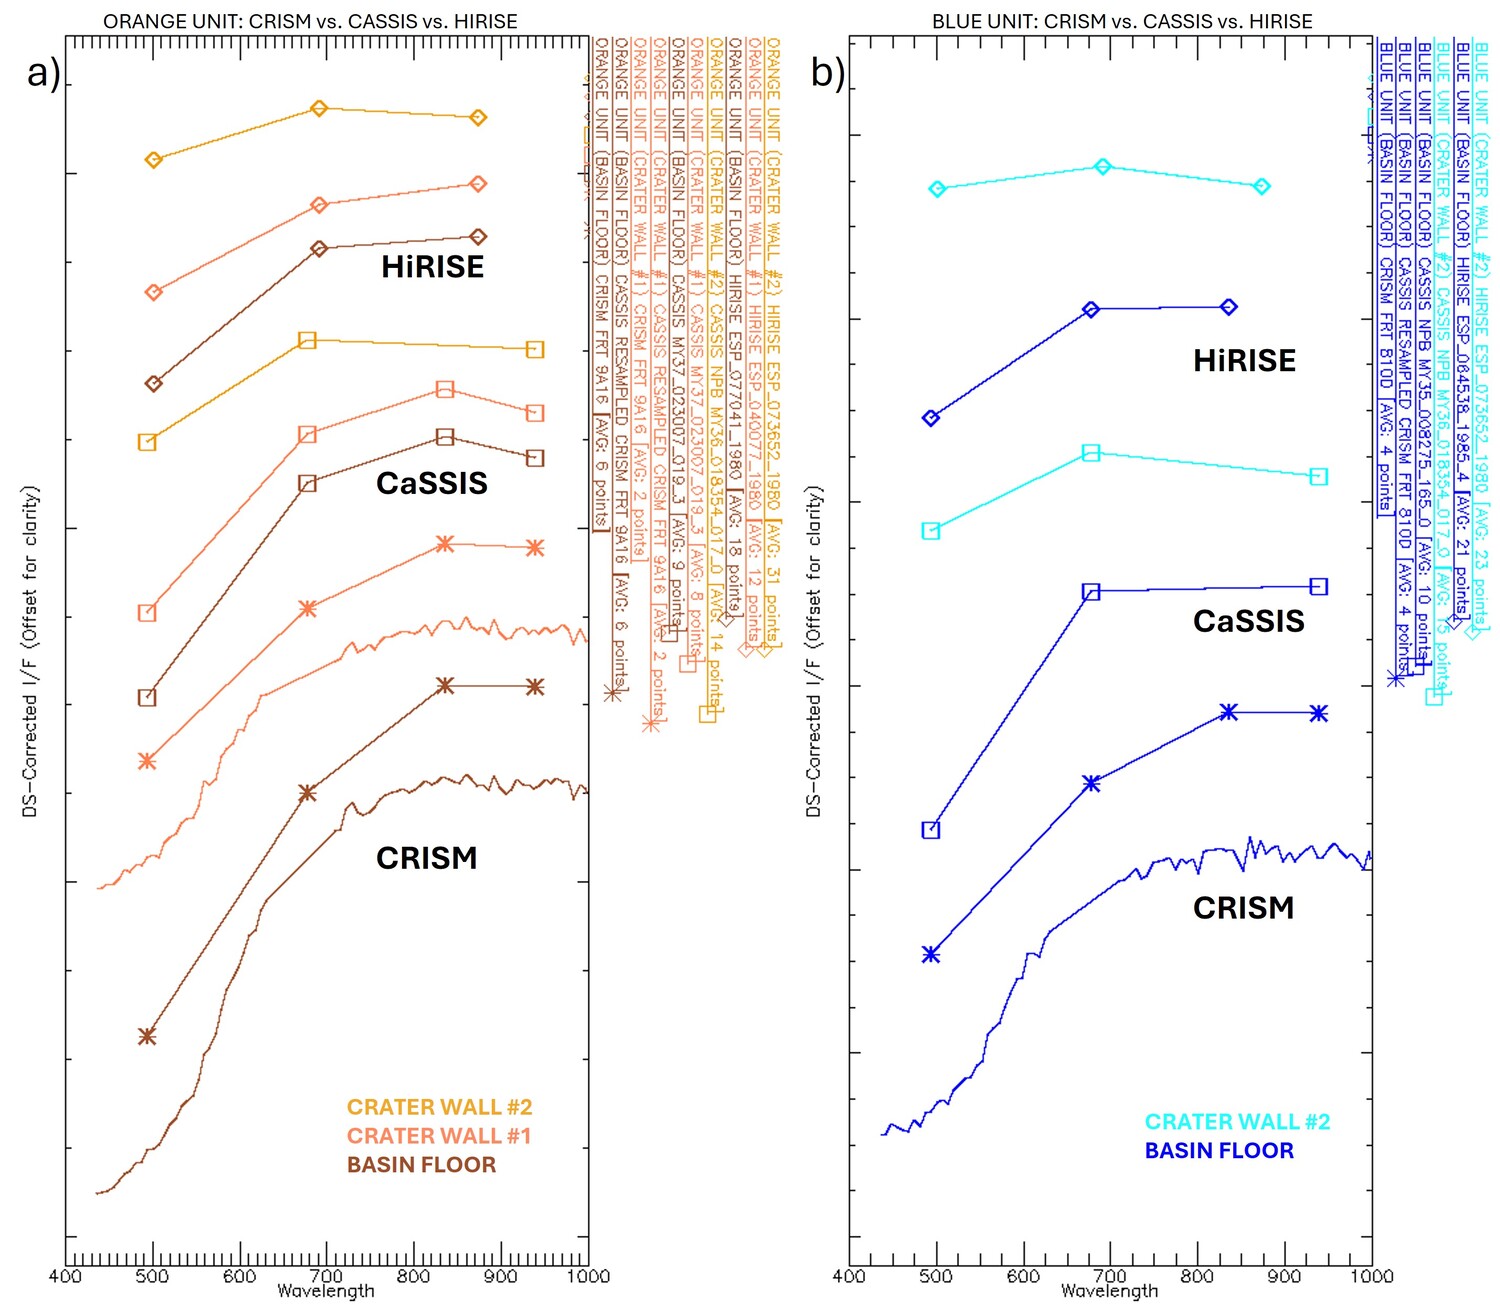
Fig. 3. Comparisons of DS-corrected CRISM (solid lines), CRISM resampled to CaSSIS (asterisk), CaSSIS (squares), and HiRISE (diamonds) spectra of the (a) orange unit and (b) blue unit from crater walls #1 and #2 and basin floor #3 and #4.
We compared the orange and blue units present in the basin floor (#3 & #4) and the crater walls (#1 & #2). The spectra show generally consistent nature of the units in the VNIR wavelengths. Contrary to the reported olivine component in the blue unit, the 810D spectra do not show any significant deflections towards the IR (#4; Fig. 3) [3]. Similarly, the blue unit lacks an IR deflection at ~950 nm in CaSSIS and HiRISE. It has a striking similarity with the orange unit which warrants further investigation. Due to the coarse resolution and limited coverage of CRISM, we could not extract a representative spectrum for the blue unit from the crater walls.
Well-exposed craters at lower elevations expose thicker units than ones at higher elevations (Fig. 3). These observations provide further constraints on the origin of the clays and favour a formation by erosion-transport-deposition sourced from the adjacent Noachian highlands, transported through valley systems, and eventually deposited in Oxia Planum [5].
We observe multiple alternating orange and blue units in craters across the Oxia Planum regionthat vary in number and thickness as a function of the location and local elevation [5,6], which differs from previous reports of one blue unit atop a singular orange one [2,3,7]. By further establishing a correlation between the number and thickness of these units as a function of location and elevation, we intend to reconstruct the clay-associated stratigraphy of Oxia. This would provide further insights into the provenance and origin of the clay units of the Oxia basin and the surrounding region.
References: [1] Vago J. L. et al. (2017) Astrobiology, 17 (6-7), 471-510. [2] Quantin-Nataf C. et al. (2021) Astrobiology, 21(3), 345-366. [3] Mandon L. et al. (2020) Astrobiology, 21(4), 464-480. [4] Tornabene L. L. et al. (2013) JGR: Planets, 118, 994–1012. [5] Srivastava et al. (2024) Xth Mars, 3233. [6] Srivastava et al. (2025) 56th LPSC, 1798. [7] Parkes – Bowen A. et al. (2022) PSS, 214. [8] Tornabene L. L. et al. (2018) Space Sci. Rev., 214. [9] Rangarajan V. G. et al. (2023) Icarus, 115849. [10] Tornabene L. L. et al. (2023) LPSC 54, p.2727. [11] McEwen A. S. et al. (2007) JGR: Planets, 112(E5), E05S02. [12] Thomas N. et al. (2017) Space Sci Rev, 212. [13] Murchie S. et al. (2007) JGR, 112, E05S03. [14] Tornabene L. L. et al. (2024) Xth Mars, 3318. [15] Tornabene et al. (2025) EPSC. [16] Carter et al. (2023) Icarus, 115164.
How to cite: Srivastava, A., Tornabene, L., Osinski, G., Caudill, C., Rangarajan, V. G., Fawdon, P., McNeil, J., Grindrod, P., Hauber, E., Davis, J., and Pajola, M.: Multi-scale Spectral Characterization of Clay-Rich Crater Walls in Oxia Planum, EPSC-DPS Joint Meeting 2025, Helsinki, Finland, 7–13 Sep 2025, EPSC-DPS2025-1001, https://doi.org/10.5194/epsc-dps2025-1001, 2025.
Introduction
The search for life is a key driver of Mars exploration, yet the detection of organic compounds on Mars remains sparse. High UV and ionizing radiation levels near the surface destroy organic compounds, leading to an underground search such as that planned for the Rosalind Franklin rover’s 2 m drill. Strong oxidizing agents have been suggested to explain conflicting Viking experiments’ non-detection results, adding further stress to any organic compounds. Such agents have since been identified in the form of perchlorate [ClO4-] salts in the martian regolith (Hecht et al. 2009). Nevertheless, small amounts of organic matter have been identified at the near surface in Gale crater on Mars with the Sample Analysis at Mars (SAM) instrument package on the Curiosity rover (e.g. Freissinet et al. 2025). However, it remains unclear whether these compounds formed on Mars or whether they are remnants of meteorite input. To tighten constraints on this assessment, we need to understand how the meteorite organic inventory evolves once it is exposed to the martian environment. Here we reacted organic compounds from a carbonaceous chondrite with perchlorate salts at levels measured in the martian regolith and analyzed the organic compounds before and after reaction with a non-targeted Liquid Chromatography Mass Spectrometry (LC-MS) metabolomics approach.
Materials and Methods
Crushed samples of the carbonaceous CM2 chondrite Jbilet Winselwan (JW) were exposed to magnesium perchlorate salts. This meteorite was found in the Western Sahara in 2013 and contains ~2 wt% organics. Measured amounts of perchlorate at the Phoenix landing sites are about 20 times the estimated amount of organic matter from meteorite input. The crushed meteorite samples were exposed to 1x, 20x and 100x perchlorate anion concentration treatments, meaning that the 20x treatment reflects the concentration on Mars. All experiments were conducted under anoxic conditions. Organics were then extracted with a series of non-polar to polar solvents and analysed with Hydrophilic Interaction Liquid Chromatography (HILIC) followed by mass spectrometry using an Orbitrap mass analyzer. Data was processed using MetaboAnalyst v6.0 (Scheltema et al. 2011; Smith et al.2006; Pang et al. 2024).
Results and Discussion
A Principal Component Analysis (PCA) was conducted on the LC-MS data to evaluate the effects of progressive perchlorate treatment on the JW meteorite organic inventory. The first two principal components account for 73.9% of the variance in the dataset (PC1: 59.5%, PC2: 14.4%). The trend in PC1 (Figure 1) reflects the treatment gradient across the experiment, with a vertical trend visible from untreated to 100x perchlorate treatment. In contrast, PC2 (14.4%) does not follow a linear pattern, with the 20x perchlorate treatment exhibiting positive loadings and the 100x exhibiting negative loadings, while untreated meteorite and 1x clustered around a loading of zero. We are investigating the possible causes for the organic distribution in 20X being so distinct from the 100X along the PC2 axis - particularly since the 20X concentration matches that of Mars - and will present the results of this work at the meeting.
Additionally we created a clustered heat map of the top 75 most abundant compounds in the perchlorate treatment experiment (Figure 2). The heatmap shows compounds behave differently when the meteorite is subjected to increased perchlorate treatment. Many compounds are resistant to smaller or moderate (20x) perchlorate treatments but are destroyed with 100x treatments. However, there are many compounds which increase in concentration with increased perchlorate treatment. This could be either liberation of compounds from macromolecule material or mineral matrix, or new compounds generated by in situ reactions during the course of the experiment. This result requires further investigation.
Conclusions
Our results indicate that Mars’ organic matter input from meteorites interacts with the martian environment, changing its composition. Inspection of individual compounds putatively detected suggest that some astrobiologically relevant compounds (e.g., N bearing polar molecules) are formed when perchlorate reacts with the CM2 organics, whilst others are destroyed.
LC-MS appears to maintain the structure of organic compounds despite the presence of oxidising agents. Our results suggest this technique reduces the detection ambiguity that would otherwise be associated with perchlorate oxidation and ultimately compound destruction in GC-MS ovens. This makes it a valuable tool for future Mars sample return.
References
Hecht, M.H. et al. (2009) Detection of Perchlorate and the Soluble Chemistry of Martian Soil at the Phoenix Lander Site. Science 325, 64-67.
Freissinet, C. et al. (2025) Long-chain alkanes preserved in a Martian mudstone. PNAS 122, 13 e2420580122.
Scheltema, R. et al. (2011) PeakML/mzMatch: A file format, Java library, R library, and tool-chain for mass spectrometry data analysis. Analytical Chemistry 83, 2786-2793.
Smith, C. et al. (2006) XCMS: Processing mass spectrometry data for metabolite profiling using nonlinear peak alignment, matching, and identification. Analytical Chemistry 78, 779-787.
Pang, Z. et al. (2024) MetaboAnalyst 6.0: towards a unified platform for metabolomics data processing, analysis and interpretation. Nucleic Acids Res 52, W398-W406.

Figure 1. PCA of the meteorite treatment. PC1 (59.5%) accounts for most of the variance with a clear progression of the perchlorate treatment. PC2 (14.4%) is less clear showing high variation at the extreme ends of the treatment.
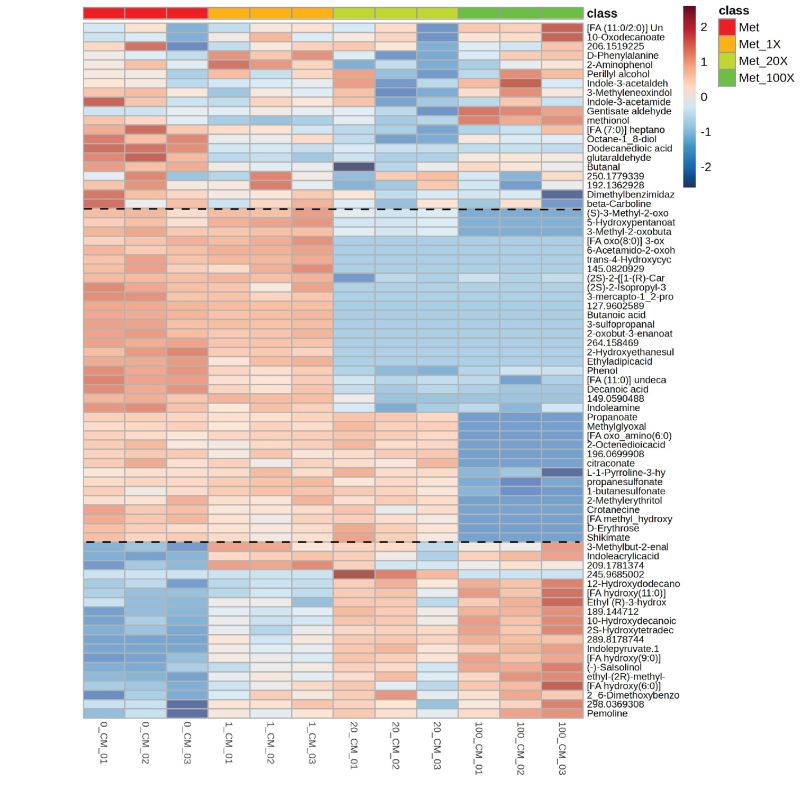
Figure 2. A clustered heatmap of the concentrations of the compounds in the meteorite perchlorate treatment. The bottom section shows compounds that have increased with the increased addition of meteorite compounds. The middle section are compounds that are semi resistant or decrease with perchlorate treatment.
How to cite: Tait, A. W., O'Brien, A. C., Hallis, L. J., Morrison, D., Regnault, C., Blackburn, G., Hagermann, A., and Schröder, C.: Reaction of perchlorate with meteorite organic compounds – implications for organic molecule characterization on Mars, EPSC-DPS Joint Meeting 2025, Helsinki, Finland, 7–13 Sep 2025, EPSC-DPS2025-1224, https://doi.org/10.5194/epsc-dps2025-1224, 2025.
Introduction: The Fe-carbonate siderite has been detected in Gale crater by the CheMin instrument onboard the Curiosity rover at concentrations up to ~10.5 wt% [1,2] (Fig. 1, red stars). However, it remains undetected in orbital spectral data spanning 0.4–2.5 μm, even with recent advancements in CRISM data processing [3,4]. This discrepancy raises the possibility that spectral signatures of siderite in Mt. Sharp may be masked by other minerals present in the same strata. Notably, Mg-sulfates, occurring in amorphous form as well as kieserite and starkeyite, are abundant in these layers [1–3,5] (Fig. 1, shaded pink) and exhibit strong absorptions in the ~1.9–2.4 μm range, potentially interfering with the siderite diagnostic features near 2.3 and 2.5 μm.
Methods: We prepared five physical mixtures of Mg-sulfate and Fe-carbonate (siderite) powders in varying proportions to investigate whether Mg-sulfate can mask the orbital detection of siderite.
MicrOmega is a hyperspectral microscope operating in the infrared range (0.99–3.65 µm), offering a 5 × 5 mm² field of view and a spatial resolution of ~22 µm per pixel [6]. It is housed within the Planetary Terrestrial Analogue Library (PTAL) chamber, a large glove box continuously flushed with pure N₂. The chamber includes a movable sample platform that enables precise positioning, as well as temperature control to manipulate the hydration state of hydrous minerals. This configuration supports repeated imaging to capture both spatial heterogeneity and temporal changes during sample dehydration. For each sample, we acquired MicrOmega hyperspectral image cubes at three timepoints: at initial chamber exposure (t₀ = 0 hours), after 3 hours (t₁), and after 1 month (t₂). We calculated key spectral parameters to aid in grain identification and examined individual spectra to identify features at both the grain and full-image scales.
Results: In line with previous studies, the Mg-sulfate in our samples progressively dehydrates when exposed to the dry MicrOmega chamber environment [7,8]. MicrOmega spectral data indicate that the Mg-sulfate is initially present as epsomite (7 H₂O per formula unit) at t₀, transitions to starkeyite (4 H₂O) after 3 hours (t₁), and becomes largely amorphous (~2 H₂O) after 1 month (t₂).
Among the diagnostic siderite features, the 2.5 μm absorption is more readily detectable than the 2.3 μm band in our mixtures. While both features are evident in spectra of individual siderite grains, only the 2.5 μm band appears in the average spectra across the full MicrOmega field of view. This suggests that in a CRISM pixel (~18 × 18 m) where Mg-sulfate is present, the 2.3 μm siderite absorption may be obscured.
Our results also show that when Mg-sulfate is in its most hydrated form—crystalline epsomite—spectral features of siderite can be almost entirely masked, even in grain-specific spectra. In contrast, less hydrated forms such as starkeyite and amorphous Mg-sulfate are less effective at obscuring siderite’s spectral signatures.
Discussion & conclusions: These findings indicate that the presence of Mg-sulfate can obscure the key 2.3 and 2.5 μm carbonate absorptions commonly used in CRISM data to identify carbonates from orbit. In Gale crater, the presence of crystalline Mg-sulfate may be a contributing factor in masking the spectral signatures of siderite. Notably, all drill sites where siderite has been identified correspond to regions mapped as polyhydrated Mg-sulfate in CRISM data (Fig. 1).
While other factors, such as the low volumetric abundance of carbonates and grain-scale textural effects, may also contribute to the absence of carbonate absorptions in orbital observations, our results suggest that hydrated Mg-sulfate in upper Mt. Sharp plays a significant role. Elsewhere on Mars, similar sulfate-rich deposits may also obscure carbonate absorptions, particularly the 2.3 μm band and, to a lesser extent, the 2.5 μm feature, when carbonates are present at ~<25 wt%. This is relevant to other works that propose that major layered sulfate units could contain carbonates at levels comparable to those in Gale crater [2].
In sulfate-bearing terrains, particular attention should be given to the 2.5 μm band, as it may offer the only visible indication of carbonates. This is especially relevant for sites like Oxia Planum, where carbonate detections rely solely on a 2.5 μm feature without a corresponding 2.3 μm band [13]. Revisiting surface spectra to identify isolated 2.5 μm absorptions may provide new insights, especially considering the widespread nature of secondary sulfates on Mars and their impact on orbital carbonate detection.
References: [1] Thorpe et al., 2022, JGR Planets, 127, e2021JE007099. [2] Tutolo et al., 2025, Science, 388, 6744. [3] Sheppard et al., 2020, JGR Planets, 126. [4] Dhoundiyal et al., 2023, Icarus, 115504. [5] Fraeman et al., 2016, JGR Planets, 121. [6] Bibring et al., 2017, Astrobiology, 17, 621-626. [7] Sheppard et al., 2022, Icarus, 115083. [8] Chou et al., 2013, Journal of Asian Earth Sciences, 62. [9] Viviano-Beck et al., 2014, JGR Planets, 119. [10] Chipera et al., 2023, JGR Planets, 128. [11] Loizeau et al., 2020, Planetary and Space Science. [12] Farrand et al., 2024, AGU abstract. [13] Mandon, L., Parkes Bowen, A., Quantin-Nataf, C., Bridges, J. C., Carter, J., Pan, L., et al. 2021. Astrobiology, 21, 464–480.
Fig. 1: Orbital map of Curiosity drill holes. Samples where Curiosity detected Fe(II)-carbonate with CheMin [1] are marked with red stars and their abbreviated drill names: Glen Etive (GE/GE2), Mary Anning (MA/MA3), Groken (GR), Nontron (NT), Bardou (BD), Tapo Caparo (TC), Ubajara (UB), Sequoia (SQ). Samples where no carbonate was detected are marked with white circles. The drill holes are superimposed over HiRISE imagery and show in pink where orbital CRISM spectra show the presence of polyhydrated Mg-sulfate [3].
How to cite: Sheppard, R., Loizeau, D., Fraeman, A., Rampe, E., Pilorget, C., and Bibring, J.-P.: Sulfate can obscure spectral evidence of carbonate: MicrOmega observations with implications for Mars, EPSC-DPS Joint Meeting 2025, Helsinki, Finland, 7–13 Sep 2025, EPSC-DPS2025-1667, https://doi.org/10.5194/epsc-dps2025-1667, 2025.
Please decide on your access
Please use the buttons below to download the supplementary material or to visit the external website where the presentation is linked. Regarding the external link, please note that Copernicus Meetings cannot accept any liability for the content and the website you will visit.
Forward to presentation link
You are going to open an external link to the presentation as indicated by the authors. Copernicus Meetings cannot accept any liability for the content and the website you will visit.
We are sorry, but presentations are only available for users who registered for the conference. Thank you.
Introduction
The Jezero fan delta has been well studied ever since the Mars 2020’s Perseverance rover landed in the crater in February 2021. There is now a comprehensive understanding of the architecture of the delta thanks to both in situ and orbital imagery; the fan formed in a closed lake as a Gilbert-type delta, showcasing the distinctive topset-foreset-bottomset tripartite [1].
Now that Jezero western fan is better understood, we would like to know if the Jezero delta architecture is relevant elsewhere on Mars: can we find similar geometries? Is Jezero the rule or the exception? To begin to try to answer this question, we focused on another martian sedimentary structure of similar size and volume: the Eberswalde sedimentary fan.
The Eberswalde crater (24.3° S, 326.5°E), located immediately northeast of the Holden crater, along the fluvial network connecting Argyre Planitia to Ares Vallis displays a spectacular fan shaped feature (~115 km²) with meandering channels in its westernmost part, that was most likely emplaced during the Late Noachian [2] in a closed-basin lake [3]. The volume of the fan is similar to that of Jezero’s western delta, the thickness of sediment is about 50 to 100 m in both cases [2], which makes it an interesting starting point for the comparison of Jezero to other martian sedimentary fans.
Methods
This study focuses on the geomorphological and stratigraphic analysis of the Eberswalde fan using orbital imagery. The HiRISE coverage of the Eberswalde crater is really good, due to the crater being previously considered among the potential landing sites of MSL and Mars 2020 missions. Thanks to HiRISE data, we have access to images with a resolution of up to 0.25 m/pix on the whole fan area.
The HiRISE orthoimages were taken as stereo pairs, which allowed creating stereo-derived DTM, giving access to topographic information. Contour lines and topographic profiles can therefore be extracted on the QGIS software. The dip angles of the outcropping layers can also be measured using the DTM on QGIS, thanks to the Three-Points-Method plugin, which extracts the elevation data from three points placed along the layer and calculates the dip angle and strike of said layer. Dipping layers were already observed by Goudge et al. (2018) [4] before rover data, showing that it is possible to observe them from orbit.
Results
On orbital imagery of the Eberswalde sedimentary fan, extensive meandering inverted channels are visible (Figure 1). It is possible to distinguish five lobes that were emplaced at different periods in time (Figure 1) [2]. The shape of the river channels on the Eberswalde fan differs from that of the channels on the Jezero delta, where they are rectilinear [5]. This indicates a difference in the fluvial regime responsible for the emplacement of these channels.

Figure 1: Map of the meandering inverted channels on the Eberswalde sedimentary fan and their stratigraphic relationships, from oldest to youngest lobes (coloured scale) [2]. White box represents the studied area of Figure 2. (HiRISE – MRO).
The beds outcropping at the front of the Eberswalde fan have dips mostly around 0° to 5°, occasionally reaching up to 8°, and almost always follow the contour lines (Figure 2a). These outcropping strata are therefore mostly subhorizontal, there are no steeply inclined layers at the front of the fan that would correspond to Gilbert-type foreset strata (Figure 2) as was observed in Jezero delta [1].
Two main phases can be distinguished from the orbital data: a lacustrine phase, with the subhorizontal beds outcropping at the front, and the fluvial (meandering) phase occurring afterwards.

Figure 2: (a) Close-up of an area on the Eberswalde sedimentary fan. Contour lines at 5 m are extracted from the stereo-derived HiRISE DTM (HiRISE – MRO). Red line: log line AA’ of the cross-section in (b).
(b) Interpreted cross-section of log AA’ with dip angles measured using the DTM reported on the section. Grey zone represents the lacustrine beds, blue the fluvial beds (recognizable also on the orbital imagery), and brown zone is the dust-covered areas. The red dashed line represents the possible discontinuity contact between the fluvial and lacustrine phases.
Preliminary conclusions
The stratigraphic and geomorphologic data of the present study indicate that the Eberswalde sedimentary fan did not emplace as a Gilbert-type delta, as is the case for the Jezero delta. It is therefore necessary to understand how the Eberswalde fan formed. Two hypotheses can be proposed:
- The fan emplaced in two separate phases, a lacustrine phase first, and a late-stage fluvial phase, emplacing the meandering rivers, with a gap between these two stages.
- Eberswalde is a shoal-water delta, that emplaced in a shallow lake, possibly as an aggradational delta [6], contrary to the progradational settings of the Jezero delta.
Those preliminary conclusions and hypotheses highlight the fact that the processes leading to the formation of the Eberswalde and Jezero fans are different, and the scenario of the Jezero delta should not be taken as the rule on Mars, although we have not explored more fans yet. The in-depth study of other martian sedimentary fans is fundamental for a better understanding of the availability of liquid water at the time they formed.
References
[1] Mangold N. et al. (2021) Science, 374, 711-717, doi: 10.1126/science.abl4051.
[2] Pondrelli M. et al. (2008) Icarus, 197, 429-451, doi: 10.1016/j.icarus.2008.05.018.
[3] Malin M. C. & Edgett K. S. (2003) Science, 302, 1931-1934, doi: 10.1126/science.1090544.
[4] Goudge T. A. et al. (2017) Earth and Planetary Science Letters, 458, 357-365, doi: 10.1016/j.epsl.2016.10.056.
[5] Kronyak R. E. et al. (2023) 54th LPSC, Abstract #2806
[6] Lewis K. W. & Aharonson O. (2006) J. Geophys. Res., 111, doi: 10.1029/2005JE002558.
How to cite: Carlot, N., Salese, F., Mangold, N., and Ori, G. G.: Stratigraphic analysis of the Eberswalde sedimentary fan using orbital imagery and comparison with the Jezero delta, Mars, EPSC-DPS Joint Meeting 2025, Helsinki, Finland, 7–13 Sep 2025, EPSC-DPS2025-92, https://doi.org/10.5194/epsc-dps2025-92, 2025.
Introduction:
Fluvial valley networks on Mars provide key sites for investigating the role of surface liquid water in Mars’ ancient past. Between June and August 2024, the Perseverance rover spent 85 sols exploring a series of outcrops in Neretva Vallis, one of two inlet channels which provided water to the Jezero crater paleolake. These predominantly fine-grained sedimentary rocks comprise the “Bright Angel” formation [1], and the collection of an astrobiologically compelling sample from these rocks [2], motivates the development of a robust stratigraphic model to understand their emplacement. Here, we document the sedimentology and stratigraphy of the Bright Angel formation using Mastcam-Z landscape mosaics and derived 3D Digital-Outcrop-Models (DOMs) [3, 4], to constrain its depositional environment and sedimentary evolution.
Sedimentology and stratigraphy:
The Bright Angel formation comprises seven members (Figure 1). The base of the sequence comprises 1–10-cm-thick, planar-stratified rocks of the Tuff Cliff member, which exhibits at least one example of sub-rounded, pebble-sized clasts up to 2.5-cm-diameter (Figure 1B). These dark-toned rocks fine upwards into an ~8–10-m-thick succession of laminated mudstone (Figure 1C-D) variably cut by Ca-sulfate veins and nodules, with rarer dm-thick pebbly interbeds in its lower ~2m, termed the Walhalla Glades member. ~500 m west, at the northern contact of the Bright Angel formation with the Margin unit, a ~0.5-m-thick lens of monomict, matrix-supported olivine granule conglomerate is observed, named the Fern Glen Rapids member. This is overlain by a ~0.5 m thick mudstone with rare, coarser-grained, cm-thick olivine-rich horizons (Figure 1E), termed the Cheyava Falls member, which is overlain by the Walhalla Glades member. The Tuff Cliff member was not observed here. This succession is overlain and incised by an unstratified, unsorted, matrix-supported conglomerate exposed in the south of the channel (Figure 1F), termed the Mount Spoonhead member. The Serpentine Rapids (SR) member comprises a cross-stratified pebbly conglomerate (Figure 1G), lining the southern channel margin and appears to cap the sequence.
Figure 1: Geologic map and outcrop images of the members of the Bright Angel formation. (A) Structural-geologic map, (B) Contact of the Tuff Cliff and Walhalla Glades members, (C) Pebble-sized clasts in the Tuff Cliff member, (D) Contact of the Cheyava Falls and Fern Glen Rapids members, (E) plane-parallel lamination in the Walhalla Glades member, (F) Matrix-supported, conglomeratic texture of the Mount Spoonhead member, (G) Cross-stratified pebbly conglomerate of the Serpentine Rapids member. Image credits: NASA/JPL-Caltech/ASU/MSSS
Structural analysis and sedimentary successions:
Cross-sections were constructed using structural mapping from Mastcam-Z DOMs (Figure 2). Long-channel profile (A-A’) shows the Tuff Cliff member exposed in the east is likely buried beneath other members in the western Bright Angel outcrop. Cross-channel profile (B-B’) shows a fining-up sequence (from the Tuff Cliff to Walhalla Glades member), truncated by the Mount Spoonhead member conglomerates and Serpentine Rapids member cross-stratified conglomerates. A close-up of the northern exposure reveals an open, synform structure, with beds dipping into the channel. This apparent channel-infilling structure of the unit is supported by ground-penetrating radar acquired by RIMFAX [5], and appears consistent with the Bright Angel formation being younger than the Margin unit (although the contact is very poorly exposed at the surface). Structural data were projected across this structure onto an inferred fold axis, and assuming a constant bedding thickness, allowed the thickness of the mudstone succession to be estimated to at least ~10 m. Profile C-C’ shows that within ~2 m of the northern contact, bedding dips increase from 30˚ to >50˚ into the channel, exceeding the expected angle of repose and implying localised deformation [6].
Figure 2: Structural analyses of the Bright Angel formation, including long-channel profile A-A’, cross-channel profile B-B’ (with zoom of the northern section, showing a channel-filling bedding geometry), and zoomed profile C-C’ across the northern contact. Stereonet shows poles to bedding planes across the B-B’ section, and inferred “fold” axis.
Interpretation: The Tuff Cliff, Fern Glen Rapids, Cheyava Falls and Walhalla Glades succession is consistent with lacustrine deposition. The Tuff Cliff member conglomerates may reflect subaerial or proximal lacustrine deposition, and the fining-up into ~10 m of predominantly laminated mudstones (consistent with subaqueous suspension settling) may reflect a lake transgression. The matrix-support and compositional similarity of clasts in the Fern Glen Rapids and Cheyava Falls members to the Margin unit is consistent with local derivation from the valley walls, potentially as small debris flows. The very poor sorting and matrix-support of the Mount Spoonhead member is consistent with a mud-rich debris flow, with diverse clasts potentially sourced from the crater rim and beyond [7]. The Serpentine Rapids member cross-stratified conglomerates are consistent with unidirectional bedload transport in a fluvio-alluvial or fluvio-deltaic environment. Abundant Ca-sulfate veins in the lower stratigraphy supports burial depths sufficient for hydrofracturing.
This lacustrine environment occurs 10–50 m above the paleolake level implied by the Jezero western fan [8], suggesting the Bright Angel formation was deposited either (1) during a lake highstand, pre-dating breach of the eastern crater rim and western fan deposition [9], or (2) in a later-stage, valley-confined lake. The latter are common in terrestrial valley networks, where slope failure leads to channel blockage and formation of a lake upstream. These can produce successions similar to the Bright Angel formation [1,10], and may explain the absence of Bright Angel-like materials beyond Neretva Vallis. However, it remains unclear whether sufficiently thick deposits could accumulate to enable hydrofracturing of the lower members. Thicker deposits may accumulate in a more stable, pre-delta, lake highstand phase as proposed by [9]. In this model, the Bright Angel sediments may have been deposited up to 100 m below the highstand lake level [9].
References: [1] Jones et al., LPSC (2025), [2] Hurowitz et al., LPSC (2025), [3] Bell et al., Space Sci Reviews 217 (2021), [4] Paar et al., Earth and Space Science, 10 (2023), [5] Russell et al., AGU (2024). [6] Barnes et al., LPSC (2025), [7] Treiman et al. LPSC (2025), [8] Fassett and Head, Geophysical Research Letters, 32 (2005), [9] Salese et al., Astrobiology, 20 (2020), [10] Fort et al., Quaternary Research, 31 (1989).
How to cite: Jones, A., Barnes, R., Gupta, S., Paar, G., Horgan, B., Garczynski, B., Broz, A., Klidaras, A., Stack, K., Hurowitz, J., Russell, P., Bell III, J., Maki, J., Wogsland, B., Simon, J., Kanine, O., Mangold, N., Randazzo, N., Brown, A., and Flannery, D.: A fluvio-lacustrine environment preserved in the Jezero crater inlet channel, Neretva Vallis (Mars), EPSC-DPS Joint Meeting 2025, Helsinki, Finland, 7–13 Sep 2025, EPSC-DPS2025-888, https://doi.org/10.5194/epsc-dps2025-888, 2025.
Introduction: In 2024, the Perseverance rover explored Neretva Vallis, an inlet valley which once brought water into Jezero Crater, Mars. In Neretva Vallis, the rover encountered variably oxidized mudstones transected by erosion-resistant veins and fractures. These sedimentary rocks were investigated using SuperCam [1,2] – a mast-mounted spectroscopy instrument capable of Laser Induced Breakdown Spectroscopy (LIBS), visible-near infrared and Raman spectroscopy. LIBS works by focusing a laser onto a target at a distance of up to several meters and generating a small plasma. As the plasma decays, light is emitted at wavelengths specific to the elements present in the sample, allowing geochemical analysis of the targets. In Neretva Vallis, SuperCam detected significant enrichments in nickel (Ni), including the highest concentration ever observed in Martian bedrock (~1.2 wt.%). In this work, SuperCam and PIXL (micro-XRF) data are used to contextualize this discovery and explore its implications for the emplacement and alteration history of Neretva Vallis.
Results: Ni detections with SuperCam are highly localized within the northern and southernmost portions of Neretva Vallis. In the north, this is within the “Beaver Falls” workspace, where the rover examined the contact between the dominant mudstones of Neretva Vallis and the adjacent olivine/Fe-carbonate-rich margin unit. SuperCam detected significant Ni enrichments on both sides of this contact, with particularly strong concentrations (up to ~0.63 wt.%) in an olivine-rich conglomerate interpreted as a debris flow sourced from the Margin Unit [3]. In the south, Perseverance took measurements in the highly oxidized mudstones of the “Wallace Butte” workspace. Here SuperCam found substantial Ni enrichments in the bulk mudstone, including the “Dragon Creek” target, which averaged ~1.1 wt.% Ni over ten individual LIBS observations. A correlation between Fe and Ni was observed, indicating that Ni is likely hosted in a Fe-rich phase. The Fe:Ni ratio was ~60-90 for most targets.
PIXL, an arm-mounted X-ray fluorescence (XRF) instrument that produces mm- to cm-scale elemental maps [4], found Ni concentrated within ~1–1.5 mm zones of Fe-sulfide and Mg/Ca-sulfate, consistent with rounded grains or nodules, as well as linear ~0.3 wide sulfide/sulfate veins. Limited counting statistics, diffraction, and the Fe Kβ tailing currently limit direct comparison of absolute abundances of Ni between PIXL and SuperCam.
Discussion: The presence of Ni-rich, anhedral, and dispersed ~1–1.5 mm Fe-sulfide nodules, as well as linear veins, within a mudstone is reminiscent of authigenic pyrite in sedimentary rocks from Earth’s early history. The Ni content of ancient pyrite nodules has been used on Earth to track changing ocean conditions and interactions with igneous events, including the emplacement of large igneous provinces [5,6]. The provenance of Ni in Neretva Vallis is difficult to determine without isotopic or co-occurring trace element data but the Mg-poor composition of Bright Angel mudstones argues against local sourcing from the adjacent ultramafic margin unit.
Ni impurities in greigite (Fe3S4), a precursor to authigenic sedimentary pyrite on Earth, resemble proteins that are essential to early microbial carbon fixation and have therefore been proposed as key to abiogenesis [7]. The detection of major Ni enrichments in fine-grained sedimentary rocks, spatially related to zones of locally reduced sulfur (‘leopard spots’) and the first detection of G-band organics with SHERLOC Raman spectroscopy [8], could provide another hint at potential organic processes.
References: [1] Wiens R. C. et al. (2021) Space Sci Rev, 4, 217. [2] Maurice S. et al. (2021) Space Sci Rev, 47, 217. [3] Jones et al. (2025) Lunar and Planetary Science Conference. [4] Allwood A. C. et al. (2020) Space Sci Rev, 134, 216. [5] Large R. R. et al. (2014) Earth Planet. Sci. Lett., 209-220, 389. [6] Gregory D. et al. (2019) Geoch. Cosm. Acta¸ 53-68, 259. [7] Russell M. J. and Martin W. (2004) Trends in Biochem. Sci., 358-363, 29. [8] Hurowitz et al. (2025) Lunar and Planetary Science Conference.
How to cite: Manelski, H., Wiens, R., Broz, A., Hurowitz, J., Tice, M., Clegg, S., Dehouck, E., Connell, S., Forni, O., VanBommel, S., Schröder, S., Gabriel, T., Bedford, C., Martinez, R., and Cousin, A.: Ore-Grade Nickel Hosted in Fine-Grained Sedimentary Rocks, Jezero Crater, Mars, EPSC-DPS Joint Meeting 2025, Helsinki, Finland, 7–13 Sep 2025, EPSC-DPS2025-431, https://doi.org/10.5194/epsc-dps2025-431, 2025.
The NASA rover Perseverance traversed down the western slopes of the Jezero crater rim, informally named Witch Hazel Hill, between sols 1358 to 1500+, providing an opportunity to observe and analyse a relatively pristine, though ancient, 45 km-wide Noachian impact crater. The relatively complete exposure of the bedrock in the lower slopes and its apparent structural complexity allows us to assess the structural geometry of a major unit within the Jezero crater western rim and interpret it in its regional context. We present observations of stratigraphic and structural geometry from panoramic mosaics and digital outcrop models derived from images collected by the Mastcam-Z camera system during the traverse through the stratigraphy. Observations are collated into local and area-scale cross-sections to highlight the geometrical characteristics of the key units, deformation features, and their relationships with each other.
We focus on Broom Point on the lower western slopes of the Jezero crater rim, and its relationship with the presently overlying Shallow Bay and Millbrook outcrops within Witch Hazel Hill (Fig. 1). Broom Point contains a well-exposed section of layered bedrock comprising discontinuous light and dark toned bands exposed in a ~200 m by 300 m area. The Broom Point succession covers ~ 25 m of vertical topography in the traversed region, increasing to ~65 m to the north and is situated towards the base of the crater rim. The basal contact with a darker and apparently structureless unit called Salmon Point (Fig. 1) is abrupt, forming an arcuate shape, convex to the east. The upper contact of Broom Point (Fig. 1) is marked by an upwards change from well-defined layers to more rubbly bedrock showing signs of wide scale brecciation and alteration. The upper contact does not appear to be concordant with the internal layer geometries at Broom Point, whereas the lower contact with Salmon Point does appear to be parallel to the internal layer geometries (Fig. 1).
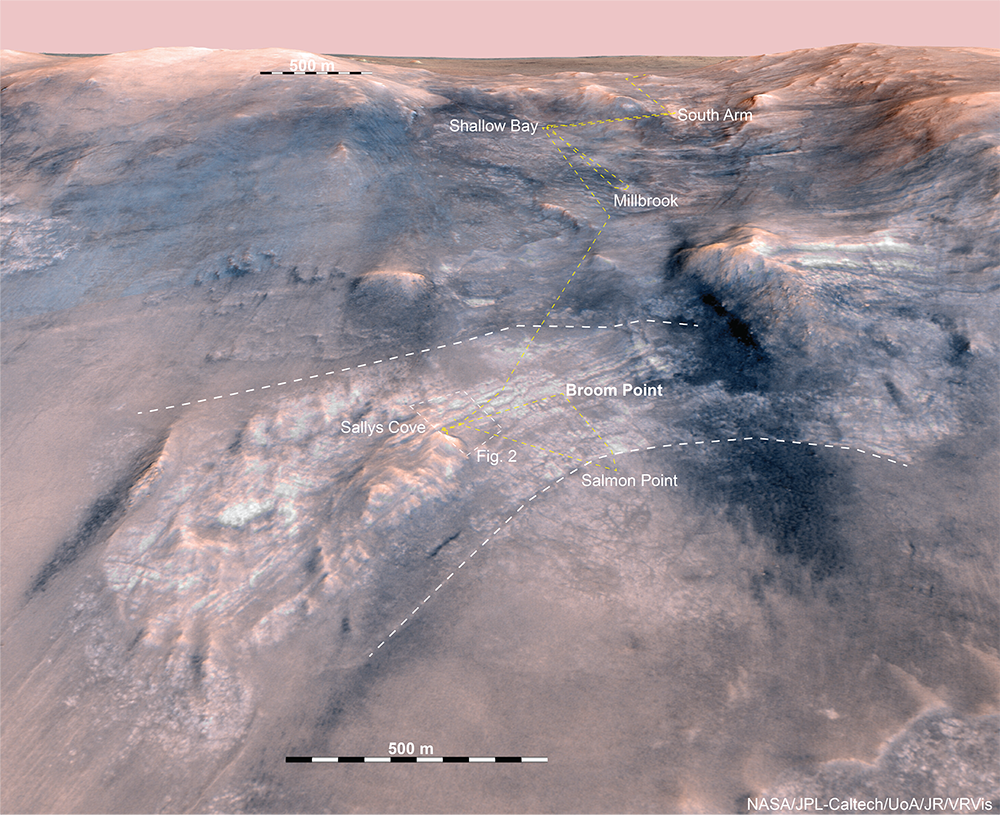
Figure 1. 3D view of Witch Hazel Hill on the western side of the Jezero crater rim. The white dashed line shows the locations of the upper and lower contacts of Broom Point. The dashed yellow line delineates the rover traverse.
Outcrop at Broom Point is heavily weathered, but four main lithofacies are observed within the alternating light and dark toned units (Fig. 2); (1) an angular matrix/groundmass supported breccia; (2) light-toned, laminated, fine, particulate lithology; (3) a light-toned, structureless, fine, particulate lithology; and (4) spherule-bearing (1-5 mm in diameter) layered rocks. These facies occur in multiple fining-up sequences which may represent emplacement from multiple volcanic eruptions or impact events.
Topographic relief and exposure of contacts between the light-toned laminated and breccia facies at Sallys Cove enabled us to constrain layer dip in that location to <60° to the northeast (Fig. 2), into the slope of the hillside. Fine, parallel laminated layers of rounded spherules further east within the outcrop dip ~45° to the east and northeast, largely parallel to the overall layer contacts. The change in dip direction observed between Sallys Cove to Broom Point indicates that the layering outlines a fold structure.
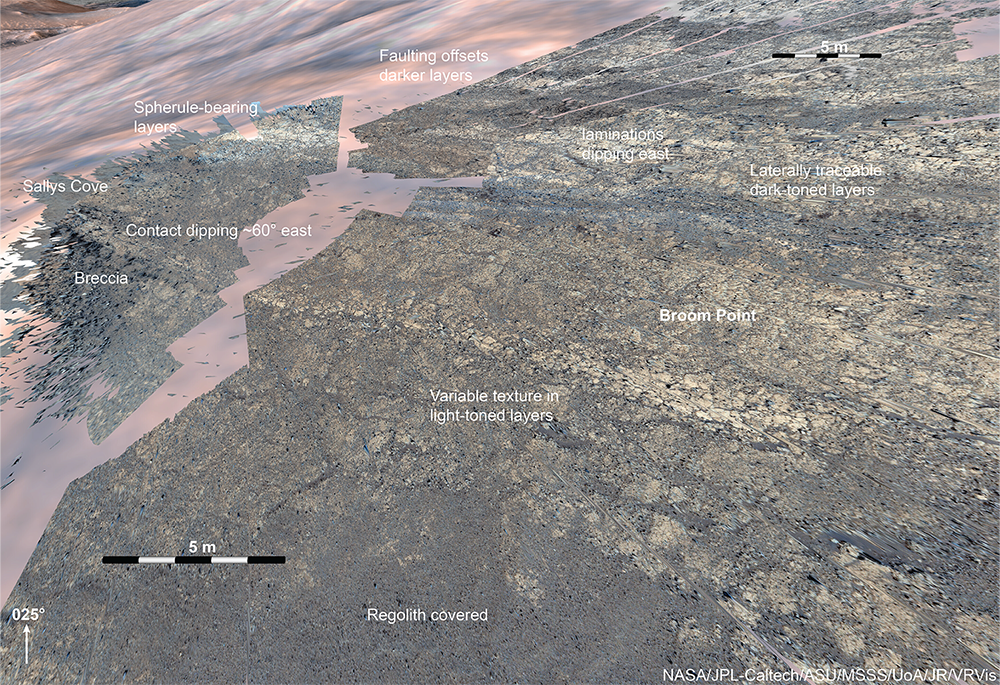
Figure 2. Digital outcrop model of the stratigraphic sequence exposed around Sallys Cove at Broom Point.
A series of ENE-WSW striking, parallel, relatively regularly spaced fractures are observed to cut the banded unit at Witch Hazel Hill. In some locations <5 m of apparent sinistral and dextral offset is observed, interpreted as a result of faulting of dipping layers along dipping fault surfaces. The fault geometries are consistent with extensional deformation. The faults are not present above the contact with Millbrook and do not appear to have deformed the upper and lower bounding surfaces of the banded unit. They are therefore interpreted to have formed before or during the deformation responsible for the dipping layers at Broom Point.
The overall geometry defined by the layering at Broom Point is a broad, east plunging anticline, of which the Perseverance Science team have traversed the crestal region. Stratification is difficult to define in rim units overlying Witch Hazel Hill, such as Millbrook and South Arm (Fig. 1), where apparent layering or foliation predominantly dips to the west. We constrain the location of this dip change to occur at the upper contact of the light-toned banded unit at Broom Point, an observation consistent with layer truncations apparently visible in orbital data. The contact is poorly preserved in outcrop so it is not possible to determine whether it is the expression of faulting, an erosional unconformity, or whether it defines the limit of in-place brecciation and foliation within the outer part of the crater rim. It appears to mark a clear change in overall structure nonetheless.
Previous observations and numerical modelling of Jezero-scale impacts show that the extent of layer rotation, faulting and lithologies observed at Broom Point are difficult to explain as having occurred solely as a result of the Jezero impact itself. It is therefore interpreted that Broom Point at Witch Hazel Hill records repeated volcanic or impact and deformation events which pre-date the Jezero impact and may have formed and deformed during the regional Isidis basin forming or other major pre-Jezero event.
How to cite: Barnes, R., Jones, A., Gupta, S., Paar, G., Stack, K., Gwizd, S., Klidaras, A., Deahn, M., Ravanis, E., Quantin-Nataf, C., Mayhew, L., Horgan, B., Crumpler, L., Simon, J. I., Rice, J., Bell, J., and Maki, J.: Pre-impact stratigraphy exposed in the western Jezero crater rim, EPSC-DPS Joint Meeting 2025, Helsinki, Finland, 7–13 Sep 2025, EPSC-DPS2025-1618, https://doi.org/10.5194/epsc-dps2025-1618, 2025.
X-ray fluorescence (XRF) spectroscopy has long served as a cornerstone analytical technique in planetary surface exploration, enabling high-precision compositional analyses of planetary materials in situ. On Mars, two prominent XRF instruments — the Alpha Particle X-ray Spectrometer (APXS) aboard Curiosity and the Planetary Instrument for X-ray Lithochemistry (PIXL) aboard Perseverance — have demonstrated that the capabilities of landed XRF instruments extend beyond the quantification of bulk chemistry.
Native Sulfur on Mars
APXS has performed ~1700 compositional analyses since Curiosity landed in Gale crater in 2012. While APXS traditionally derives bulk rock and soil compositions, systematic advancements have been made that enable the assessment of distinct features on the sub-cm scale, smaller than the APXS field of view (e.g., [1]). This advancement, combined with the capability to characterize light‑element (i.e., Z<11) enrichment and depletion via backscattered X-ray intensities, played an important role in the recent discovery of a localized deposit of native sulfur (S0) within a canyon on Mars (Figure 1). Native sulfur has not previously been identified in any martian material, including meteorites, and its discovery provides evidence of a stable and dry environment for the past several billion years. Terrestrially, native sulfur is commonly formed through high‑temperature processes or in association with biology. There is an absence of any clear indication of high-temperature processes in Gale crater, especially in the vicinity of the deposit, and a lack of evidence of past biology on Mars. The apparent purity of the S0 characterized by APXS, the absence of entrained dust and debris, and the geomorphology of the area are found to be consistent with the degassing of H2S-rich fluids from clathrates coinciding with sedimentary unloading [2-4].
Figure 1. APXS X-ray scatter analyses (i.e., Compton/Rayleigh intensity, C/R) of a deposit of light-toned stones in Gediz Vallis demonstrated a significant depletion in light elements, such as oxygen, compared to anticipated X-ray scatter intensities based on the assumed oxides (e.g., SO3 not S), providing important evidence that supported the determination of native sulfur. This oxygen depletion is similar to that observed in Fe-Ni metal meteorites (i.e., Fe not FeO) and differs from light-element enrichments observed by the Opportunity APXS in Marquette Island where carbonate cement was inferred. When the oxide species present parallel those assumed, the ratio of observed to modeled (or expected) is approximately unity (e.g., Mars soil).
Mars Hadley Cells
Curiosity’s APXS has been routinely measuring the martian atmosphere, paralleling similar assessments made by predecessor instruments on the twin rovers Spirit and Opportunity [5]. No APXS flown to date has been designed or calibrated for atmospheric analyses. Yet, the collective span of these three missions – with over 11,000 martian sols between them – and the frequency at which atmospheric measurements were acquired has enabled an unparalleled look into the modern environment of Mars. In addition to tracing condensation flow, recent campaigns by Curiosity have focused on characterizing the variation in Ar partial pressure in the atmosphere around Ls 45 and Ls 150, annual timeframes where punctuated deviations from smooth periodic trends are observed. These data, particularly when contrasting ~antipodal results from Opportunity and Curiosity, provide insights into potential Hadley Cell circulation (Figure 2).
Figure 2. Argon partial pressure (pAr) variation observed at Meridiani Planum (blue) and Gale crater (red). Data have been reduced across multiple Mars years to improve statistics. A short-lived pAr enrichment is observed around solar longitude (Ls) 140-180, occurring roughly 30 (Earth) days earlier at Meridiani Planum (1.9°S, 354.5°E) than at Gale crater (4.6°S, 137.4°E).
Ultrafine Mars Dust
At Jezero crater, Perseverance has been deploying PIXL, a micro-focused X-ray spectrometer, to produce compositional maps with 100-µm scale spatial resolution, including in support of Mars Sample Return (MSR) sample characterization efforts. Prior to flight, PIXL’s ability to assess thin coatings was not characterized. Coatings on the scale of ~100 µm to sub-µm produce non-linear effects in acquired X-ray spectra (e.g., [6]). Perseverance’s landed hardware also includes a vertically mounted calibration target specifically tailored for PIXL. This calibration target includes four distinct pucks, including one basaltic glass and one composed of polytetrafluoroethylene (PTFE, Teflon™), a “spectral blank”. Since landing, dust has adhered to the PIXL calibration target pucks. PIXL analyses of the PTFE puck provide the first ever XRF analyses of strictly Mars dust. Compositionally, this dust was found to be in alignment with existing literature [7] and to have a noted enrichment in phosphorus as well as volatile and moderately volatile elements; the observed 1:1 Ca:S ratio over time is evidence of Ca-sulfate. Dust was characterized to be below ~PM1 (i.e., ~1 µm) on the PTFE puck and below ~PM0.1 (i.e., ~100 nm) on the basaltic glass puck, suggestive of electrostatic sorting. Dust – which is silica-rich, iron-rich, and potentially perchlorate-bearing – at this scale has not been previously characterized on Mars (Figure 3). The size and composition of dust observed presents concerns for future crewed missions to the surface of Mars given the high potential for adverse health effects including neurotoxicity from particles that are sufficiently small enough to enter the bloodstream and possibly pass through the blood‑brain barrier.
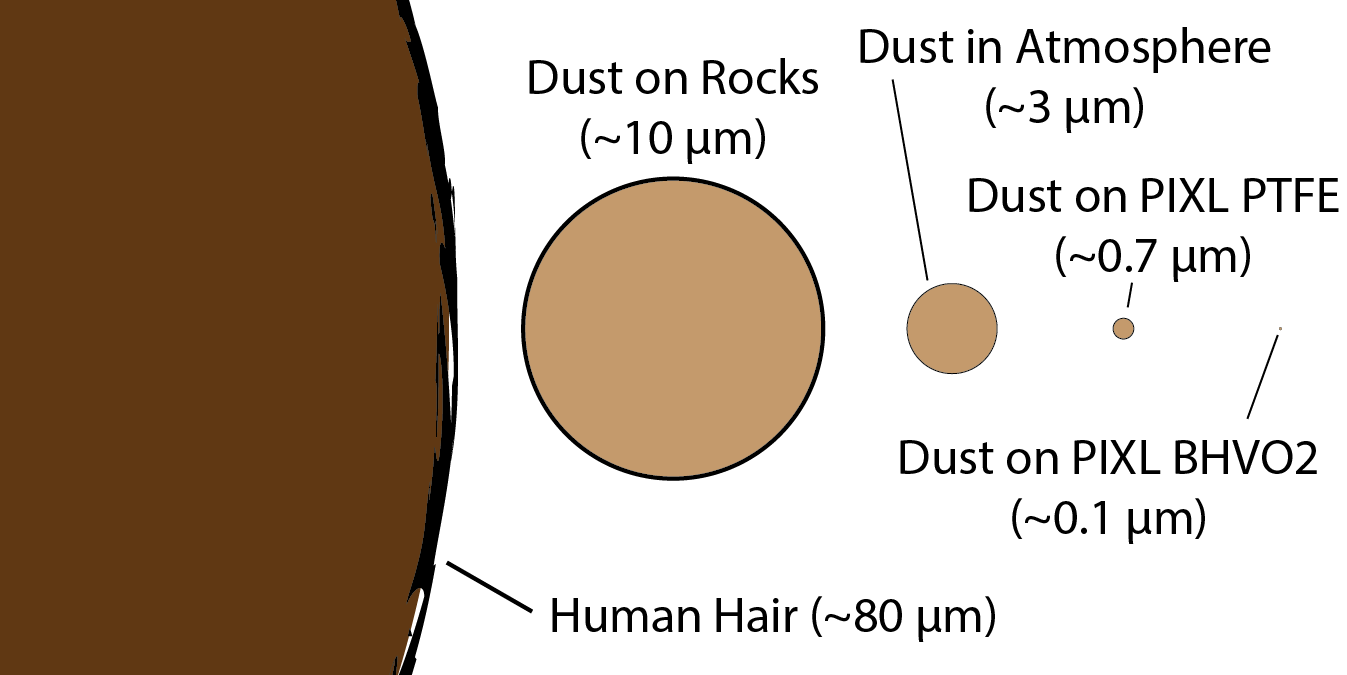
Figure 3. Scale of dust characterized on Mars compared to an average human hair. Prior work characterized Mars dust diameters on rock surfaces to be ~10 µm [8] and in the atmosphere to be ~3 µm (e.g., [9]). Recent characterizations of fine (PM1) and ultrafine (PM0.1) dust particles are a first for Mars.
References
[1] VanBommel et al. (2023). Icarus, 392.
[2] Berger et al. (2025). LPSC, 1208.
[3] King et al. (2025). LPSC, 1949.
[4] Dietrich et al. (2025). LPSC, 1366.
[5] VanBommel et al. (2018). JGR: Planets, 132, 2.
[6] VanBommel et al. (2022). Spec. Acta. B, 191.
[7] Berger et al. (2016). GRL, 43, 1.
[8] Schmidt et al. (2018). JGR: Planets, 123, 7.
[9] Clancy et al. (2003). JGR: Planets, 108, E9.
How to cite: VanBommel, S., Berger, J., Knight, A., King, P., Dietrich, W., Lo, D., and Gellert, R.: Beyond Bulk Chemistry: Enhancing the Science Return of Landed In Situ X-ray Spectrometers, EPSC-DPS Joint Meeting 2025, Helsinki, Finland, 7–13 Sep 2025, EPSC-DPS2025-717, https://doi.org/10.5194/epsc-dps2025-717, 2025.
Please decide on your access
Please use the buttons below to download the supplementary material or to visit the external website where the presentation is linked. Regarding the external link, please note that Copernicus Meetings cannot accept any liability for the content and the website you will visit.
Forward to presentation link
You are going to open an external link to the presentation as indicated by the authors. Copernicus Meetings cannot accept any liability for the content and the website you will visit.
We are sorry, but presentations are only available for users who registered for the conference. Thank you.
Introduction
Many fluid dynamics problems in planetary science involve multiple phases and require advanced numerical methods. While Eulerian approaches are difficult to adapt to complex multi-phase systems, Lagrangian methods like Smoothed Particle Hydrodynamics (SPH) [1] offer greater flexibility, making them well-suited for multi-component flows. In SPH, the fluid is represented by particles, and each particle’s properties are determined by neighboring particles within the range of an interpolation function. Although SPH has been widely used for gas-dust systems [2,3], relatively little work has been done on binary gas mixtures. While [2] suggests that gas-dust models can be extended to gas-gas mixtures, an added challenge arises: molecular collision timescales are much shorter than hydrodynamic timescales, complicating diffusion modeling, especially in multi-phase systems with solid components like dust and ice.
In this work, we present an SPH model for binary gas mixtures using a multi-fluid approach, where each species follows its own set of equations. To handle the short diffusion timescales efficiently, a splitting scheme is implemented, allowing hydrodynamic and diffusive processes to be treated separately, significantly reducing the computational cost. The method applies to any binary mixture of monatomic gases and is designed for future extension to more realistic scenarios, such as the interaction between water vapor and the CO₂-dominated Martian atmosphere, where contributions from rotational and vibrational modes must be included.
Gas mixing models are relevant in a wide range of astrophysical applications, including planetary missions like ExoMars and, in particular, the ESA Rosalind Franklin rover. Scheduled for launch in 2028, the rover will drill up to 2 meters below the surface at Oxia Planum [4]. In an ongoing study [5], we are exploring how drilling operations may influence the presence and stability of possible subsurface volatiles, such as water ice. The gas mixing framework developed here provides a key foundation for incorporating atmospheric effects into such models.
Model
In this two-fluid model formulation, the density, momentum, and energy of each gas are treated separately. The standard Euler equations for an inviscid, ideal gas with zero thermal conductivity are modified to include collisional terms that account for momentum and energy exchange between the species. These terms are derived from a kinetic relaxation model based on the Boltzmann equation [6,7]. A first-order operator splitting [8] separates the hydrodynamic evolution from the collisional terms. Hydrodynamics are advanced using a two-step Euler scheme, while collisional terms are applied as a corrective step within each timestep. Standard hydrodynamic terms, such as pressure gradients in the momentum and energy equations, follow the usual SPH formulation [1]. The exponentially relaxing collisional system is then solved, and the original hydrodynamic velocities and energies are updated with the new collisional terms before advancing to the next integration timestep.
Results
The proposed approach is validated through numerical tests, starting with a comparison of Trotter splitting against the standard SPH method. Additionally, tests on Xe-Ne mixture in a controlled environment verify that the simulations align with expected hydrodynamic and thermodynamic behavior. The tests consider two monatomic gases in a closed cylindrical domain, initially set at Martian atmospheric pressure. The heavier gas occupies the upper half, and the lighter gas the lower half. Finally, no external forces are considered. Fig.1 illustrates the initial setup for the SPH simulation.

Fig.1: Illustration of the initial system setup.
Firstly, we fix the temperature at 300 K and compare results from the formal SPH formulation, using the smaller collisional timestep, with those from Trotter splitting. Fig.2 shows that both approaches yield consistent results, with a maximum discrepancy of 6%. Using 50000 particles on an 18-core workstation, the formal SPH simulation took 6 hours, while the Trotter splitting method finished in about 40 minutes.

Fig.2: Time evolution of mean densities for neon (top) and xenon (bottom). Solid lines show results with the smaller collisional timestep, while dotted lines represent the Trotter splitting approach.
In a second test, xenon is set to an initial temperature of 500 K, and neon is set to 300 K. The simulation shows that the collisional energy exchange causes the gases' temperatures to relax around 366 K (Fig.3), close to the expected equilibrium temperature of 375 K. Fig.4, instead, demonstrates that both gases reach an equilibrium density slightly below half their initial values. Although the final mean density is underestimated by about 8–9%, the simulation correctly reflects the expected behavior. Indeed, since mass is conserved and the volume occupied by each gas doubles during mixing, the final equilibrium densities are expected to be half of their initial values. The small underestimation is primarily attributed to the influence of boundary conditions in the SPH framework.

Fig.3: Time evolution of the mean temperatures of neon (blue) and xenon (red).

Fig.4: Time evolution of the mean densities of neon (blue) and xenon (red).
Conclusions
We developed a novel SPH model for simulating binary gas mixing, with explicit treatment of interspecies collisional momentum and energy exchange based on a kinetic relaxation model. Our results show that even a first-order scheme can yield physically consistent outcomes, capturing realistic thermal equilibration, density relaxation, and energy conservation across various test cases. The proposed framework is well-suited for multi-component systems, as it allows each gas to be modeled with its own set of Euler equations and interspecies interaction terms. This structure provides a natural pathway for extending the model to include additional physical processes, such as drag interactions with ice and dust [3]. Therefore, it offers a robust foundation for modeling gas dynamics in complex planetary science scenarios.
Acknowledgments
Work supported by the ASI-INAF grant "Attività scientifica di preparazione all'esplorazione marziana 2023-3-HH.0".
References
[1] Monaghan (2005), Rep. Prog. Phys. 68, 1703.
[2] Monaghan & Kocharyan (1995), Comput. Phys. Commun., 87, 225.
[3] Laibe & Price (2012a), MNRAS, 420, 2345
[4] Vago et al. (2017), Astrobiology, 17, 471.
[5] Maggioni et al., in preparation
[6] Gross & Krook (1956), Phys. Rev., 102, 593
[7] Vega Reyes et al. (2007), Phys. Rev.
[8] Trotter, H. F. (1959), Proc. Am. Math. Soc., 10, 545
How to cite: Maggioni, L., Teodori, M., Magni, G., Formisano, M., De Sanctis, M. C., and Altieri, F.: Gas mixing at Martian atmospheric conditions through a Smoothed Particle Hydrodynamics approach, EPSC-DPS Joint Meeting 2025, Helsinki, Finland, 7–13 Sep 2025, EPSC-DPS2025-613, https://doi.org/10.5194/epsc-dps2025-613, 2025.
Water vapor in the Martian atmosphere and its interactions with the soil have influenced the evolution of the planet’s climate and informs on its current and past habitability. However, water vapor has been directly observed in situ only by moisture sensing instruments in three landed spacecrafts: The Phoenix ’07 lander, the Mars Science Laboratory rover Curiosity and the Mars 2020 mission rover Perseverance (Polkko et al 2023). Perseverance was launched on 30 July 2020 by NASA, and landed successfully on 18th February 2021 at Jezero Crater, Mars (Lon. E 77.45° Lat. N 18.44°).
We analyze here annual and diurnal water cycles at Jezero crater on Mars during the first thousand sols of humidity observations by the Perseverance rover, bit over one and a half Martian years. The primary data source is the Mars Environmental Dynamics Analyzer (MEDA, Rodriguez-Manfredi et al 2021) sensor suite sensors: the MEDA-HS relative humidity (RH) sensor, which is located in the rover’s Remote Sensing Mast and operates at 1.5 m above the surface (Hieta et al 2022). MEDA-ATS atmospheric temperature sensors (ATS) provided air temperature at 1.5 m above the surface for modeling (Munguira et al 2024). Optical depth needed also for modeling is provided by Mastcam-Z camera (Lemmon et al 2023).
ATS observations over sol are used to calibrate an adsorptive single column model (SCM) diurnal temperature profile which also gives areal thermal inertia and albedo (Savijärvi, Harri 2021). Nocturnal RH observations are then fitted with the SCM, which then reconstructs the full diurnal water vapor cycle and its vertical distribution, which also results precipitable water column (PWC). Our modeling work focuses on locations where the rover remained stationary or within a small area for an extended period of time, thus ensuring stable soil properties and allowing for more robust averaging of HS observations over multiple sols.The SCM effectively reproduces the observation-based nighttime water vapor amounts at the modeled locations. The PWC estimated by the SCM, when adjusted to the MEDA near-surface observations, aligns well with Emirates Mars Mission (EMM) EMIRS instrument satellite data observed over Jezero at the same time (Smith et al 2022). Both SCM simulations and MEDA-HS observations produce an annual water vapor peak around Ls 150◦ - Ls 160◦ on Mars years (MY) 36 and 37.
Local topography appears to influence near-surface water vapor levels, suggesting that terrain effects should be considered when modeling the diurnal cycle in heterogeneous landscapes. On the flat Jezero crater floor, the SCM directly reproduced observed nocturnal water vapor volume mixing ratios (VMR). After the Perseverance rover began climbing out from the crater floor to higher elevations, an anomaly at early morning hours in the nocturnal VMR curve was observed. Our ”flat surface” SCM version could not reproduce this observed behavior. However, using only early night observations for SCM calibration in these cases still produced PWC which aligned well with the satellite observations.
References:
Jouni Polkko, Maria Hieta, et. al. 2023, Initial results of the relative humidity observations by MEDA instrument onboard the Mars 2020 Perseverance Rover. Journal of Geophysical Research: Planets, doi.org/10.1029/2022JE007447
Rodriguez-Manfredi, J. A., de la Torre Ju´arez, et al. 2021. The Mars Environmental Dynamics Analyzer, MEDA. A Suite of Environmental Sensors for the Mars 2020 Mission. Space Science Reviews, 217 (3), doi.org/10.1007/s11214-021-00816-9
Hieta, M., Genzer, M., Polkko et al. 2022. MEDA HS: Relative humidity sensor for the Mars 2020 Perseverance rover. Planetary and Space Science, 223 , 105590. doi: 10.1016/j.pss.2022.105590
Munguira, A., Hueso, R. et al. 2024. One martian year of near-surface temperatures at Jezero from MEDA measurements on Mars2020/Perseverance. Journal of Geophysical Research: Planets, 129 . doi: 10.1029/2024JE008385
Lemmon, M., Wolff, M., & Bell, J. 2023. Results from the optical depth imaging campaign of the Mars-2020 Perseverance rover. Bulletin of the AAS, 55 (8). https://baas.aas.org/pub/2023n8i213p09
Savijärvi, H. I., & Harri, A. M. (2021, March). Water vapor adsorption on Mars. Icarus, 357 , 114270. doi: 10.1016/j.icarus.2020.114270
Smith, M. D., Badri, K., Atwood, S. A. et al. (2022). EMIRS observations of the aphelion-season Mars atmosphere. Geophysical Research Letters, 49 . doi: 10.1029/2022GL099636
How to cite: Polkko, J. and the Author team for the Annual Water Cycle at Jezero Crater: Annual Water Cycle at Jezero Crater Based on Observations and Column modeling, EPSC-DPS Joint Meeting 2025, Helsinki, Finland, 7–13 Sep 2025, EPSC-DPS2025-249, https://doi.org/10.5194/epsc-dps2025-249, 2025.
The Remote Microscopic Imager (RMI) of the ChemCam instrument onboard Curiosity rover provides high-resolution imaging capabilities [1,2]. RMI was first designed to document the LIBS analysis on rocks and soils located at few meters from the rover. RMI progressively proved also to be a powerful long distance imaging reconnaissance tool, thanks to its 700mm focal length. In particular, a new software was uploaded in 2015 to automatically focus up to infinity, a capability which was not implemented in the original design [3].
Since then, RMI has been regularly used to investigate distant various landscapes. Among these, the so-called « Light-toned Yardang unit » [4] was first observed beginning sol 1183 (Figure 1). Several RMI image mosaics acquired up to Sol 1998 helped to identify successive sequences of aeolian deposition-erosion. This is among the youngest sedimentary layers that can be observed in Gale crater with Curiosity cameras. It is interpreted as a succession of fossil aeolian dunes and deflation surfaces [4, 5]. The Yardang unit could result from cyclic changes from semi-arid to arid conditions, including wind regime changes. No hydrated mineral has been detected from orbital imaging spectroscopy. Still, there is interest in finding out the role that water may have played in the induration and diagenesis of the rocks that make up this Yardang unit[5].
Between Sols 3671 and 4389, several new long distance RMI mosaics have been acquired while pointing at the base of the Yardang unit. The closer vantage point helps to identify multiple morphologies such as fine-scale layering, wind erosion patterns, or scallops. These features were not accessible nor resolved from orbital imagery only. They could shed light on the formation process of this massive unit. Figure 2 shows an example of a 10800x3200 pixels mosaic corresponding to an assemblage of 60 individual RMI frames which were acquired during three 20x1 sequences between Sols 4384 and 4389.
Curiosity has already driven 34 km since the landing in 2012. If Curiosity ever reaches the base of the Yardang unit [6], it would provide the opportunity to sample it directly and reveal its bulk composition, in addition to deriving information from distant geomorphological investigations.

Fig. 1: Imaging of the Yardang unit. The white line corresponds to Curiosity’s traverse. The first RMI observation toward the Yardangs occurred on Sol 1183. More systematic close-range observations were acquired later on, in particular between sols ~4000 and 4389, revealing fine-scale details on the morphologies.

Fig. 2: RMI mosaic of sequences CCAM02386, CCAM02384 and CCAM02389 acquired between Sols 4384 and 4389, and showing fine-scale layering, wind erosion patterns, or scallops.
References:
[1] Maurice et al., Space Sci. Rev. 170, 95-166, 2012.
[2] Le Mouélic et al., Icarus 249, 93-107, 2015.
[3] Perret et al., 14th International Conference on Space Operations, 2016.
[4] Le Deit et al., J. Geophys. Res. Planets, 118, 2439-2473, 2013.
[5] Dromart et al., EPSL 554, 116681, 2021.
[6] Vasavada et al., 56th LPSC, 2025.
How to cite: Le Mouélic, S., Gasnault, O., Rapin, W., Le Deit, L., Mangold, N., Johnson, J. R., Caravaca, G., Lasue, J., Fau, A., Lanza, N., Wiens, R. C., Scruderi, L., Schmauss, S., and Carpy, S.: Observing the Yardang unit at Gale crater on Mars with ChemCam’s RMI , EPSC-DPS Joint Meeting 2025, Helsinki, Finland, 7–13 Sep 2025, EPSC-DPS2025-253, https://doi.org/10.5194/epsc-dps2025-253, 2025.
The western fan of Jezero crater displays features interpreted as fluvial and deltaic sedimentary rocks from orbital data (1,2). Images obtained using the SuperCam Remote Micro-Imager (RMI) and the Mastcam-Z cameras provide in-situ observations of Jezero crater’s western fan in various locations along the Perseverance traverse. Using these tools, we show that fluvial topsets and deltaic foresets dominate sedimentary rocks of the western fan.
On the fan front, we observe a systematic stratigraphy (3): (I) The bottom of hillslopes displays recessive, light-toned deposits that are best explained as lacustrine deposits at the delta toe (bottomsets and toesets), part of the Shenandoah fm. (4). (II) The central part of the fan front hillslopes corresponds to dipping foreset beds typically developed over 20 to 25 m of vertical extension. They usually display sigmoidal geometry with steeply dipping (15-35°) sandstones and conglomerates. (III) Above the foresets various types of fluvial deposits (sandstones and conglomerates) are present, with frequent cross-bedding interpreted as topset beds. The transition between topsets and foresets corresponds to the transition from the river to the lake, marking the former lake level. Hence, we can deduce paleolake level from this architecture. At the fan front, these elevations vary from -2470 to -2500 m, in agreement with what has been deduced at the Kodiak butte, i.e., -2490 and -2500 m (5,6).
On the fan top, we observe the same two facies (II) and (III) observed at the front. For instance, Pinestand Mountain is a butte with uppermost elevation of -2448 m that contains thick bed sets (~14 and ~22 m) with up to ~35-40° dipping sigmoidal strata and textures typical of sandstones, which are interpreted as foresets. Such stratigraphy is also observed within the 1km-diameter Belva crater rims closer to the fan apex (elevation -2410 m), with a sequence of dipping layers interpreted as foresets up to 34 m high. In contrast, the Tenby outcrop is a flat, low-lying outcrop but its strata dip up to ~40°. The outcrop surface expression with arcuate beds corresponds to that observed across most of the delta top in plan-view, which is linked to the orbitally-defined “curvilinear” pattern. This unit was previously interpreted as fluvial, meandering bar deposits (7). However, in the case of meander belts, the vertical extent of these bed sets would correspond to the minimum channel water depth (e.g., 8). Here, with bed sets as high as 34 m at Belva or 22 m at Pinestand Mountain, such a process would require km-wide meanders rather than the ~100 m size bodies observed on the delta top. We therefore favor the interpretation that the “curvilinear” pattern mostly represents the surface expression of deltaic foresets, similar to those visible at Pinestand Mountain.
Overall, these strata enable us to delineate the evolution of the lake levels of Jezero paleolake, which stretch from the topmost location north of the Belva crater (-2410 m), Pinestand Mountain (-2448 m) to the lowermost elevations at Kodiak and Eastern Cape (-2500 m) (Figure 1). This evolution is related either to a progradation from top to bottom during forced regression (lake level fall from -2410 m to -2500 m) or a retrogradation from bottom to top (lake transgression from -2500 m to -2410 m). Yet, terrestrial examples of deltas formed by transgression show that the fluvial topsets are buried below the subsequent foreset beds. No observation here shows such a geometry. In contrast, we observe both truncation of foresets by fluvial topsets and superimposition of steep foresets on gently dipping foresets that were deposited previously. Both geometries are typical of progradation during lake level fall (forced regression). Such a scenario has implications for the chemical evolution of the lake, for instance the formation of evaporitic minerals during the drying out of the lake.
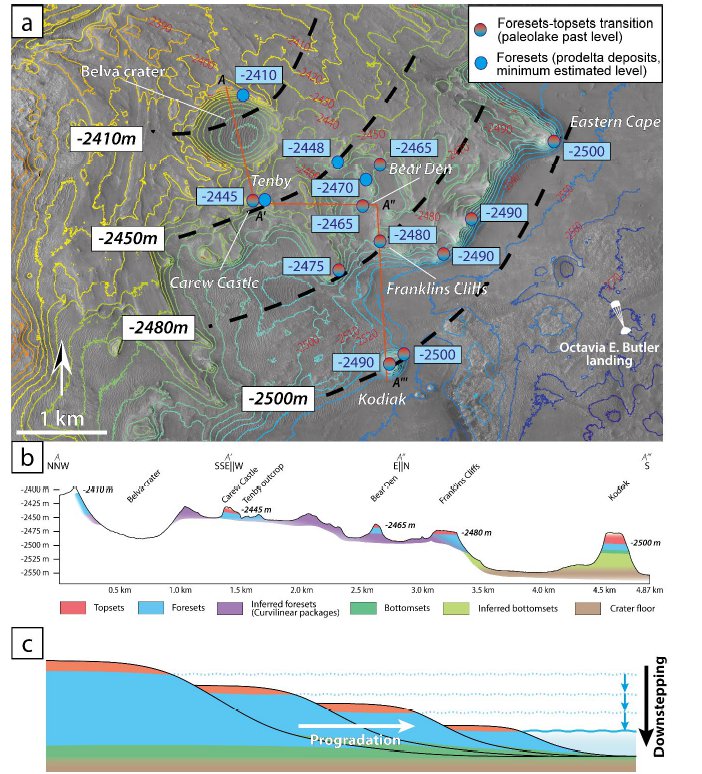
Figure 1: (a) Map of the western delta of Jezero with topographic contours in color. Elevations in blue boxes indicate the benchmarks of the paleolake level (topset-foreset transition, red-blue disks) or minimum paleolake elevation (foresets only, blue disks). The elevations in white boxes and the related black, dashed lines are extrapolations of these elevations showing a consistent downstepping from -2410 m at the fan top (Belva crater) toward -2500 m at the Eastern Cape and at Kodiak. (b) Schematic cross-section of the area highlighting the local deltaic morphologies expressed and corresponding paleo-lake levels. (c) Interpretative sketch of a deltaic downstepping sequence during a forced regression (adapted from 9).
References:
(1) Stack et al., 2020, Space Sci. Rev. 216(8), 127. (2) Goudge et al., 2018, Icarus 301, 58-75. (3) Mangold et al., 2024, JGR-Planets, 129, e2023JE008204. (4) Stack et al., (2024), 129, e2023JE008187, (5) Caravaca et al., 2024, JGR-Planets, 129, e2023JE008205. (6) Mangold, Gupta et al., 2021, Science, 374, 711-717. (7) Schon et al., 2012, Planet. Space Sci., 67, 28-45. (8) Ghinassi et al., 2016, Sedim. Geology, 334, 66-96. (9) Winsemann, J., et al., 2018, Bores, 47, 973-1002.
How to cite: Mangold, N. and Caravaca, G. and the Perseverance rover Mars 2020 Delta observation sub-team: Paleolake variations of Lake Jezero, Mars, recorded by the deltaic architecture of Jezero crater western fan, EPSC-DPS Joint Meeting 2025, Helsinki, Finland, 7–13 Sep 2025, EPSC-DPS2025-217, https://doi.org/10.5194/epsc-dps2025-217, 2025.
Volatiles, such as chlorine (Cl), are important species that are easily mobilized by fluids and thus play a key role in alteration processes on Mars [1]. The first detections of Cl were made in the 1970’s by the Viking 1 & 2 X-ray fluorescence (XRF) spectrometers. The ɑ-proton x-ray spectrometer (APXS) instruments onboard the Mars Pathfinder (Sojourner), Mars Exploration rovers (Spirit & Opportunity), and the Curiosity rover continued to document Cl at their respective landing sites [2,3,4,5,6]. The Phoenix mission also detected Cl mainly in the form of soluble perchlorates and chlorides in the soil at its landing site [7]. The coexistence of soluble perchlorate and chloride salts in the soils of the Phoenix landing site is highly relevant for the redox potential point of view. The PIXL instrument onboard Perseverance produced Cl maps that show the Cl-rich regions overlapping sodium.
The SuperCam instrument onboard the Perseverance rover has been collecting Laser Induced Breakdown Spectroscopy (LIBS) data along our traverse for almost 1500 sols, with an elevation increase of 700 meters from the crater floor up to the crater rim. During this time, we have obtained more than 700 Cl-bearing points in approximately 310 targets which have all been quantified. LIBS has the ability to detect Cl above 0.8 wt.% using the model developed by Wolf et al., (2025) [8]. All LIBS data collected by SuperCam were quantified and categorized by geologic unit and rock type. Results show that Jezero crater has higher average Cl concentrations in soil, rock exterior, and rock interiors compared to previous landing sites. Results also show that Cl is highest in the rock interiors on the crater floor at the lowest elevation of -2500 meters in the Máaz formation. Raman data collected in abraded patches of Máaz formation confirmed that one of the phases of Cl present on the crater floor is Na-perchlorate [9]. The presence of perchlorate salts in the pores of the rocks suggest the past presence of perchlorate-rich fluids in contact with the basaltic rocks of Máaz formation when the crater floor was covered by water. Quantified values show rock interiors on the crater floor have up to nearly 6 wt.% Cl, with an average concentration that is higher than all other geologic units including analyses on soils, rock exteriors, and rock interiors. This demonstrates a unique aqueous alteration history in Jezero crater, Mars compared to the landing sites of other rovers.
References:
[1] Williams, J. T., Shearer, C. K., Sharp, Z. D., Burger, P. V., McCubbin, F. M., Santos, A. R., ... & McKeegan, K. D. (2016). The chlorine isotopic composition of Martian meteorites 1: Chlorine isotope composition of Martian mantle and crustal reservoirs and their interactions. Meteoritics & Planetary Science, 51(11), 2092-2110.
[2] Soffen, G. A. (1977). The viking project. Journal of Geophysical Research, 82(28), 3959-3970.
[3] Golombek, M. P., Cook, R. A., Economou, T., Folkner, W. M., Haldemann, A. F. C., Kallemeyn, P. H., Knudsen, J. M., Manning, R. M., Moore, H. J., Parker, T. J., Rieder, R., Schofield, J. T., Smith, P. H., & Vaughan, R. M. (1997). Overview of the Mars Pathfinder mission and assessment of landing site predictions. Science, 278(5344), 1743-1748. https://doi.org/10.1126/science.278.5344.1743
[4] Arvidson, R. E., Ruff, S. W., Morris, R. V., Ming, D. W., Crumpler, L. S., Yen, A. S., ... & McLennan, S. M. (2008). Spirit Mars rover mission to the Columbia Hills, Gusev Crater: Mission overview and selected results from the Cumberland Ridge to Home Plate. Journal of Geophysical Research: Planets, 113(E12). https://doi.org/10.1029/2005JE002499
[5] Rieder, R., et al. (2004), Chemistry of rocks and soils at Meridiani Planum from the Alpha Particle X-ray Spectrometer, Science, 306, 1746–1749, doi:10.1126/science.1104358
[6] Litvak, M. L., Mitrofanov, I. G., Gellert, R., Djachkova, M. V., Lisov, D. I., Vasavada, A. R., & Czarnecki, S. (2023). Depth distribution of chlorine at Gale crater, Mars, as derived from the DAN and APXS experiments onboard the Curiosity rover. Journal of Geophysical Research: Planets, 128, e2022JE007694. https://doi.org/10.1029/2022JE007694
[7] Hecht, M. H., Kounaves, S. P., Quinn, R. C., West, S. J., Young, S. M., Ming, D. W., ... & Smith, P. H. (2009). Detection of perchlorate and the soluble chemistry of martian soil at the Phoenix lander site. Science, 325(5936), 64-67. https://doi.org/10.1126/science.1172466
[8] Wolf, Z. U., Madariaga, J. M., Clegg, S., Legett, C., Arana, G., Gabriel, T. S. J., Poblacion, I., Forni, O., Gasnault, O., Anderson, R., Clavé, E., Schröder, S., Cousin, A., Wiens, R. C. (2025) Chlorine in Jezero Crater, Mars: Detections made by SuperCam. 56th Lunar and Planetary Science Conference. Abstract #2456
[9] Meslin, P.-I., Forni, O., Beck, P., Cousin, A., Beyssac, O., Lopez-Reyes, G.,... & Zorzano, M.-P. (2022) Evidence for perchlorate and sulfate salts in Jezero Crater, Mars from SuperCam observations. 53rd Lunar and Planetary Science Conference. Abstract #2494
How to cite: Wolf, Z. U., Arana, G., Madariaga, J. M., Clegg, S., Legett, C., Poblacion, I., Bedford, C., Gabriel, T. S. J., Forni, O., Gasnault, O., Anderson, R., Clavé, E., Schröder, S., Cousin, A., and Wiens, R. C.: SuperCam Chlorine Detections on the Jezero Crater Floor, EPSC-DPS Joint Meeting 2025, Helsinki, Finland, 7–13 Sep 2025, EPSC-DPS2025-903, https://doi.org/10.5194/epsc-dps2025-903, 2025.
The formation of craters on the surface of Mars is primarily attributable to the impact of celestial bodies. This impact results in the generation of elevated temperatures and pressures, resulting in the formation of high-temperature and high-pressure minerals [1]. This is the case of the Jezero crater, landing site of the Mars 2020 mission's Perseverance rover. This rover is currently analyzing the crater rim of the mentioned crater, an area where high-pressure minerals may be present.
One of the techniques on board the rover is Raman spectroscopy, which is part of the SuperCam and SHERLOC instruments. This technique can determine the presence of high-pressure minerals by analyzing the shift of the Raman bands. In some cases, calibrating the Raman band position, the pressure to which certain compounds were subjected can be estimated. However, it should be noted that not all minerals behave in the same way in Raman spectroscopy when subjected to high-pressures. On the one hand, some minerals are transformed into other mineral phases because of high-pressure, usually their corresponding high-pressure polymorphs. On the other hand, other minerals exhibit a shift in the position of their Raman bands towards higher wavenumbers when exposed to high-pressures.
This study presents a compilation of minerals under high-pressure conditions that may likely be found on the Jezero crater rim and their behavior as observed through Raman spectroscopy.
Table 1 summarizes a selection of the minerals most likely to be encountered on Mars which, upon exposure to high-pressures, are known to undergo phase transformations. The table lists the high-pressure mineral name, the Raman band position of this mineral, the pressure and/or temperature at which it is formed and the original mineral from which the new mineral phase is formed.
Conversely, Table 2 displays the minerals that exhibit Raman shift towards higher wavenumbers when subjected to high-pressure conditions. The mineral names, the position of the Raman band at ambient conditions, the position of the Raman band at the maximum pressure studied in the literature and the value of this pressure, are included in the table.
Table 1. High-pressure minerals [2,3].
Table 2. Minerals whose Raman bands shift to higher wavenumbers with pressure [4,5,6].
It is important to note that certain compounds may also undergo Raman band movements due to cation exchange. This is the case of feldspar, siderite, calcite, magnesite and dolomite in Table 2. However, it may be considered that Raman band shifts can occur due to cation exchanges or enrichments. Therefore, detected Raman shifts must be always studied in parallel to elemental characterization and stoichiometric calculations to attribute an accurate origin to the observed wavelength movement. In the case of Perseverance rover, LIBS (laser-induced breakdown spectroscopy) MOC (major-element composition) values can be crucial for the Raman spectroscopy accurate result interpretation at the Crater Rim.
It is worthy to highlight that some of these minerals have been identified in Martian meteorites, such as maskelynite in the NorthWest Africa (NWA) 1195 meteorite [7], coesite in the NWA 8657 [8] or high-pressure calcite [9]. Given the prevalence of these minerals in samples with a Martian origin, there is a high probability of their occurrence in crater rims on the planet's surface.
References
[1] Pang, RL., Zhang, AC. et al. High-pressure minerals in eucrite suggest a small source crater on Vesta. Sci Rep 6, 26063 (2016). https://doi.org/10.1038/srep26063
[2] Manuputty, M.Y., Dreyer, J.A. et al. Polymorphism of nanocrystalline TiO2 prepared in a stagnation flame: formation of the TiO2-II phase. Chem. Sci. 5 (2019). http://xlink.rsc.org/?DOI=c8sc02969e.
[3] Ohtani, E., Kimura, Y. et al. Formation of high-pressure minerals in shocked L6 chondrite Yamato 791384: constraints on shock conditions and parent body size. Earth Planet. Sci. Lett. 227, 3-4, 505-515 (2004). https://doi.org/10.1016/j.epsl.2004.08.018.
[4] Coloma, L., Aramendia, J. et al. Raman calibration of shocked Ca-, Mg- and Fe-carbonates. Tenth International Conference on Mars 2024, 3007.
[5] Sims, M., Johnson, J.R. et al. Unconventional high-pressure Raman spectroscopy study of kinetic and peak pressure effects in plagioclase feldspars. Phys. Chem. Miner. 47 (2020). https://doi.org/10.1007/s00269-020-01080-z.
[6] Johnson, J.R., Jaret, S.J. et al. Raman and infrared microspectroscopy of experimentally shocked basalts. J. Geophys. Res. Planets. 125, 2 (2020). https://doi.org/10.1029/2019JE006240.
[7] Ray, D., Misra, S. et al. Maskelynite- as seen in shocked Lonar target basalt, India, and martian and lunar meteorites. Geochem. 84, 2 (2024). https://doi.org/10.1016/j.chemer.2024.126127.
[8] Hu, S., Li, Y. et al. Discovery of coesite from the martian shergottite Northwest Africa 8657. Geochim. Cosmochim. Acta. 286, 404-417 (2020). https://doi.org/10.1016/j.gca.2020.07.021.
[9] Coloma, L., García-Florentino, C. et al. Development of non-destructive analytical strategies based on Raman spectroscopy and complementary techniques for Mars Sample Return tested on Northwest Africa 1950 Martian meteorite. J. Raman Spectrosc. 53, 12, 2068-2085 (2022). https://doi.org/10.1002/jrs.6445.
Acknowledgements
This work is supported by the PAMMAT project “Alteration processes in Mars and Moon Meteorites, and Terrestrial Analogues at different environments: Mars2020, Rosalind Franklin and Returned Samples from Mars and Moon” (Grant No. PID2022-142750OB-I00), funded by the Spanish Agency for Research (through the Spanish Ministry of Science and Innovation, MCIN, and the European Regional Development Fund, FEDER, MCIN/AEI/10.13039/501100011033/FEDER,UE), and the Strategic Project “Study of Alteration Processes in Terrestrial and Planetary Materials” (Grant No. UPV/EHU PES21/88), funded by the UPV/EHU.
How to cite: Coloma, L., Aramendia, J., Alberquilla, F., Población, I., Manrique, J. A., Arana, G., Madariaga, J. M., Clavé, E., Lopez-Reyes, G., Sharma, S. K., Johnson, J. R., Cousin, A., Wiens, R., and Working Group, R. W. G.: Raman spectroscopy as a tool to identify high-pressure minerals, implications for the Mars2020 mission, EPSC-DPS Joint Meeting 2025, Helsinki, Finland, 7–13 Sep 2025, EPSC-DPS2025-1708, https://doi.org/10.5194/epsc-dps2025-1708, 2025.
Introduction: ESA and NASA will launch ExoMars Rosalind Franklin rover mission to Oxia Planum on Mars. Oxia is a Noachian, phyllosilicate-bearing plainM located between Mawrth Vallis and Ares Vallis [1]. ExoMars will be first mission to perform ground truth measurements of truly Noachian phyllosilicate deposits and is expected to address past water-rich environment and habitability of Mars [2]. The Fe,Mg-rich phyllosilicate surfaces detected at Oxia Planum are some of the largest continuous exposures of this type on Mars. One of the key aspects with relevance to martian evolution is to understand processes that led to formation of so extensive, homogeneous deposits.
Orbital NIR spectral features of the phyllosilicates at Oxia suggest Fe-rich vermiculite and/or saponite [3]. To prepare for the exploration of Oxia Planum and future scientific investigations, characterization of analogue material is needed. Survey of Fe-rich terrestrial vermiculite-bearing rocks [4,5] showed that the best spectral analogy is shown by the basaltic rocks from Granby, Massachusetts, USA. The Granby formation is represented by basaltic flows, dikes and tuffs, all of which hydrothermally altered. Amygdales in vesicular basalts are filled with Fe-rich clay and similar Fe-rich clay material, although much more fine-grained is present as dispersed alteration of glass in tuff [6].
As identified by previous research [4] based on spectral bands between 2.3 and 2.5 μm in the near-infrared region and characteristic X-ray diffraction peaks, Fe-rich clay in Granby rocks is vermiculite±saponite, Phyllosilicates are intergrowing in various proportions in amygdales and tuff. This study provides a more detailed characterization of the phyllosilicate constituents. The aims is to demonstrate the potential of flight-ready technology on ExoMars mission for deciphering the alteration pathway for vermiculite formation and also to understand how relevant for Oxia can Granby analogue be in terms of phyllosilicate formation process.
Method: Mineralogy of two amygdular and tuffaceous samples of Granby was characterized in-situ (as opposed to bulk powder analyses of 4) at a micrometer scale using the laboratory emulator of the Raman Lasers Spectrometer (RLS-Sim) [7] and the spare flight model (FS) of the visible/near-infrared (VNIR) reflectance MicrOmega spectrometer onboard the ExoMars Rosalind Franklin rover.
Additionally, detailed analysis of chemical composition of minerals was performed using SEM-EDX mapping of the exact same surfaces as ones imaged by VNIR and Raman. SEM-EDX can serve as a context for interpretation of data from flight spare instruments and it provides ground-truth information on capabilities and limitations of onboard instruments. Analyzed areas were up to 5 mm x 1 cm in size.
Results: VNIR hyperspectral imaging shows abundant occurrences of phyllosilicate spectrally similar to vermiculite. Strength of characteristic vibrations changes locally, reflecting perhaps crystallinity degree of phyllosilicate. In a few spots, Al-phyllosilicate is also seen, especially in large infilled amygdales.
Raman spectroscopy detects feldspar, that can be defined as albitic in composition based on Raman shift peaks positions. Additionally, peaks suggestive of a mica, perhaps muscovite are present. In multiple places, fine-scale intergrowths of feldspar and muscovite are present, what is manifested by overlap of peaks from two phases in individual analytical spots.
Spatial correlation of the two datasets, VNIR and Raman, suggests that vermiculite, feldspar, muscovite and Al-rich clay are overgrown with each other, although no sufficient textural context is given allowing to infer on alteration sequence and replacements among the minerals.
Context SEM-EDX mapping identifies muscovite and biotite crystals embedded in feldspathic glass, extensively altered to Fe,Mg-clay. In places, zonal Al composition of mica is seen, indicative of leaching during the alteration. Textural and compositional information from SEM shows that biotite and muscovite were destabilized by feldspar or glass, most likely during hydrothermal alteration stage. Saponite or chlorite were most likely formed in this alteration stage as well, particularly in amygdales. In a following stage, most likely during surface weathering, muscovite, biotite and chlorite were altered to vermiculite.
Relevance for Oxia Planum: Tuffs and amygdular basalts from Granby are very good NIR spectral analogue to deposits at Oxia Planum as originally suggested [4,5]. The phase identified by VNIR micrOmega instrument and confirmed by laboratory characterization as Fe-vermiculite (±saponite), perhaps well reflects mineralogy of vast phyllosilicate deposits at Oxia. Is, however, Granby, an analogue for Oxia in terms of process that led to phyllosilicate deposits formation? History of Granby may be more complex that the one of Oxia, based on the higher heterogeneity of mineralogy of Granby as seen in scale of hand-size sample. On the other hand, one can question the apparent homogenous composition of Oxia Planum clays or its possible cryptic heterogeneity, both due to the scale at which it is currently investigated [e.g., 1,3].
Our study indicates some aspects that can be analogous for process of phyllosilicate deposits formation. Deposits at Oxia can be – as Granby Tuff – related to hydrothermal alteration of basalts and ashes. In such case, i.e, if in-situ observations by ExoMars rover collects information suggestive of volcanic ash at the plain, in-situ investigations should focus on amygdales and glasses to address alteration processes in details. Furthermore, our research demonstrates the value of using multiple analytical techniques in a coordinated approach to characterize complex geological samples. By combining mineralogical and chemical analyses, we can obtain a more comprehensive understanding of the samples' composition and formation history.
Acknowledgments: This project was supported by the EU Horizon 2020 Space program call H2020-COMPET-2015-Grant Agreement no 687302. The study got support from the National Planetology Program (PNP) of the INSU-CNRS and from the CNES Research Proposal Call (APR).
References: [1] P. Fawdon et al., (2024) Journal of Maps 20(1). [2] J. Vago et al., (2017) Astrobiology 17:6-7. [3] L. Mandon et al, (2021) Astrobiology 21: 464-480. [4] A.M. Krzesińska et al, (2021) Astrobiology 21: 997-1016. [5] H. Dypvik et al, (2021) Planetary and Space Science, 208. [6] R. H. April and D. M. Keller (1992). Clays and Clay Minerals 40: 22-31. [7] G. Lopez-Reyes et al., (2021) Journal of Raman Spectroscopy 53: 382-395.
How to cite: Bultel, B., Krzesinska, A., Veneranda, M., Loizeau, D., and Werner, S.: Deciphering the alteration processes by micro-scale characterization of vermiculite-rich sample from Granby Tuff, an analogue to Noachian clay deposits at Oxia Planum, EPSC-DPS Joint Meeting 2025, Helsinki, Finland, 7–13 Sep 2025, EPSC-DPS2025-1550, https://doi.org/10.5194/epsc-dps2025-1550, 2025.
Introduction:
Rovers have traversed over 100 kilometers of the Martian surface, assembling an expansive archive of over one million high-quality imagery of sedimentary features in diverse geologic settings.1 These images record fine sediment grains (0.5-2 mm in diameter) shaped by their billions of years of surface processes. Studying grain morphology offers insight into sediments’ origins and deposition, crucial to reconstruct regional climatic histories.2
Grain size and form indicate transport history and paleo-depositional environments, making them fundamental expressions of Mars’ climatic and hydrological evolution.3,4 While previous studies classify individual rock outcrops along the rovers’ traverses, broader questions about sedimentary grain variability across the Martian surface remain unanswered. This project addresses that gap by applying deep learning to quantify grain morphometry across rover imagery, enabling us to extrapolate a novel large-scale sedimentary analysis.
Data & Methods:
We assess imagery from NASA’s Spirit, Opportunity, Curiosity, and Perseverance rovers which are each equipped with optical cameras meant for geologic investigation. The rovers have collectively returned across more than 13,000 sols that capture a wide range of morphological features including volcanic, aeolian, lacustrine, deltaic, and fluvial systems.3,4 We classified grains using five widely-accepted metrics in Martian sedimentology: grain size distribution (D50, D84), axial ratio (Ra), circularity (IR), convexity (C), and roundness (P).4,5,6,7 These characteristics allow us to infer transport histories, and determine environments—alluvial fan/fluvial, deltaic, lacustrine, aeolian, and crater floor/wall deposits.
To automate grain form identification, we use a deep learning image segmentation model and high-quality unobstructed images from NASA’s Planetary Data Sciences Imaging node.8 Our work builds on the precedent of other domain-adapted deep learning models on Mars9 but shifts the focus to finer geologic units. We adapted the Segment Anything Model (SAM2), a vision transformer by Meta AI Research that uses global self-attention to contextualize local features and perform general-purpose segmentation.10 Unlike conventional convolutional neural networks, SAM2 is adept in complex, cluttered scenes, ideal for Martian surface imagery, and pixel-level segmentation is possible without retraining the model extensively. This circumvents the need for densely labeled training data, the likes of which do not exist for Martian sediments, and helps enable flexible, semi-supervised or even unsupervised workflows that can still produce geologically meaningful outputs. This significantly lowers the barrier to entry for planetary-scale sediment analysis and allows us to scale insights without exhaustive manual input.
We further adapted SAM2 using a transfer learning strategy, drawing upon Segment Every Grain, an open-source Earth-based framework that applies SAM2 to cobble-sized sediment segmentation.11 We retrain the model on a subset of annotated rover imagery, enabling us to specialize the model according to the Martian surface. Reliably detected grains’ morphometric features can then be recorded, and linked to metadata about rover location and image characteristics to populate datasets for spatial and temporal analyses.
Results & Discussion:
By automating grain-scale segmentation, we anticipate a large-volume dataset that allows us to compare sediment characteristics across diverse Martian terrains and enables large-scale sediment provenance and transport studies that are otherwise infeasible via manual analysis. Our preliminary results suggest that SAM2 is effective in the identification of grains: the figure below demonstrates an image of Martian sediment and the identification of grains within the image that are then classified according to morphometric qualities.
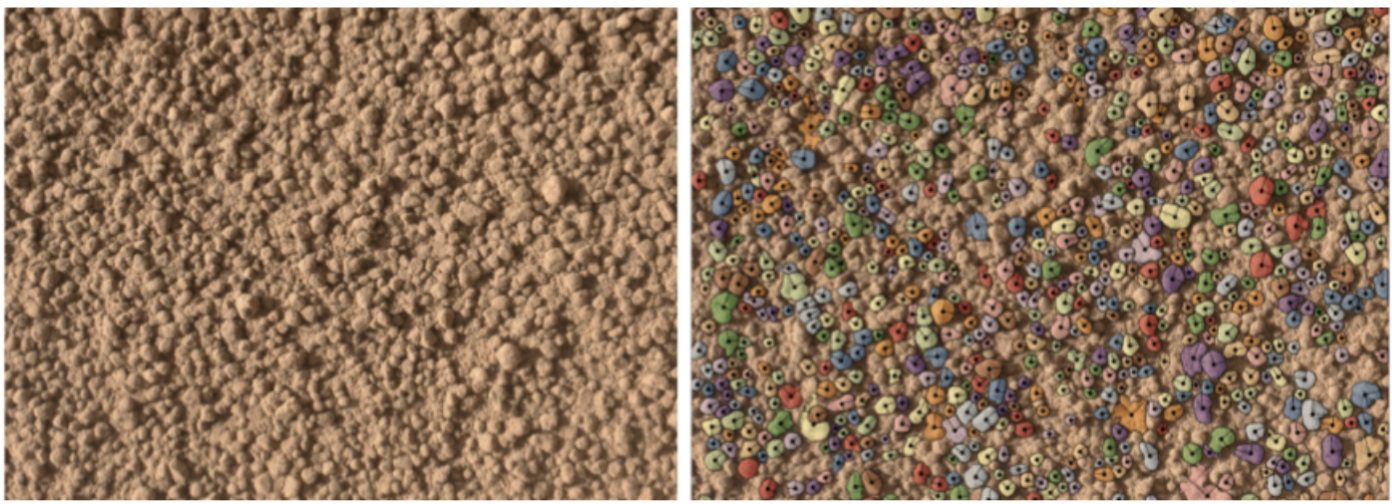
Figure 1: Left demonstrates the image before segmentation, showing a dense cluster of pebble-sized clasts. The right panel demonstrates several correctly-identified grains from which morphometric quantities were extracted using SAM2.
Anticipated results include a novel geospatial distribution of styles of grain processing and their correlations to inferred depositional systems. This opens new frontiers for regional climatic reconstructions in a new light. Beyond Mars, this work contributes broadly to planetary science, sedimentology, and machine vision. Such automated grain-scale analysis could be extended to other planetary bodies. Likewise, the methodology could help advance Earth-based geoscience, including fluvial transport modeling, coastal erosion studies, and landslide prediction.3 All code, models, and processed datasets from this project will be made open-source to support future research and maximize scientific return from planetary imagery, encouraging community-driven development.
References:
[1] Rice, M. S., et al. (2017), Geologic overview of the Mars Science Laboratory rover mission at the Kimberley, Gale crater, Mars, J. Geophys. Res. Planets, 122, 2–20.
[2] Wadell, H. (1932). Volume, Shape, and Roundness of Rock Particles. The Journal of Geology, 40(5), 443–451.
[3] Attal, M., and J. Lavé (2009), Pebble abrasion during fluvial transport: Experimental results and implications for the evolution of the sediment load along rivers, J. Geophys. Res., 114, F04023.
[4] Szabó, T., Domokos, G., Grotzinger, J., et al (2015), Reconstructing the transport history of pebbles on Mars. Nat Commun 6, 8366.
[5] Yingst, R. A., et al. (2013), Characteristics of pebble- and cobble-sized clasts along the Curiosity rover traverse from Bradbury Landing to Rocknest, J. Geophys. Res. Planets, 118, 2361–2380.
[6] Palucis, M. C., W. E. Dietrich, A. G. Hayes, R. M. E. Williams, S. Gupta, N. Mangold, H. Newsom, C. Hardgrove, F. Calef III, and D. Y. Sumner (2014), The origin and evolution of the Peace Vallis fan system that drains to the Curiosity landing area, Gale Crater, Mars, J. Geophys. Res. Planets, 119, 705–728.
[7] Gupta, S., & Farley, K. (2021). Mars 2020 Mission: Geology of Jezero crater and Outside Jezero and Sampling on a notional Mission Traverse Mars 2020 Mission Objectives, 1–30.
[8] NASA JPL and USGS. (2025). Rover Data Archives. PDS Cartography and Imaging Sciences Node.
[9] Panambur, T., and M. Parente (2025). Enhancing Martian Terrain Recognition with Deep Constrained Clustering, arXiv e-prints, 2503.17633.
[10] Meta AI. (2023). SegmentAnything Model (SAM) 2 [Computer software].
[11] Sylvester, Z. (2024). segmenteverygrain (Version 0.2.1) [Computer software].
How to cite: Gandhi, S., Hayes, A., Krishna, M., Rogers, E., and Koeppel, A.: From Imagery to Insight: Machine Learning for Grain-Scale Sediment Analysis on Mars, EPSC-DPS Joint Meeting 2025, Helsinki, Finland, 7–13 Sep 2025, EPSC-DPS2025-1752, https://doi.org/10.5194/epsc-dps2025-1752, 2025.
Introduction. Rockfalls occur when a boulder moves downhill and its trajectory leaves an imprint in the substrate observed in orbital imagery. Rockfalls were observed on Mars [e.g. 1], but because they appear as small features even in the highest-resolution images which additionally only cover only a few percent of the planet, they are one of the most understudied mass wasting processes. An important example is the area of Oxia Planum, the future landing site of the European Space Agency’s ExoMars Rosalind Franklin rover, which has been thoroughly searched for isolated boulders [2] but no rockfalls have ever been found. Here, we report on the discovery of rockfalls in various areas of Oxia Planum. We also address the following questions: 1) What drives these rockfalls? 2) What can we learn from them about the geotechnical properties of the shallow subsurface of Oxia Planum? 3) Do they pose any threats / constitute exciting exploration opportunities to the upcoming ESA ExoMars Rosalind Franklin Rover?
Observations & analysis. The search region covers a large area around the ExoMars 2022 landing characterization envelope (white contour in Fig.1), namely [13-23oN, 330-340oE]. The highest resolution (max. 0.25m/px) HiRISE dataset [3] is required to detect a rockfall. The same semi-automatic method (i.e. deep learning followed by a human review), which resulted in the first global rockfall catalog recently published by our team [4], was used to produce additional 3862 candidates at a lower confidence. We reviewed them to identify the first 48 rockfalls and then manually searched 14 HiRISE images, which expanded the dataset to 258 rockfalls. Rockfall mapping and geospatial measurements of clasts and tracks were done with QGIS [5]. Those feed the modeling of bearing capacity with Terzaghi equations for spherical loads [6]. In order to assess the scale of fragmentation due to cratering, we also use the results of iSALE shock physics code simulations of 50 m diameter craters [7].
Rockfall characteristics. Most boulders are < 2.5 m in diameter (the largest we found: 8 m dia.) and leave tracks <0.5 km long. For a small subset of rockfalls with discernable shadows (11) we were able to estimate track depths with a shadow length method. Qualitatively, track depths similar to boulder sizes are the evidence of rockfall freshness and geological youth.
Locations. The locations of rockfalls in the proximity to the landing characterization area are shown in Figure 1. We identify 48 sources of rockfalls: large primary craters (5), secondary crater clusters (33), mounds (3) and other landforms with slopes (2) (see examples in Figure 2). Of particular interest is the observation of a high abundance of primary/secondary craters [8] and mounds [9] which have already been mapped in the region (Figure 1).
Drivers. Various preparatory and triggering factors can be driving rockfall activity. Source locations reveal that cratering certainly promotes rockfall formation in the region. Craters are 3.3 times more abundant in the north of the study region than in the south, and their sizes peak at 25-50 m diameter. Recent impact simulations producing 50 m diameter craters show target fragmentation to as far as 2-4 crater radii [7]. We estimate the density of fragmentation networks and infer that they could prepare clasts for mass wasting. Other factors such as hydraulic deformation, thermal stresses, tectonic features, new impacts, and marsquakes will also be discussed at the meeting.
Geotechnical properties. We use our geospatial measurements of rockfalls to model bearing capacity in the region, which depends on gravity, track depth, boulder diameter, and regolith properties such as density, cohesion and angle of friction. We assume the values for the latter to be analogical to the Gale crater [10], and show how bearing capacity changes with depth in Figure 3. The estimates range from 50-150 kPa.
Implications for the mission. It is very likely that numerous rockfalls have yet to be found in the landing characterization area and that they could coincide with the trajectory of exploration of the rover. The data collected by a rover at rockfall sites could open up new types of investigations. For example, rockfalls can increase sample diversity to units that would otherwise require a steep climb. Rockfalls also excavate material partly shielded from radiation from the 1-2 m depths. Moreover, the rover could test assumptions that are widely used to extract geotechnical properties of soil from rockfall characteristics observed by spacecraft. Our estimates of those properties indicate that rover wheels, which exert contact pressure of 11 kPa, can safely operate in Oxia Planum.
References. [1] Roberts et al. (2012), JGR, 117, E02009.[2] Masterpietro et al. (2020), 10.1134/S0038094620060040 [3] McEwen et al. (2007). JGR, 112, E05S02. [4] Bickel et al. (2024), 10.1029/2024GL110674 [5] www.QGIS.org [6] Terzaghi (1943), 10.1002/9780470172766.ch8 [7] Sokołowska et al. (2025), 10.1029/2024JE008561 [8] Grindrod et al. (2025), this meeting. [9] McNeil et al. (2022), 10.1029/2022JE007246 [10] Arvidson et al. (2014), 10.1002/2013JE004605.
Acknowledgements. This work was funded by the NASA MDAP grant #80NSSC22K1086. Special thanks to E. Sefton-Nash.
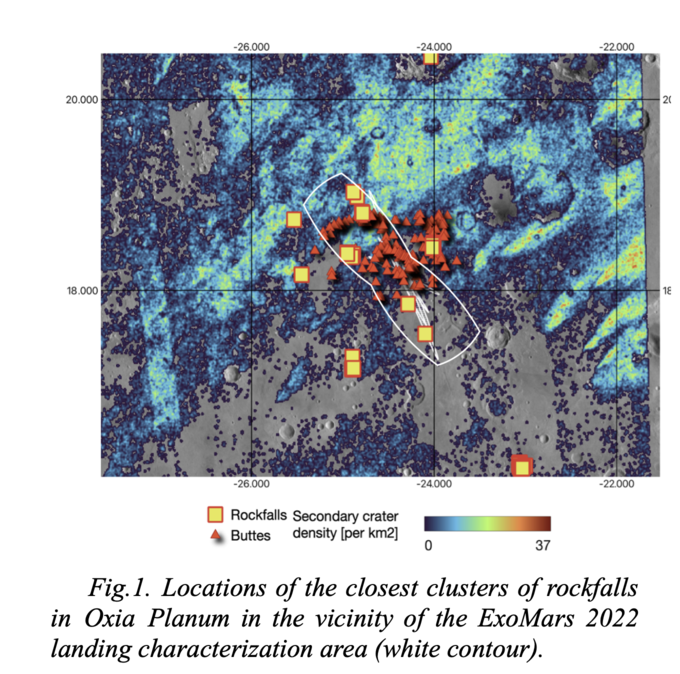
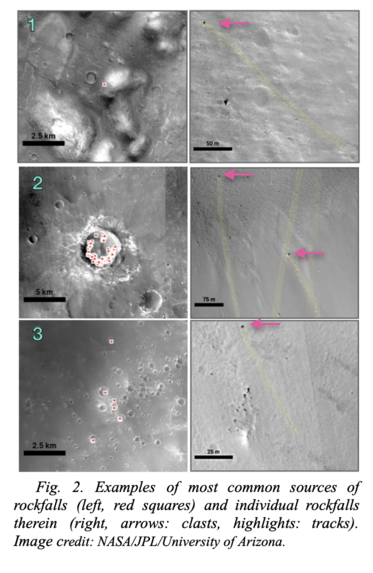
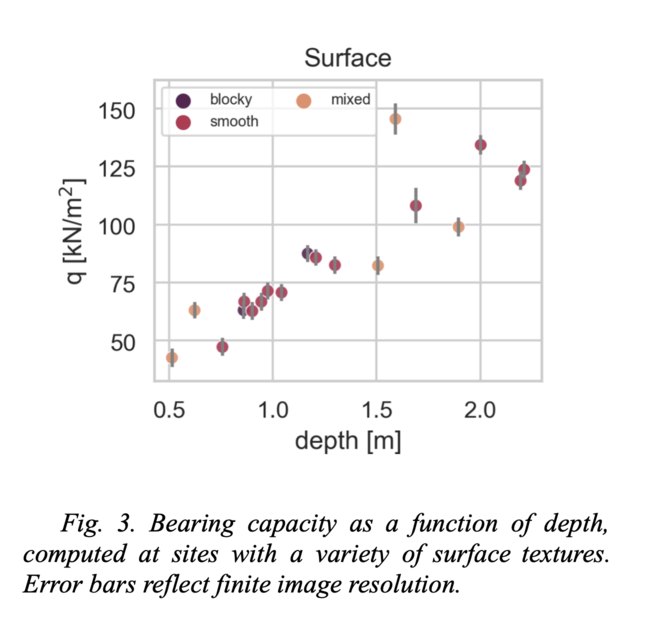
How to cite: Sokolowska, A., Daubar, I., Bonab, A., Haut, I., Bickel, V., Fawdon, P., Grindrod, P., and Conway, S.: Will Rosalind Franklin See The Rolling Stones?, EPSC-DPS Joint Meeting 2025, Helsinki, Finland, 7–13 Sep 2025, EPSC-DPS2025-1727, https://doi.org/10.5194/epsc-dps2025-1727, 2025.
Introduction: Finding signs of life elsewhere is one of the most important scientific objectives of our time.
ExoMars was conceived to answer one question: Was there ever life on Mars? All project design decisions have focused and continue to centre on the achievement of this single scientific goal. The Rosalind Franklin Mission (RFM) is a re-establishment of the ExoMars 2022 mission [1]. In a new partnership with NASA, RFM is on schedule for launch in the latter part of 2028 and landing at Oxia Planum in 2030.
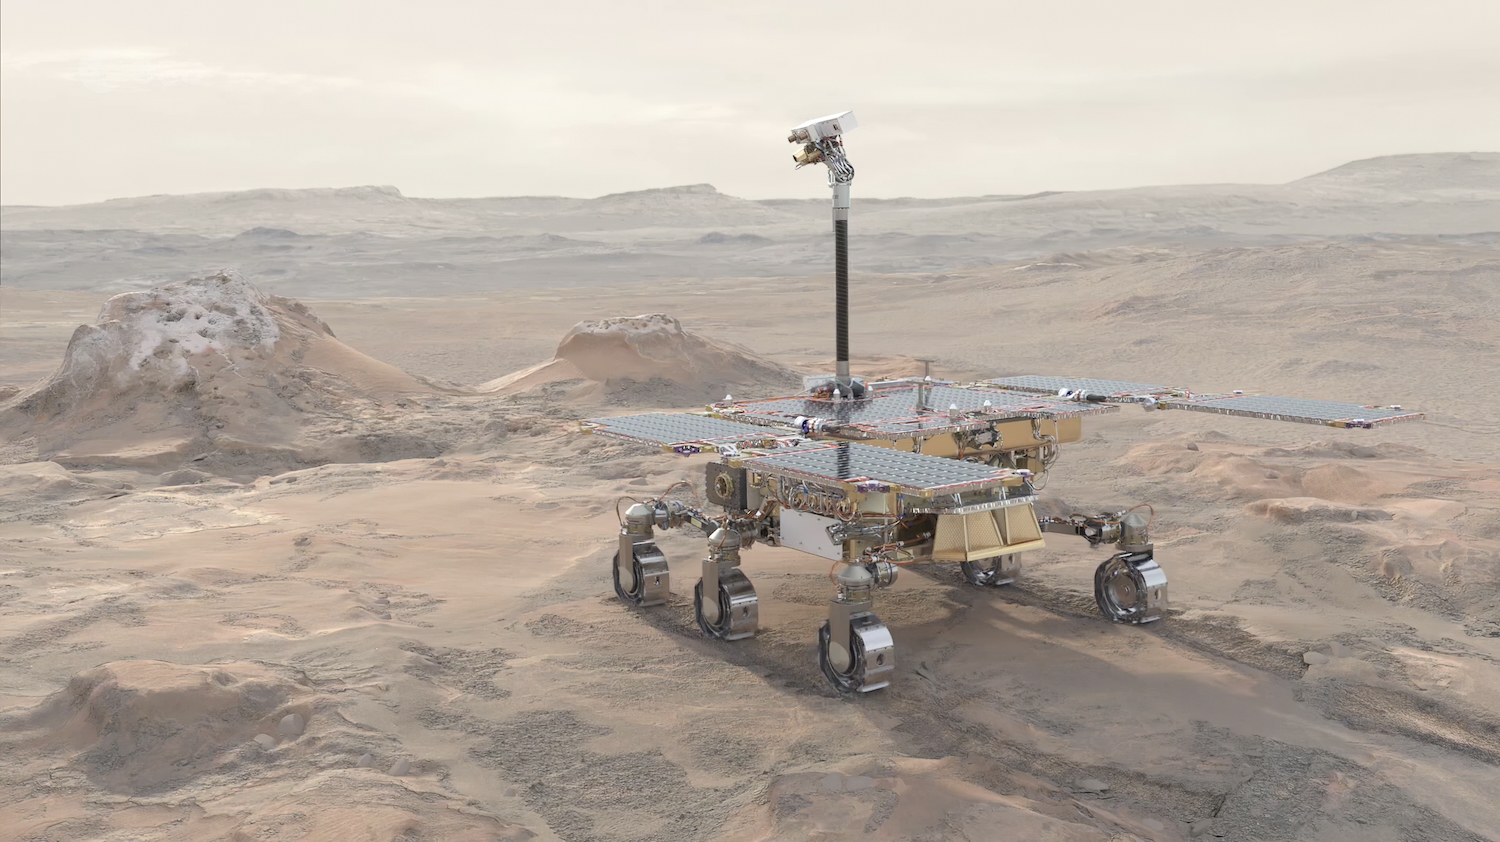
Figure 1: Artist’s view of the Rosalind Franklin Rover approaching hydrothermal mound remains (Credit: MLabSpace/ESA).
Pasteur Payload: The heart of the unique characterisation and analysis capabilities of the Rosalind Franklin Rover lies in its suite of complementary scientific instruments that comprise the Pasteur Payload. At macroscopic scales, the PanCam instrument [2], with its wide-angle multispectral camera (WAC), and narrow angle high-resolution camera (HRC), working together with NavCam and LocCam navigation cameras, constitutes the eyes of the rover. A newly developed infrared spectrometer ‘Enfys’ [3], recovering the analytical capabilities of the disembarked ISEM instrument, will reveal mineralogical signatures at targeted locations. The CLUPI instrument [4] serves as an advanced robotic version of a geologist’s hand-lens, allowing close-up characterization of surface lithologies. The WISDOM ground penetrating radar [5] will reveal sub-surface structures and survey potential drilling sites. Ma_Miss comprises an IR spectrometer head near the drill tip and will allow reconstruction of mineralogical stratigraphy in drilled boreholes [6]. In the rover’s Analytical Laboratory Drawer (ALD), the MicrOmega imaging IR spectrometer [7], Raman Laser Spectrometer (RLS) [8], and Mars Organic Molecule Analyser (MOMA) [9] (which combines gas-chromatography and laser desorption with a linear ion trap mass spectrometer), work together to analyse the mineralogy and organic chemistry of crushed samples.
Science Team Activities: The ExoMars Science Working Team (ESWT), ExoMars project, and industrial partners continue to be engaged in a programme of refurbishment of the rover and its instruments, and preservation of science team expertise and knowledge. The revised mission timeline provides great opportunity for further preparatory science, including of the Oxia Planum landing site and its analogues, by interpretation of orbital data, lab- and field-work, and numerical simulations.
The ExoMars Rover Science Operations Working Group (RSOWG), chartered in 2019 by the ESWT, is re-established for the 2028 mission and continues working at a sustainable pace to address specific needs serving to advance science readiness. The ‘Micro’ sub-group address topics regarding the spatial scale of the samples that will be extracted from down to 2 m by the rover’s drill, their terrestrial analogues, and plans for their analyses, including by the three ALD instruments MicrOmega [7], RLS [8] and MOMA [9]. Ongoing work regards a set of ‘Mission Reference Samples’ – a suite of analogue samples most relevant to the landing site and mission objectives, which are under characterization by ground models of rover instruments at PI and Science Team institutes.
Members of the ‘Macro’ sub-group continue geological interpretation of the landing site and have published the highest resolution geologic map of Oxia Planum [10], the culmination of a 4-year team effort [11]. In addition, a dedicated set of co-authors are preparing the Strategic Science Plan (SSP) of the mission, which traces mission science objectives, through to specific questions linked to hypotheses that are testable by the scientific instruments in the Pasteur Payload.
New Lander: A European Entry Descent and Landing Module (EDLM) that will deliver Rosalind Franklin to Oxia Planum is being developed. The module contains sensor packages that will support EDL and environmental characterisation at the surface for the time that the platform is operational after landing. Amongst them are the COMARS+ suite (installed on the heat shield), which contains sensors for pressure, thermal flux and radiometry; a set of 4 visible wavelength cameras for imaging the descent; and the Platform Atmospheric Characterisation Instrument Suite (PACIS), installed on the lander, which contains atmospheric pressure and temperature sensors, and a microphone. Telemetry from the Radar Doppler Altimeter (RDA) and Inertial Measurement Unit(s) (IMU), together with auxiliary information and data from the above packages, support the ExoMars Atmospheric Mars Entry and Landing Investigations and Analysis (AMELIA) team [12], which is renewed for the 2028 mission opportunity.
Continued Preparations for Operations: Dedicated efforts are underway to maintain, and update as needed, systems at the Rover Operations Control Centre (ROCC - Turin, Italy), which includes a dedicated Mars Terrain Simulator. A continued schedule of testing and simulations is underway at ROCC, providing regular opportunities to exercise Science and Control Team processes.
A special Science Knowledge Management Programme (SKP) dedicated to the Rosalind Franklin Mission continues to support key expertise within the science and instrument teams. SKP ensures that the valuable team knowledge and experience that was built in preparation for the 2022 mission opportunity [13] can be retained and developed.
This presentation will explain how ESA, supported by industry, payload teams, participating national agencies in ESA states and together with our NASA partners, is preparing the Rosalind Franklin Mission for a launch in 2028. We will present the current the level of advancement of the project, and highlight the main science objectives and overall strategic plan for the mission.
References: [1] Vago, J. L. et al. (2017) Astrobiology 17, 471–510. [2] Coates, A. J. et al. (2017) Astrobiology 17, 511–541. [3] Coates, A. et al. (2024) in Europlan. Sci. Cong., Abs. 927. [4] Josset, J.-L. et al. (2017) Astrobiology 17, 595–611. [5] Ciarletti, V. et al. (2017) Astrobiology 17, 565–584. [6] De Sanctis, M. C. et al. (2017) Astrobiology 17, 612–620. [7] Bibring, J.-P., et al. (2017) Astrobiology 17, 621–626. [8] Rull, F. et al. (2017) Astrobiology 17, 627–654. [9] Goesmann, F. et al. (2017) Astrobiology 17, 655–685. [10] Fawdon, P. and Orgel C. et al. (2024) J. of Maps 20. [11] Sefton-Nash, E. et al. (2021) in 52nd Lunar Plan. Sci. Conf. Abs. 1947. [12] Ferri, F. et al. (2019) Space Sci. Rev. 215. [13] Sefton-Nash, E. et al. (2022) in Lunar Plan. Sci. Conf., LPI Cont. 2678. Abs. 2109.
How to cite: Sefton-Nash, E., Vago, J. L., Joudrier, L., Ball, A. J., Tacconi, B., Favaro, E., and Ligeza, G.: ExoMars/Rosalind Franklin Mission Update, EPSC-DPS Joint Meeting 2025, Helsinki, Finland, 7–13 Sep 2025, EPSC-DPS2025-1678, https://doi.org/10.5194/epsc-dps2025-1678, 2025.
Introduction
The ESA Rosalind Franklin rover, whose launch is scheduled for 2028 as part of the ExoMars mission, is equipped with a drilling system capable of analyzing down to 2 meters in the subsurface of Oxia Planum [1,2]. The primary aim of the drill is to collect subsurface samples with significant astrobiological potential for detailed analysis. Although subsurface ice was not initially expected near the Martian equator, the Fine-Resolution Epithermal Neutron Detector instrument on board Trace Gas Orbiter has revealed traces of its presence [3]. Consequently, understanding how drilling activities could affect the presence and stability of subsurface volatile materials is crucial.
For this aim, we are developing a theoretical model using the Lagrangian Smoothed Particle Hydrodynamics (SPH) approach [4]. In the SPH framework, the fluid is represented by particles, and each particle’s properties are determined by neighboring particles within the range of an interpolation function. The model presented here integrates hydrodynamic equations while accounting for key microscopic processes, including phase transitions, viscous coupling between solid and gas phases, dynamic and thermal interactions with solid boundaries, and also atmospheric effects.
Model
We model a 3D cylindrical fracture with a radius 1 mm larger than the 12.5 mm radius of the drill rod [2] and a variable depth. The drill tip is represented as a smaller cylinder, 5 mm in radius and height. A layer of volatile material - a mixture of water vapor, ice, and dust - with variable thickness is initialized inside the fracture. Fig.1 (left panel) shows a setup with a 50 cm deep borehole and a 5 cm thick volatile layer. While the detailed geometry of the drill has minimal impact on the outcome, the temperature profiles of both the drill and the borehole walls are critical. Fig.1 (right panel) illustrates a plausible temperature profile: surface temperature is set at 230 K, representing the average diurnal peak during early Martian spring [5]. This value decreases linearly within the skin depth and then stabilizes at a subsurface temperature of 217 K [5]. Near the drill tip, the temperature is assumed to rise exponentially, reaching a peak that remains constant along the height of the tip before decreasing back to the subsurface temperature. In this study, we explore two scenarios based on experiments conducted in a thermovacuum chamber (CISAS, Padua) designed to replicate Martian drilling conditions: a cold case with a 250 K peak and a hot case with a 290 K peak. These values are consistent with other simulations reported in [6]. Fig. 1 corresponds to the hot scenario, however the cold case follows the same profile with a lower peak. Given the drill's slow penetration rate, the thermal disturbance is expected to remain confined to a narrow region. Water vapor is initialized at the drill tip temperature, whereas ice and dust are assumed to be in thermal equilibrium with the surrounding subsurface—consistent with conditions where ice may be present. Table I summarizes these initial temperatures.

Table I: Overview of initial temperature values.
At this stage, beyond solving the hydrodynamic Euler equations of the multi-component fluid, we also model key microphysical processes occurring on short timescales [7]. Ice-vapor phase transitions are treated statistically, while particles interacting with the subsurface exchange heat based on their dynamic timescales, potentially leading to the formation of deposited ice. Gas-dust interactions are modeled following [8], treating icy grains as dust particles that can undergo phase changes.

Fig.1: 2D initial conditions (left) and borehole walls temperature profile (right).
Results
In the hot scenario, the vapor saturation pressure exceeds the Martian atmospheric pressure, making its effect negligible in first approximation. The initial conditions here assume vapor, ice, and dust fractions of 0.2, 0.4, and 0.4, respectively. As shown in Fig.2, the vapor fraction rapidly decreases as it condenses into ice. Interactions between the ice, the hot tip, and the walls, cause further evaporation, gradually reducing the in-flight ice fraction. The newly formed vapor rises, condenses as it expands, and deposits ice on the borehole walls and drill rod, as illustrated in Fig.3. Additionally, viscosity coupling between vapor and dust carries some dust out of the hole. This entire process occurs rapidly, within approximately 10-2 s, due to the small fracture size. The height at which the ice deposits form is consistent with the location of the Ma_MISS instrument, suggesting the spectrometer could detect water ice on the borehole walls, if present.
In the cold scenario, by contrast, the vapor saturation pressure is too low to overcome the ambient Martian atmospheric pressure. To model this, we are extending our SPH framework to include a carbon dioxide component that fills the borehole [9,10]. Preliminary results indicate that vapor is pushed downward by atmospheric pressure and recondenses near the borehole bottom.

Fig.2: Evolution of volatile material fractions inside and outside the borehole.

Fig.3: Deposited ice distribution on the subsurface and drill rod at time t = 0.03 s.
Conclusions
This approach allows us to study not only the conditions under which volatiles are preserved but also their dynamics within the borehole. The results underscore the significant impact of drilling activities and highlight the necessity of exploring a wider range of scenarios to account for the many unknown variables. The next step is to continue refining the model by accurately incorporating the Martian atmosphere. While the current focus is on Mars, this model is also applicable to other planetary environments, such as the Moon.
Acknowledgments
Work supported by the ASI-INAF grant "Attività scientifica di preparazione all'esplorazione marziana 2023-3-HH.0".
References
[1] Coradini et al. (2001), Adv. Space Res., 28(8), 1203-1208.
[2] Vago et al. (2017), Astrobiology, 17(7), 471-510.
[3] Malakhov et al. (2020), EPSC 2020.
[4] Monaghan (2005), Rep. Prog. Phys. 68, 1703.
[5] Spohn et al. (2024), Geophys. Res. Lett., 51.
[6] Formisano, M. (2021), Adv. Astron., 2021(1), 9924571.
[7] Teodori et al. (2025), under review.
[8] Laibe, G. & Price, D. J. 2012a, MNRAS, 420, 234.
[9] Chapman, S. & Cowling, T. G. (1970).
[10] Maggioni et al., in preparation.
How to cite: Maggioni, L., De Sanctis, M. C., Altieri, F., Formisano, M., Teodori, M., and Magni, G.: Smoothed Particle Hydrodynamics model for volatile emissions from Mars’ subsurface triggered by the drill onboard the ESA Rosalind Franklin rover, EPSC-DPS Joint Meeting 2025, Helsinki, Finland, 7–13 Sep 2025, EPSC-DPS2025-527, https://doi.org/10.5194/epsc-dps2025-527, 2025.
In 2028 the ESA ExoMars mission will arrive on Mars and release the Rosalind Franklin rover to explore its landing site in Oxia Planum. The mission’s study of Mars, however, will begin before touchdown. Here, we present the Platform Atmospheric Characteristics Instrumentation Suite (PACIS) which will include a microphone, accelerometer, temperature and pressure sensor to measure the atmosphere during the descent phase of the ExoMars lander. The primary instrument objectives are:
- P1: To measure the vertical profile of the atmosphere at the ExoMars Rosalind Franklin mission's landing site
- P2: To record atmospheric activity and dynamics during descent
- P3: To record the sound of entry, descent and landing (EDL) operations including parachute release, retrorockets and landing.
The microphone recording of the EDL sequence will be unique for Mars and it will allow the capture of high frequency activity experienced by the lander, particularly turbulence. The vertical profile from the accelerometer (prior to parachute deployment) pressure and temperature sensors will help determine the atmospheric structure and dynamics. Vertical atmospheric profiles of Mars are still scarce and are important for the success of future missions as well as improving our knowledge of the Martian atmosphere.
Once landed, the secondary objective of the PACIS instrument is:
- S1: To characterize the wind, pressure and temperature at the ExoMars landing site
The ExoMars lander is battery operated with no ability to recharge. As such, surface operations for PACIS will be limited to several hours owing to power constraints. Nevertheless, the PACIS instruments will about several hours worth of data post landing to act as a useful tie point to atmospheric models. This will aid future mission interpretations related to the atmosphere. Notably, there are few surface atmospheric measurements from existing missions near the Oxia Planum landing site.
As an additional instrument to the ExoMars landing module, PACIS technologies are based on heritage design from previous projects. The microphone is the same as the one used on the NASA Perseverance mission. The temperature sensor is based on the design from the DREAMS package from ExoMars Schiaparelli. Similarly, the pressure sensor is the flight model originally built as part of the MTK-L meteorology package on the Kazachok surface platform. Similar versions of this instrument have been flown on missions including Perseverance and Curiosity.
We will present the current design and status of the instrument just prior to its critical design review. In particular, we will demonstrate the concept of operations and highlight the potential scientific return.
How to cite: Stott, A., Mimoun, D., Cadu, A., Sournac, A., Wilhelm, A., Carpi, P., Andre, T., Murdoch, N., Ferri, F., Genzer, M., Harri, A.-M., and Haessig, F.: The Platform Atmospheric Characteristics Instrumentation Suite (PACIS) for sensing Mars's atmosphere during the entry, descent and landing of the ESA ExoMars Rosalind Franklin mission, EPSC-DPS Joint Meeting 2025, Helsinki, Finland, 7–13 Sep 2025, EPSC-DPS2025-1380, https://doi.org/10.5194/epsc-dps2025-1380, 2025.
The exploration of Mars has revealed the presence of a variety of soluble chemical compounds, both inorganic and organic, which offer key insights due to their relevance to geological and astrobiological processes.
In the case of chlorine-based compounds such as chloride, chlorite, chlorate, and perchlorate, these are common components on the Martian surface. The detection of these compounds may indicate volcanic, hydrothermal, or evaporative processes that occurred in the past of the planet. For example, perchlorates (ClO₄⁻) are highly oxidizing salts. Their presence has dual implications: on the one hand, they complicate the preservation of organic molecules by oxidizing them, but on the other hand, they provide clues about atmospheric and geological processes that have taken place on Mars.
Nitrates (NO₃⁻) and nitrites (NO₂⁻) are important because they can act as nitrogen sources, an essential element for life. The detection of nitrates in Martian sediments suggests that Mars may have had favourable conditions for microbial life. Sulphates (SO₄²⁻), in turn, could indicate the past presence of liquid water and evaporation processes, in addition to being potential energy sources for extremophile microorganisms.
Beyond inorganic anions, certain organic compounds may be fundamental in the search for biomarkers, as their presence could indicate prebiotic or biogenic processes that may have occurred in the past. For example, although their direct detection has not been confirmed, various studies have suggested the possible presence of oxalates on Mars, compounds that could have important implications for the carbon cycle and the detection of organic processes on the planet.
All the referred compounds form soluble salts that can be extracted with water solutions. Particularly noteworthy is the perchlorate ions discovered through analysis with ion-selective electrodes aboard the Phoenix Mars Lander after extracting the soils with an aqueous solution. However, this method of analysis requires a separate electrode for each ion to be analysed.
Some missions have included gas chromatography systems, which allow analysis through thermal desorption while minimizing the use of solvents, thus reducing the rover’s weight and allowing the measurement of various compounds in the same sample. As early as the Viking mission in 1976, a system with a gas chromatograph coupled to mass spectrometry (GC/MS) was available, although it did not confirm the presence of organic compounds. With technological development, this became possible in more modern rovers like Curiosity in 2012, which detected organic molecules by GC/MS despite the presence of oxidizing molecules. Finally, the MOMA (Mars Organic Molecule Analyser) instrument in the rover Rosalind Franklin aims to overcome this issue to more accurately analyse the organic molecules present in Martian samples.
It is worth noting that there are non-chromatographic techniques, such as Raman spectroscopy, that enable perchlorate, sulfate, nitrate and other compound analysis. However, their identification is also complicated in the presence of complex saline mixtures, requiring a minimum concentration of their salts to be identified.
Taking all of this into account, ion chromatography (IC) may be a relevant technique for inclusion in future missions. In this sense, the IBeA group, with experience in implementation of analytical techniques for Martian rovers, is developing a method to analyse key soluble inorganic and organic ions in extraterrestrial samples with promising results. Thus, in a single analysis, it is possible to quantify fluoride, bromide, chloride, chlorite, chlorate, perchlorate, nitrite, nitrate, phosphate, sulfate, phthalate, oxalate, acetate, lactate, propionate, formiate, and glycolate in under 75 minutes (Figure 1). Implementing this technology would allow not only identification but also quantification of these key soluble species at concentrations lower than 1 mg/L. Moreover, the knowledge of the distribution and concentration of oxidizing compounds like perchlorates could help to design analysis and/or sampling strategies, minimizing the destruction of potential biosignatures by oxidative processes, and enhancing the performance of GC/MS instruments or the selection of sampling points for return missions. Regarding soluble low weight organic anions, IC would allow their quantification even in the presence of compounds such as perchlorate, without the oxidation problems present in thermal desorption-based techniques, requiring only aqueous extraction of the sample. This extraction is enhanced using ultrasound energy.
Figure 1.- Chromatogram obtained for the identification of the 17 proposed analytes, by gradient elution in a Metrohm IC in concentration between 1 and 0.5 mg/L depending on the ion. The retention time is included.
In contrast, IC does have a notable limitation: it requires the use of water in both the extraction and analysis processes. This can be considered a disadvantage, because it increases the technical complexity of sample treatment and the weight and volume of the required instrumentation due to water that must be included in the instrument as a consumable. Regarding sample preparation, extraction processes are already being carried out on current Mars rovers for example, with the MOMA instrument, so overcoming the challenge of aqueous extraction enhanced by ultrasonic energy is highly plausible. Moreover, water use on Mars has already been done, as the Phoenix rover conducted wet chemistry using its Wet Chemistry Lab (WCL). Therefore, the most important limitation for implementing IC in a future rover is the issue of weight and volume, which would limit the number of analyses to be performed but not the feasibility of implementing the technique.
Overall, given the current limitations in the analysis of organic compounds due to the presence of oxidizing agents, even so the identification of simple inorganic compounds. Thus, ion chromatography could be a potential alternative providing a quantitative analysis and enhancing the results obtained with the current analytical instruments on Mars, for example, supporting the selection of the analysis points.
Acknowledgements
This work has been supported through the PAMMAT project “Alteration processes in Mars and Moon Meteorites, and Terrestrial Analogues at different environments: Mars2020, Rosalind Franklin and Returned Samples from Mars and Moon” (Grant No. PID2022-142750OB-I00), funded by the Spanish Agency for Research (MICIU/AEI/10.13039/501100011033/FEDER/UE).
How to cite: Prieto-Taboada, N., Aramendia, J., Martinez-Arkarazo, I., Arana, G., and Madariaga, J. M.: Ion chromatography in Mars exploration rovers: an analytical technique to consider for future missions, EPSC-DPS Joint Meeting 2025, Helsinki, Finland, 7–13 Sep 2025, EPSC-DPS2025-1697, https://doi.org/10.5194/epsc-dps2025-1697, 2025.
Introduction: The NASA Mars 2020 Perseverance rover is collecting samples intended for Earth through the Mars Sample Return (MSR) programme [1]. Approximately 20–30 samples are expected to arrive in the 2030s, providing a unique opportunity to investigate Mars’ geologic history, mineralogy, and surface processes. These samples will be processed at a dedicated Sample Receiving Facility (SRF), a Biosafety Level-4 biological containment and curatorial facility [2,3]. The SRF will conduct a three-phase characterization process: Pre-Basic Characterization (Pre-BC) for non-destructive analyses before opening the tubes, Basic Characterization (BC) for standard data collection in pristine environments, and Preliminary Examination (PE) for detailed study and subsampling. Efficient processing is critical, particularly for time-sensitive studies such as life detection and organic analyses [3,4]. SRF goals include documenting the state of the tubes and contents before opening, monitoring sample inventories, performing initial lithological assessments, and creating a detailed sample catalogue [2,3]. X-ray Computed Tomography (XCT) has been identified as a key non-destructive tool for Pre-BC, offering the potential to visualize internal structures and inform subsequent sample handling [2]. However, the specific requirements and capabilities of XCT for MSR samples remain under evaluation. This study uses terrestrial analogue cores to assess how XCT can support SRF objectives.
Methods: Terrestrial core samples were collected from the Pilbara Craton in Western Australia during the 2022 Pilbara Sample Return Campaign through the MARSnet program [5]. Samples were selected based on similarities to units at Jezero crater. The University of Alberta (UAb) received nine cores (6 sedimentary rocks and 3 regolith samples). Abrasions were made near sampling sites during sample collection, and Raman spectra were acquired. Raman Match software [6] was used to interpret the spectra and characterize the potential mineralogy of the cores. All core tubes contained sample material within an inner steel tube sealed with Teflon caps, and an outer Teflon tube sealed with caps. These sealed tubes were scanned using a Nikon XT H 225ST Industrial CT scanner at UAb, with settings of 220 kV voltage, 65–160 µA beam current, and voxel sizes of 15–19 µm. Following preliminary XCT characterization using Dragonfly software [7], five cores (Fig. 1) were opened in a clean lab at UAb for sub-sectioning. Selected fragments were rescanned individually at 110 kV and 36–61 µA, achieving a voxel size of 7.5 µm. XCT data were analyzed to visualize internal structures and determine fragment size distributions. Fragments containing features of interest were prepared into thin sections for mineralogical analysis. Quantitative point analyses were performed on thin sections using a JEOL JXA-8900 Electron Probe Microanalyzer (EPMA) at UAb, with a 20 kV voltage and 20 nA beam. Elemental X-ray mapping was conducted using a Cameca SX100 EPMA with a 20 kV voltage and 100 nA beam.
Using XCT to meet the goals of the SRF: To assess the condition of the cores before opening, initial XCT scans were performed which revealed that most samples had fragmented during sampling, and that the tubes were only partially filled (Fig. 1). However, banding features were visible in samples such as Kulja (laminated mudstone) and Monkey Mia (stromatolitic boulder), prompting the decision to rescan fragments of those cores. A fragment size distribution was generated using Dragonfly software to help plan subsampling strategies for fragments of approximately equal mass. XCT images were used to track fragment recovery when opening the core tubes. In many cases, it was possible to reorient grains to match their original position within the core, an important step for preserving contextual information critical to future magnetic analyses [2,3]. While original XCT scans helped guide initial assessments, the need for high source energy when scanning whole cores resulted in lower image resolution and diminished X-ray attenuation contrast (Figs. 2, 3), complicating phase identification [8]. To overcome this, selected fragments were rescanned at lower voltages, achieving higher resolution (Fig 3). This allowed mineral grains and cement phases to be distinguished, particularly in samples such as Koorda. The mineralogy of fragments from the sample tubes Koorda, Kulja, and Monkey Mia was initially estimated using Raman scans from abrasion patches taken near the sampling locations [5]. Once thin sections from these samples were analyzed using EPMA, it was possible to compare the Raman-generated mineralogy with the true mineralogy, and we found that they differed significantly (Table 1). This analysis allowed us to confidently retroactively colour sample fragments based on their true mineralogy (Fig. 4). Together, these results demonstrate that XCT, when paired with complementary mineralogical analyses, provides a powerful foundation for achieving the SRF’s science and curation objectives. High-resolution XCT data will be essential for guiding subsampling strategies, optimizing material allocation, and enabling high-priority, time-sensitive investigations once the Mars samples arrive on Earth.
References: [1] Farley K. A. et al. (2020) Space Sci. Rev. 216, 8. [2] Measurement Definition Team for the MSR Sample Receiving Facility Report (Forthcoming). [3] Tait K. T. et al. (2022) Astrobio., 22, S1. [4] Tosca N. J. et al. (2022) Astrobio., 22, S1. [5] Benaroya S. et al. (2024) LPSC LVI #1698. [6] Berrada M. et al. (2024) Am. Min. 0003-004X. [7] Dragonfly 2022.2, Comet Tech. Canada. [8] Hanna R. D. and Ketcham R. A. (2017) Geochem. 77, 4.
How to cite: Benaroya Fucile, S., Herd, C. D. K., and Randazzo, N.: Using X-Ray Computed Tomography (XCT) to Meet the Instrument Needs in a Sample Receiving Facility: Insights from Analogue Mars Samples, EPSC-DPS Joint Meeting 2025, Helsinki, Finland, 7–13 Sep 2025, EPSC-DPS2025-887, https://doi.org/10.5194/epsc-dps2025-887, 2025.
The Tumbleweed mission is novel, and its scientific value has been validated through years of research identifying knowledge gaps that can be addressed by the mission’s broad in-situ exploration capabilities on Mars [1]. The swarm-based mission of 5-meter-diameter spheroidal wind-driven tumbling rovers enables the collection of large spatio-temporal datasets covering large swaths of the planet, finally providing a terminal network of distributed sensors in the stationary phase of the mission [2]. This mission will bridge the gap between low-resolution orbiters and physically constrained wheeled rovers with a cost-efficient alternative.
The needs of planetary scientists, and the initial mission concept, have been verified over the last few years, with science and instrument requirements clearly stated for all relevant science cases ranging from mapping subsurface water ice with a miniaturised neutron spectrometer (currently in development) to prospecting surface geology with our suite of multispectral cameras [3].
At this juncture, the technical feasibility of the Tumbleweed rover needs to be proven, through demonstration of scientific data collection in static and dynamic configurations. Testing is essential to characterise the behaviour of the Tumbleweed rover in different terrain and conditions. This constitutes Phase A feasibility studies, wherein testing is intended to raise the Technology Readiness Level (TRL) from 3-4 to 5-6.
The Science Testbed - a platform for research
To address this requirement, we constructed the Science Testbed: a scaled-down prototype of the Tumbleweed rover [4]. This development enables us to characterise the dynamic environments and noise that affect payloads on board a tumbling platform. The first iteration of the testbed is shown in Figure 1 and was tested in April 2025 in the ENCI Maastricht quarry, with a suite of simple Commercial off-the-shelf (COTS) sensors. Notably, the design of this half-scale terrestrial prototype enables decoupling the rolling outer structure from the stabilised inner structure for effective data collection.
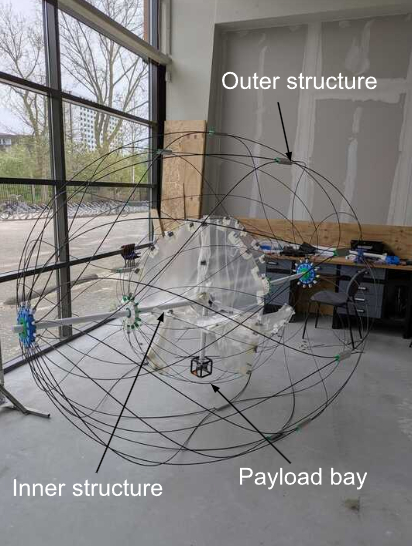
Figure 1: First iteration of the Science Testbed during development in the Delft (Netherlands) workshop.
Aarhus Planetary Environment Facility
In July 2025, the second iteration of the Science Testbed was tested in the AU Planetary Environment Facility in Aarhus (Denmark), wherein the ‘dirty’ wind tunnel can replicate Martian surface conditions. The scaled-down spheroidal Tumbleweed rover was tested with a variety of controlled experiments studying rover mobility, aerodynamic behavior, dust transport and accumulation, locomotion efficiency and payload stability. Thus informing additional constraints for an internally developed physics-based simulation tool. This tool will enable advanced assessment of various mission design options with respect to scientific return, payload performance, locomotion and navigation risk, as well as operational feasibility.
The tests in the Planetary Environment Facility were conducted according to the overarching objective of extracting meaningful information about the behavior and performance of the rover under Martian conditions. This can be decomposed into the following sub-objectives:
- Analyse the fluid-structure interactions of the rover during Force-Balance tests varying wind speed and orientations of the rover
- Analyse the impact of tumbling motion and varying environmental conditions on payload performance and instrument operations
- Examine the impact of varying regolith roughness on rover movement and payload performance
- Determine the threshold wind velocity that initiates rolling of the rover
- Understand dust mobilisation around the rover
- Understand dust accumulation and electric field signatures during a traverse.
- Understand the uncertainty in down-scaling the rover with respect to payload stability, rover dynamics and locomotion efficiency
The experiments were conducted in two parts - static and dynamic tests.
Static Tests
Force-Balance tests were performed to measure lift, drag, moment, and torque acting on the rover. Two variables were changed independently: the initial orientation of the rover and wind speed. The other tests were performed on our payload. COTS sensors were placed on the cryogenic cooling plate, reaching some of the coldest temperatures experienced on Mars (around -143 degrees Celsius), confirming the robustness of our atmospheric instrumentation such as pressure, temperature, soil permittivity and humidity sensors.
Dynamic Tests
The rover was propelled in a controlled manner from an initial stationary position to then traverse a predetermined distance along the chamber. The dynamic tests had miniaturised sensors onboard, notably a microphone, a camera, and a wind sensor to test their performance in varying terrain and atmospheric conditions.
Locomotion-based testing involved varying the underlying regolith to different surface roughnesses in order to understand the impact of regolith on the mode of transportation the rover takes (saltation or traction). Moreover, by varying the wind speed, the threshold wind speeds for rolling were determined for different surfaces. This was done by changing plates with glued sand grains of specific sizes. Larger morphological features such as sand ripples or dunes were also simulated.
Accelerated testing of the dust environment on Mars was done by injecting a high concentration of Martian simulant dust through the wind tunnel. The size of the dust particles varied from 1-10 micrometers and the gas density was kept constant. The accumulation of dust was measured by sticky traps being weighed after a traverse. These sticky traps were placed at various spots on the rover, including the payload bay. Possible extensions could include measurements of triboelectrically charged dust at high wind speeds, using onboard electric field sensors. Measurement of electric fields in dust devils and dust storms is crucial for understanding dust adhesion in future surface-based missions.
These findings advance the development of passively propelled and low‑cost robotic systems for distributed sensing in remote environments, while also providing critical insights into the dynamics of tumbling, wind‑driven platforms and the operational conditions their payloads encounter.
Future testing
Further field campaigns are planned, including a test in the Atacama Desert in November 2025 and a follow-up in Svalbard in early 2026 to validate Earth-based use-cases, particularly in atmospheric and radiation sciences.
Acknowledgements
We gratefully acknowledge the Europlanet Transnational Access (TA) scheme and the funding it provided, which made these tests possible. Our sincere thanks to the AU Planetary Environment Facility for their support.
References
[1] https://doi.org/10.5194/egusphere-egu24-20149, 2024.
[2] Renoldner et al, IAC 2023.
[3] https://doi.org/10.5194/epsc2024-1103, 2024.
[4] https://doi.org/10.5194/egusphere-egu25-18773, 2025.
How to cite: Kingsnorth, J., de Pinto Balsemão, M., Shanbhag, A., Pikulić, L., Merrison, J., Iversen, J., Moisuc, C., Peterson, M., and Rothenbuchner, J.: Preliminary Feasibility Assessment of the Tumbleweed Rover Platform and Mission using the AU Planetary Environment Facility, EPSC-DPS Joint Meeting 2025, Helsinki, Finland, 7–13 Sep 2025, EPSC-DPS2025-1775, https://doi.org/10.5194/epsc-dps2025-1775, 2025.
Please decide on your access
Please use the buttons below to download the supplementary material or to visit the external website where the presentation is linked. Regarding the external link, please note that Copernicus Meetings cannot accept any liability for the content and the website you will visit.
Forward to presentation link
You are going to open an external link to the presentation as indicated by the authors. Copernicus Meetings cannot accept any liability for the content and the website you will visit.
We are sorry, but presentations are only available for users who registered for the conference. Thank you.
Please decide on your access
Please use the buttons below to download the supplementary material or to visit the external website where the presentation is linked. Regarding the external link, please note that Copernicus Meetings cannot accept any liability for the content and the website you will visit.
Forward to session asset
You are going to open an external link to the asset as indicated by the session. Copernicus Meetings cannot accept any liability for the content and the website you will visit.
We are sorry, but presentations are only available for users who registered for the conference. Thank you.