
 1,3,4,4
- 1LATMOS/IPSL, UVSQ Université Paris-Saclay, Sorbonne Université, CNRS, Guyancourt, France
- 2Hensoldt Space Consulting, Guyancourt, France
- 3Royal Belgian Institute for Space Aeronomy (BIRA-IASB), Brussels, Belgium
- 4DLR Institute of Planetary Research, Berlin, Germany
Context
The VenSpec-U instrument[1] onboard the future ESA EnVision mission, will be one of the three spectrometers of the VenSpec suite, that will study Venus’ surface and atmosphere. VenSpec-U will focus on the upper part of the atmosphere and will perform UV observations of the cloud top. It will measure the backscattered sunlight on the dayside of Venus, from which radiance factor spectra will be derived by taking the incoming solar spectral irradiance into account. The scientific objectives of VenSpec-U will regard both the chemical composition and the dynamical properties of the atmosphere. Four main elements to investigate can be derived from these science goals. The firsts are the abundance of sulphured species, including especially SO2 and SO. These species will be identified separately thanks to the “High Resolution” (HR) channel of the instrument, that will have a spectral resolution of 0.3 nm to cover the 205-235 nm wavelength range corresponding to the common absorption band of SO2 and SO. The third objective is to monitor the unidentified UV absorber and its spectral characteristics. To that end, the “Low Resolution” (LR) channel of the instrument will operate from 190 nm to 380 nm, with a spectral resolution of 2-5 nm. Finally, VenSpec-U will investigate the small scale spatial variability of the cloud-top, by performing observations with a pushbroom observation strategy that allows the acquisition of images, at spatial samplings ranging from 3 to 24 km.
Objective and method
This study is focused on the imaging capabilities of VenSpec-U, in order to estimate the performances of the instrument for the retrieval of the small scale spatial features of Venus’ atmosphere, such as convection cells and atmospheric wave patterns. To do so, several numerical models are combined in order to simulate images as produced by VenSpec-U. The whole acquisition process aims to be modelled, from the observed scene at the cloud-top of Venus, to the consideration of the instrument’s behaviour inducing degradations of the images and spectra. The simulation of the observed scene is based on a mesoscale model of Venus’ atmosphere[2], from which maps of the key parameters that aimed to be monitored by VenSpec-U are derived, and radiance factor spectra are generated using a radiative transfer model adapted to the instrument’s wavelength range[3]. An instrumental model has then been developed in order to simulate the formation of images, by following successively the main steps occurring in the process, including the effects of optical components and detector as well as the main onboard data processing operations. A simple inversion algorithm is then applied. This latter is based on the simulation of a solar observation, which is foreseen for the inflight calibration of VenSpec-U, coupled to the inverse radiative transfer model that allow to process the degraded spectra to retrieve the maps of atmospheric parameters. These maps can then be compared to the initial maps used as inputs of the model binned to match the targeted spatial sampling (Fig. 1).
By modifying the amplitude of the spatial features on the initial maps, detection threshold for each parameter can be estimated so that the compliance with the targeted performances in terms of small scale variability imaging can be assessed (Fig. 2). This study has been performed for optimal observation conditions, but could however be repeated for various configurations in order to estimate their impact on the resulting detection thresholds and global performances of VenSpec-U as an imager.
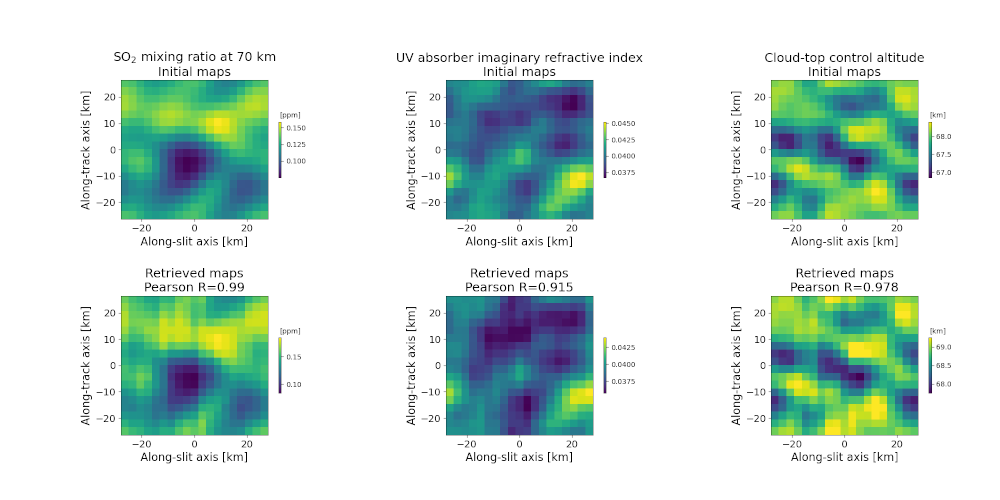
Figure 1: Comparison between initial (top) and retrieved maps (bottom) of the three atmospheric parameters targeted by the LR channel: SO2 mixing ratio (left), UV absorber imaginary refractive index (center), cloud-top control altitude (right)
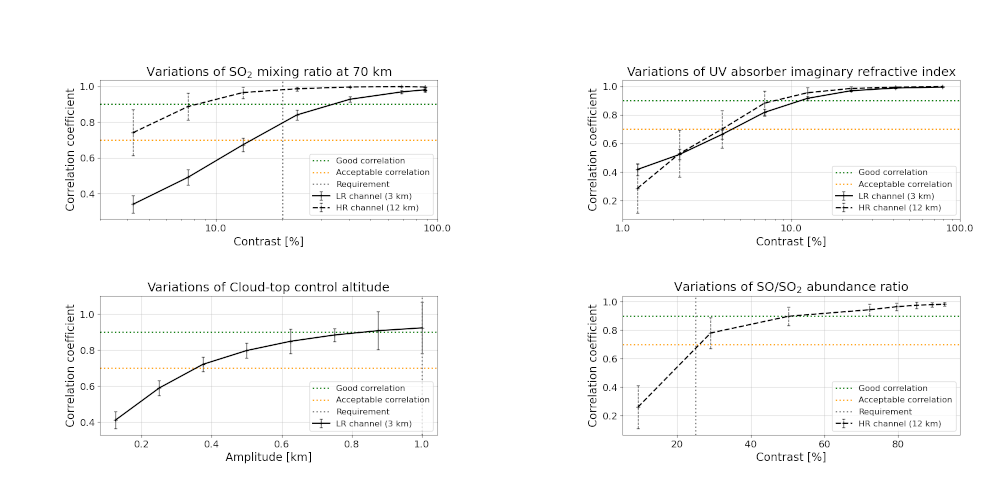
Figure 2: Evolution of the correlation between the initial and retrieved maps of the four atmospheric parameters targeted by VenSpec-U: SO2 mixing ratio (top left), UV absorber imaginary refractive index (top right), cloud-top control altitude (bottom left), SO/SO2 abundance ratio (bottom right)
References
[1] Emmanuel Marcq, Franck Montmessin, Jérémie Lasue, Bruno Bézard, Kandis L. Jessup, et al.. Instrumental requirements for the study of Venus’ cloud top using the UV imaging spectrometer VeSUV. Advances in Space Research, 2021, 68 (1), pp.275-291. ⟨10.1016/j.asr.2021.03.012⟩. ⟨insu-03179739⟩
[2] Lefèvre, M., Lefèvre, F., Marcq, E., Määttänen, A., Stolzenbach, A., & Streel, N. (2024). Impact of the turbulent vertical mixing on chemical and cloud species in the Venus cloud layer. Geophysical Research Letters, 51, e2024GL108771. https://doi.org/10.1029/2024GL108771
[3] Lucile Conan, Emmanuel Marcq, Benjamin Lustrement, Nicolas Rouanet, Léna Parc, et al.. The VenSpec-U spectrometer onboard EnVision: sensitivity studies. Infrared Remote Sensing and Instrumentation XXXII. Proceedings SPIE 13144, Aug 2024, San Diego, United States. 43 p., ⟨10.1117/12.3027500⟩. ⟨insu-04733439⟩
How to cite: Conan, L., Marcq, E., Lustrement, B., Lefèvre, M., Rouanet, N., Leduc, B., Diaz Damian, A., Baggio, L., Bertran, S., Robert, S., Barraud, O., and Alemanno, G.: Observability of small scale atmospheric spatial variability by the VenSpec-U instrument onboard EnVision, EPSC-DPS Joint Meeting 2025, Helsinki, Finland, 7–12 Sep 2025, EPSC-DPS2025-1481, https://doi.org/10.5194/epsc-dps2025-1481, 2025.