
 1,3,3,4,
- 1Institut d'Astrophysique Spatiale - CNRS, Système Solaire et Systèmes Planétaires, Orsay, France (apolline.leclef@ias.u-psud.fr)
- 2Laboratoire d’Astrophysique de Marseille, Aix Marseille Université, Marseille, 13388, France
- 3GEOPS, CNRS, Université Paris-Saclay, 91405 Orsay, France
- 4Laboratoire de Planétologie et Géosciences, Université de Nantes, CNRS, France
Introduction: The planet Mars hosts "gullies" [1] — erosional structures resembling those shaped by liquid water on Earth — mainly at the mid-latitudes, with a higher density in the Southern Hemisphere. While most are dormant, some remain active [2], possibly linked to seasonal surface ice [3]. Initially attributed to the action of liquid water [4], gully formation is now thought to predominantly result from processes involving CO2 ice [5, 6]. CO2 sublimation may notably trigger erosion via mechanisms such as geysers formed in translucent slab ice [7]. Other possible contributing mechanisms may rather involve granular CO2 ice or water ice [6, 9, 10]. The use of infrared spectroscopy may help clarify the composition and physical properties of the involved ices.
This study focuses on the Sisyphi Cavi region in the Southern Hemisphere (68.5°S, 1.5°E), a high-latitude outlier known for its active gullies. Previous studies [3, 5, 6], mainly based on HiRISE and CTX (Mars Reconnaissance Orbiter, NASA) imagery, have reported dark spots and erosive flows, though the mechanisms behind these features remain uncertain. Infrared data has been less frequently used [3]. Building on [8], this work incorporates data from CRISM (Mars Reconnaissance Orbiter, NASA) and OMEGA (Mars Express, ESA) to investigate the nature and behavior of CO2 ice, aiming to distinguish between granular and translucent forms and assess their potential roles in gully formation.
Method: CO2 ice spectra from CRISM are modeled assuming a transparent slab. Retrieved thicknesses are compared with climate model predictions to test this hypothesis, following a method previously used at another site [13]. The novelty lies in using multiple slope orientations, allowing relative comparisons that reduce uncertainties in absolute thickness estimates due to orientation-dependent CO₂ ice accumulation — thicker on pole-facing, thinner on equator-facing slopes.
A synthetic spectral database is constructed using CO2 optical constants [11], and resampled to CRISM’s spectral resolution (6.55 nm). A neutral slope spectrum models contaminants (e.g., dust, calibration noise), following a simplified approach from [8]. As shown in Fig. 1, spectra are fitted by minimizing the quadratic deviation, yielding estimates of the slab optical path, CO2 ice purity, and the contamination level. Prior to fitting, CRISM data are corrected for atmospheric effects following the methodology described in [12]. Optical path values are then converted into physical ice thicknesses by incorporating the full acquisition geometry, including slope orientation, slope steepness, and local solar incidence angle. The resulting thicknesses are compared with those predicted by a 1D climatic model [13]. If observed trends align with model predictions, the ice is likely transparent or translucent. In contrast, a mismatch suggests that photons do not traverse the full ice layer, implying the presence of a granular structure at the surface or within the entire ice deposit.
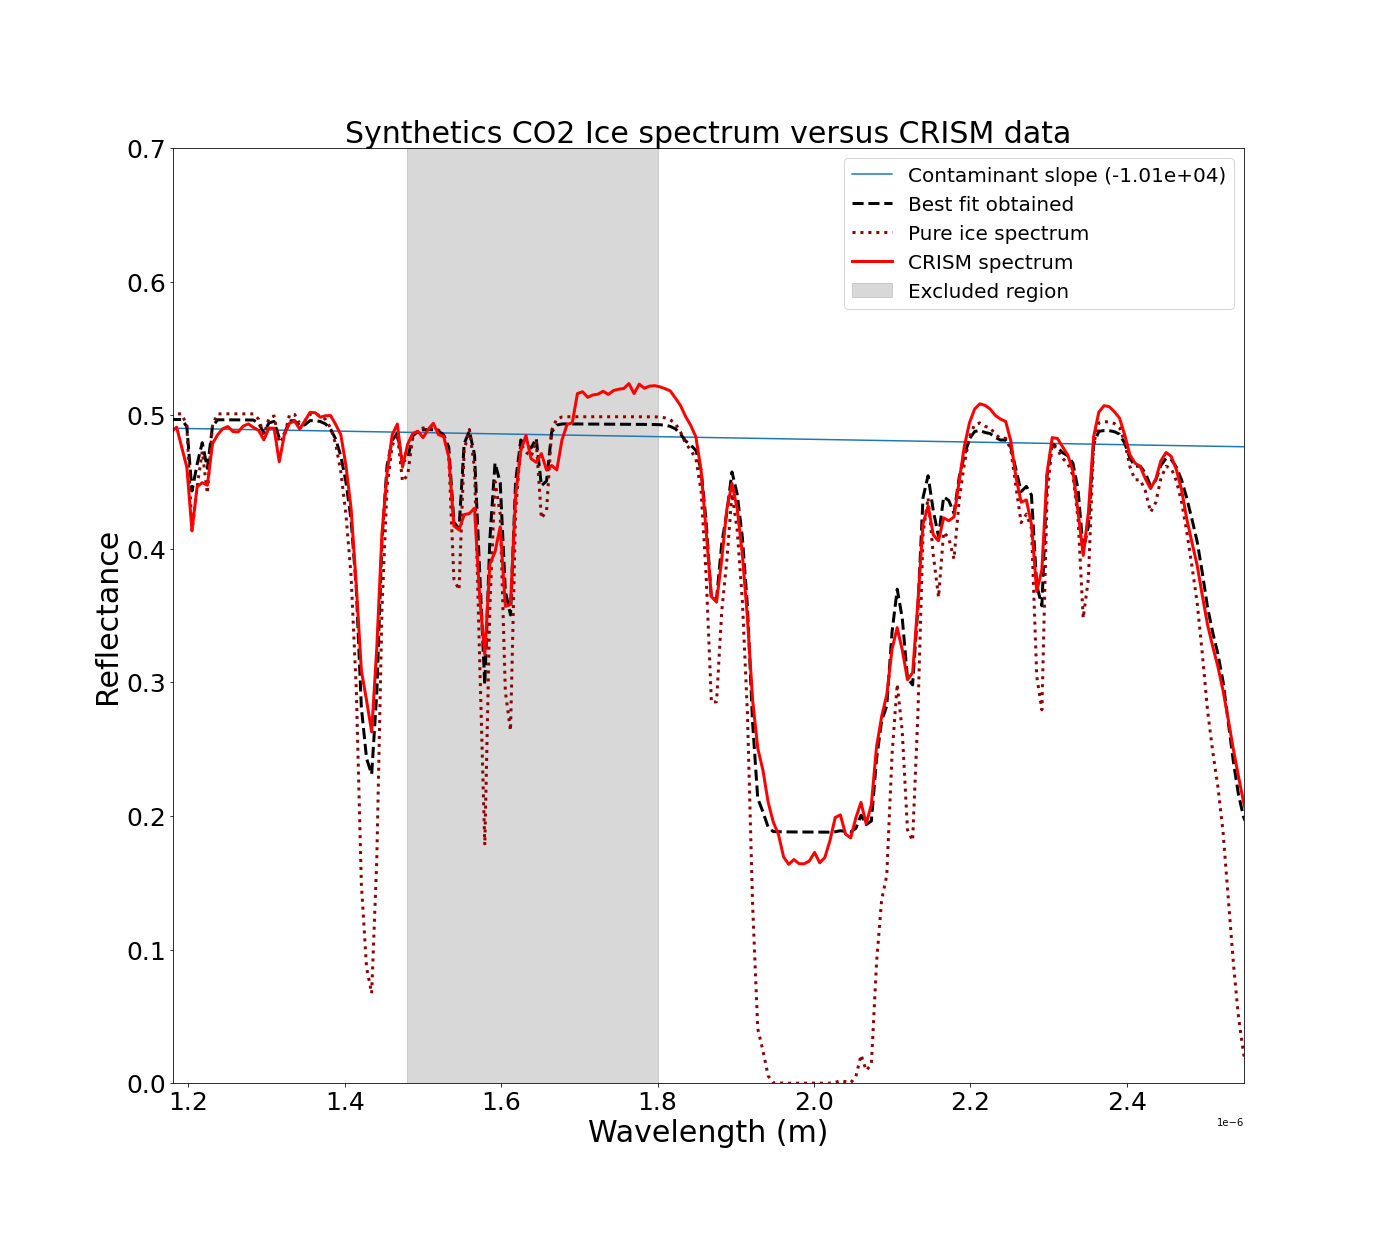
Figure 1: Quadratic fit of a CRISM spectrum at Sisyphi Cavi (Ls 227.02°, MY 29 ; FRT00011935), north-facing slope. After atmospheric correction, the fit yields an optical path of 220 mm and ~ 40% contamination. Solid red: corrected CRISM data; dashed red: pure CO2 model; solid blue: best-fit contaminant; dashed black: final fit. Gray region excluded due to calibration issues.
Discussion: Following the approach used in [8], we optimized the climate model for the region using CO2 ice detections from several datasets [6].
We then compared CO2 ice thicknesses previously derived as a function of slope azimuth from a CRISM observation at Ls 227° [8] with two other periods (Ls 183° and Ls 192°). The new results at earlier Ls also show a trend with slope orientation that suggests translucent ice, similarly to that observed previously [8]. More precisely, these preliminary analyses suggest incomplete transparency: the ice appears to transmit some light but may be mixed with granular components.
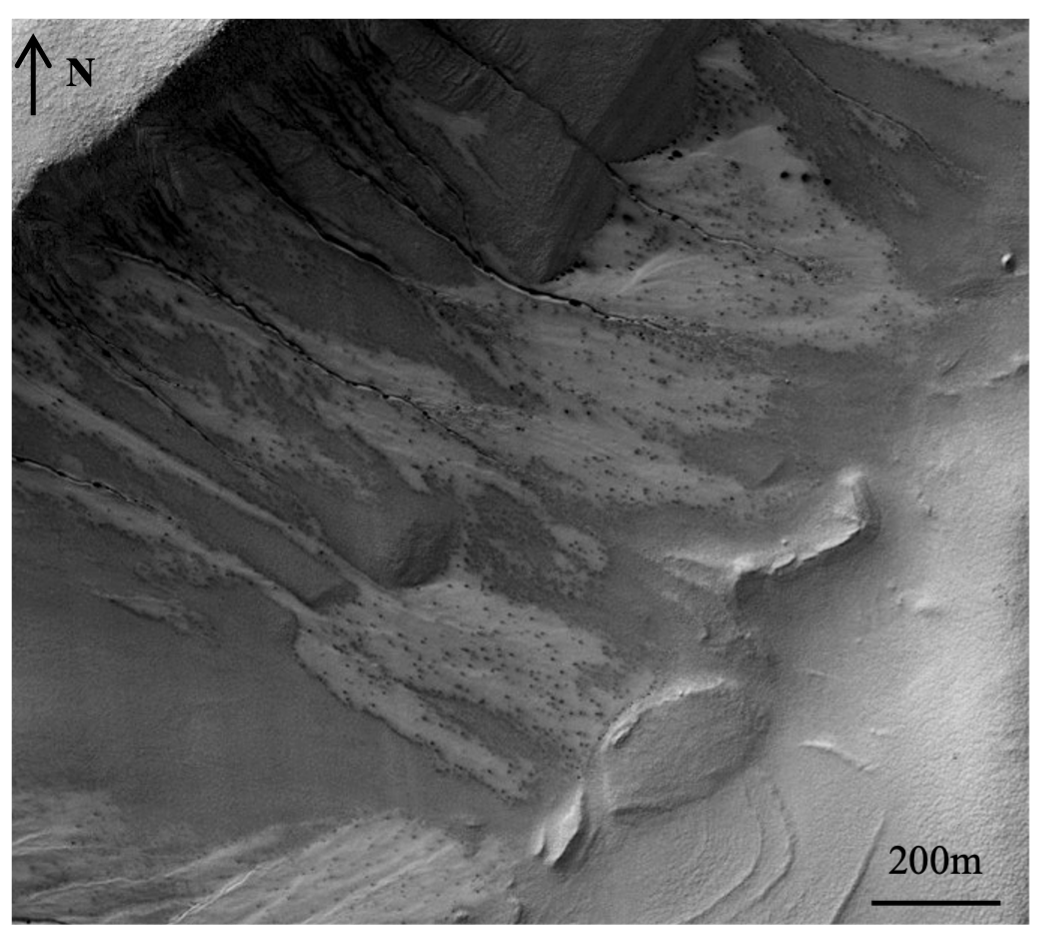
Figure 2: Dark spots and flows on a gullied crater wall in Sisyphi Cavi (Ls 183°, MY 29; ESP_011396_1115), indicative of CO2 geyser activity. Their potential role in gully modification remains debated.
We propose that CO2 ice exists either as fractured translucent blocks or as a mixture of slab and granular structures, for the CRISM observations studied. At first, it could have been in a translucent state (a “slab”), allowing the occurrence of CO2 geysers. During and after the formation of geysers, the ice would break and may have a partly granular structure and/or become contaminated by mineral grains or small grains of CO2 ice. This is supported by the observed dark spots and flows at the same time (Fig. 2, [6]).
To further validate our ice thickness retrieval, we plant to compare it with an independent method based on Bayesian Monte Carlo inversion of a radiative transfer model [14]. This approach is quantitative and already provide clues to demonstrate that ice is translucent in the Richardson crater. Combined with gully activity timing, these findings will help shed light on gully formation and evolution on Mars.
References: [1] Malin, M.C. et al. (2000). Science 288, 2330–2335. [2] Dundas, C.M. et al. (2022) Icarus 386, 115133 [3] Raack, J. et al. (2015) Icarus 251, 226–243 [4] Costard, F. et al. (2002) Science 295, 110–113. [5] Raack, J. (2020). Icarus 350, 113899. [6] Pasquon, K. (2023). Planetary and Space Science 235, 105743. [7] Pilorget, C. et al. (2016), Nature Geoscience 9, 65–69. [8] Leclef A. et al. (2024), LPI Contributions 3007. [9] Vincendon M. (2015), J. Geophys. Res. Planets, 120, 1859–1879. [10] Forget, F. et al. (2024), LPI Contributions 3007.[11] Quirico E. and Schmitt B. (2004) SSHADE/GhoSST (OSUG Data Center), Da-taset/Spectral Data. [12] Vincendon M. et al. (2007), J. Geophys. Res. Planets, 112, E08S13 [13] Vincendon M. et al. (2010) J. Geophys. Res., 115, E10001. [14] Andrieu, F. et al. (2018) Icarus 315, 158–173.
How to cite: Leclef, A., Vincendon, M., Lantz, C., Carter, J., Andrieu, F., Schmidt, F., Conway, S., Massé, M., and Pasquon, K.: Tracking the CO2 Ice Evolution in Sisyphi Cavi Gullies., EPSC-DPS Joint Meeting 2025, Helsinki, Finland, 7–12 Sep 2025, EPSC-DPS2025-1559, https://doi.org/10.5194/epsc-dps2025-1559, 2025.