

- Sorbonne Université, Observatoire de Paris, Laboratoire-Temps-Espace, Paris, France (pierre-louis.phan@obspm.fr)
Five Venus missions are under development to study the planet in the next decade, with ESA's EnVision and NASA's VERITAS both including a geophysical investigation among their objectives[1]. Their radar and gravity experiments will observe Venus's orientation, enabling spin dynamics analyses to infer geophysical and atmospheric properties.
To support these future observations, we developed a polar motion model for Venus. Polar motion describes the motion of a planet's spin axis relative to its surface. It is distinct from precession-nutation, which describes the motion of the spin axis relative to the fixed celestial sphere. Both motions provide complementary constraints for interior models.
Our polar motion model accounts for solar torque, deformations of a viscoelastic mantle, and atmospheric dynamics. We revisited the expression for the free motion period: solar torque is the dominant phenomenon affecting Venus's Chandler period, accelerating the wobble by a factor of 2.75. Using available interior models[2], we predict a Chandler period in the range [12900 ; 18900] years (Fig.1 below)[3]. During EnVision's four-year primary mission, this manifests as a linear drift of about 90 meters (±20 m) of the spin pole on Venus's surface, comparable to the expected precession of 240 meters.
Therefore, when anticipating the upcoming orbiter missions, polar motion should be incorporated into Venus rotation models, alongside the precession and spin rate variations whose recovery has already been simulated[4,5]. A combined recovery of both the precession and Chandler periods could reveal the state and estimate the size of Venus’s core (Fig.2 below)[3].
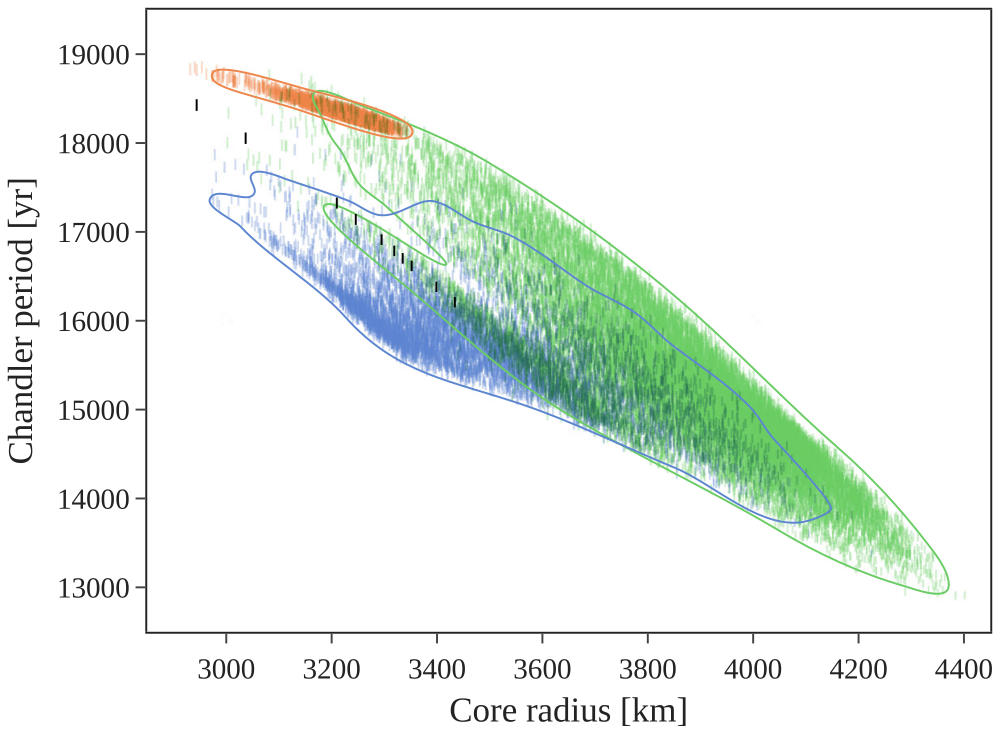
Figure 1 - Chandler period of Venus computed for different interior models. Colored bars correspond to the density profiles from Shah et al. [2], featuring either a fully liquid core (green), a solid inner core with a liquid outer core (blue), or a fully solid core (orange). For each core state, the 99% contour of a kernel density estimate is shown. Black bars correspond to the density profiles from Dumoulin et al. [6], all featuring fully liquid cores.
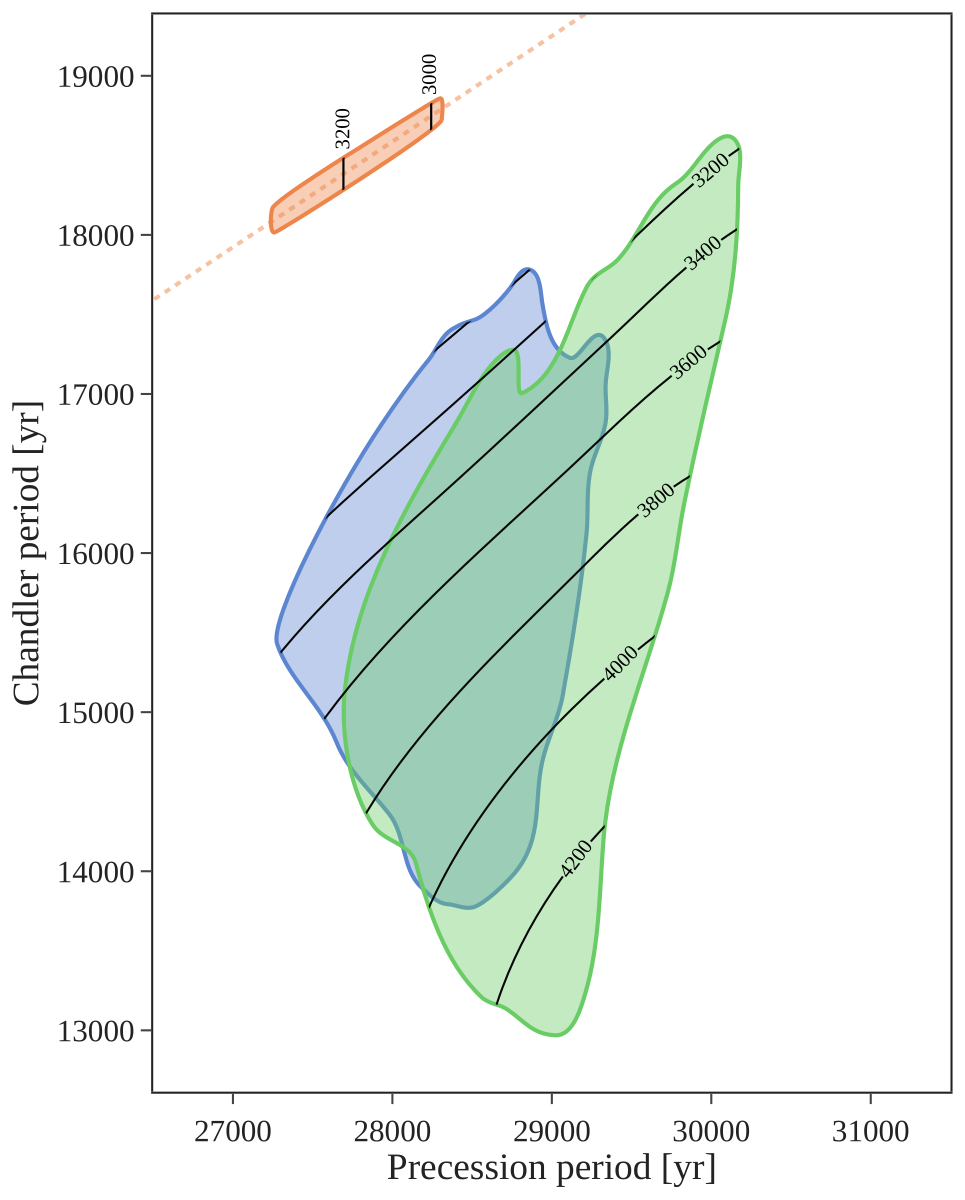
Figure 2 - Chandler and precession periods of Venus computed for the density profiles of Shah et al. [2], featuring either a fully liquid core (green), a solid inner core with a liquid outer core (blue), or a fully solid core (orange). For each core state, the 99% contour of a kernel density estimate is shown. Black level lines indicate the core size of the models in kilometers, to within 50 km.
[1] Widemann et al. (2023), Space Science Reviews, doi:10.1007/s11214-023-00992-w
[2] Shah et al. (2022), The Astrophysical Journal, doi:10.3847/1538-4357/ac410d
[3] Phan and Rambaux (2025, under review)
[4] Rosenblatt et al. (2021), Remote Sensing, doi:10.3390/rs13091624
[5] Cascioli et al. (2021), Planetary Science Journal, doi:10.3847/psj/ac26c0
[6] Dumoulin et al. (2017), JGR Planets, doi:10.1002/2016je005249
How to cite: Phan, P.-L. and Rambaux, N.: Towards a comprehensive rotation model for Venus, EPSC-DPS Joint Meeting 2025, Helsinki, Finland, 7–12 Sep 2025, EPSC-DPS2025-1617, https://doi.org/10.5194/epsc-dps2025-1617, 2025.