
 1,1,1,1,1,1,1,1,2
- 1INAF-Astronomical Observatory of Padua, Vic. Osservatorio 5, 35122, Padova, Italy
- 2Centro di Ateneo di Studi e Attività Spaziali "Giuseppe Colombo", Via Venezia 15, 35131, Padova, Italy
Introduction
Impact cratering shapes the surfaces of airless bodies such as the Moon and Mercury, providing both a record of impacts history and a chronostratigraphic tool for dating geological units. Traditional crater catalogs, compiled manually or via semi-automated algorithms, remain incomplete below ~1 km diameter on the Moon[1] and ~5 km on Mercury[2], limiting studies of small-scale resurfacing, secondary-crater populations, and polar processes.
This study has compiled the first impact-crater dataset for Mercury by a multimodal deep-learning pipeline. Our approach adapts YOLOLens single-stage object detector model initially fine-tuned on lunar imagery to 3-bands inputs and through domain-adaptive transfer learning is applied on Mercury.
The key innovation is the construction of a three-band cube for each orthographic tile:
-
WAC/MDIS visible spectrum mosaics
-
Digital Terrain Model (DTM)
-
Hillshaded DTM version
Methods
Each band is co-registered at 100m/px resolution and normalized to [0,1] to ensure balanced feature learning . Tiles overlap by 128 px to mitigate edge effects, and a triple-scale subsampling captures craters whose diameters exceed individual tile dimensions .
To achieve acceptable generalization model capabilities, a balancing function is applied across latitude ranges and FoVs to ensure a robust model, finally, the entire workflow is shown in Fig.1.
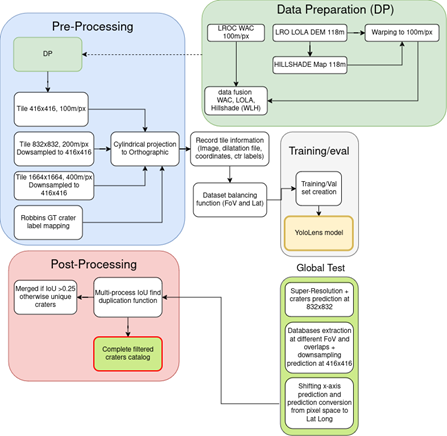
Fig. 1: Workflow.
The YOLOLens model[3], leverages on super-resolution techniques to improve impact crater detection on planetary surfaces. By addressing challenges such as low spatial resolution and variable solar illuminance in satellite imagery, YOLOLens demonstrated enhanced precision compared to state-of-the-art methods.
The parameters are modified at the first/last layers such that the model creates super-resolution (SR) images from a single-channel image. Then, the SR output is used by an object-detection model in an end-to-end model.
Results
The model has been trained across the lunar dataset (Robbins catalogue[1]) to demonstrate the effectiviness of the multimodal approach respect to the catalog derived in[4], thus, we applied a transfer learning step rapidly adapts to Mercury’s distinct albedo contrasts while retaining learned shape priors from the Moon.
Validation on multiple quadrangles yields recall rates of 58% – 95.7% across primary/secondary craters, confirming robust cross-body generalization (Tab.1 and Tab.2).
TABLE 1: Comparison of Crater Diameter Counts for Mercury.
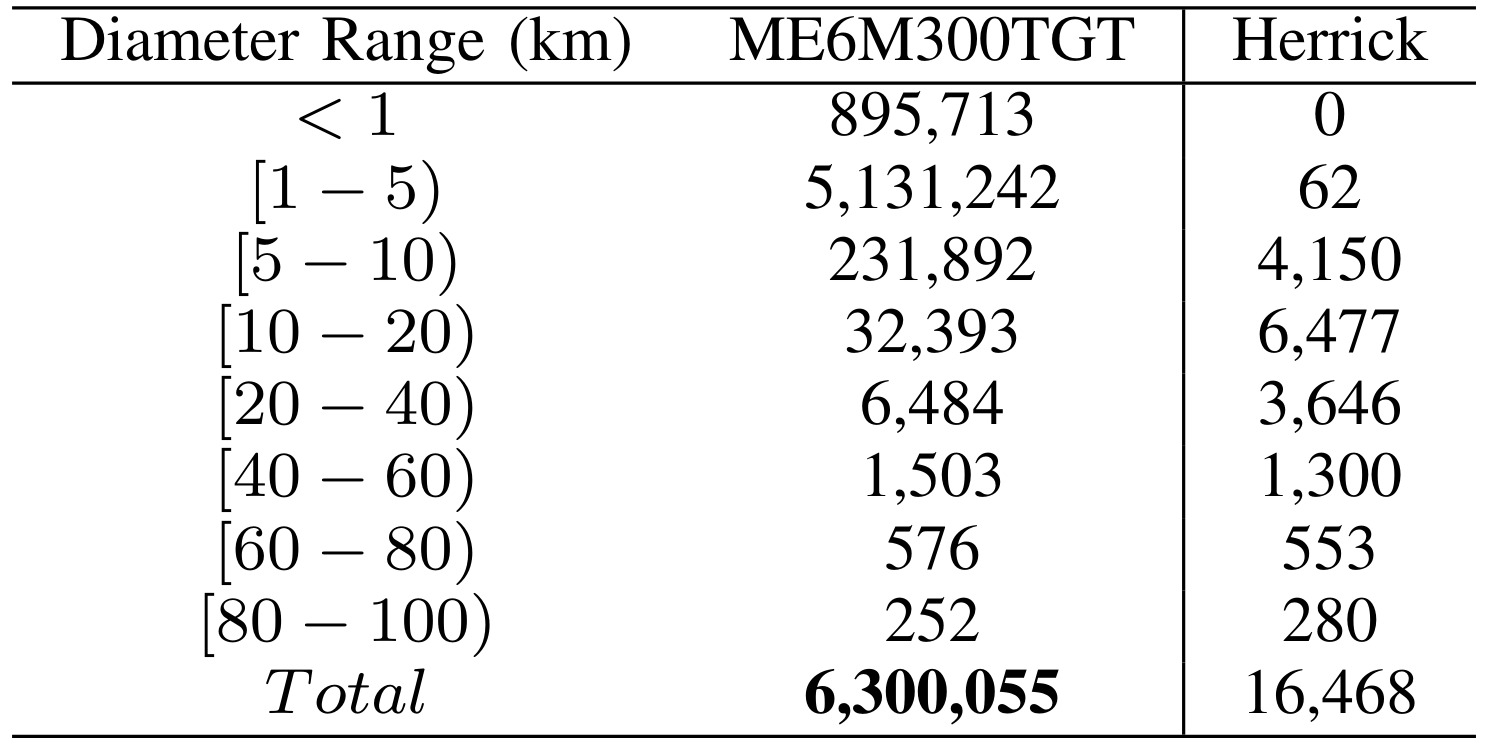
The Herrick catalog reports initial insights derived from the database, while also addressing several limitations that constrain future analyses. Our validation set was compiled through different craters manual counts[5,6,7] see Tab.2 .
TABLE 2: Summary of crater detection performance by YOLOLens across different datasets.
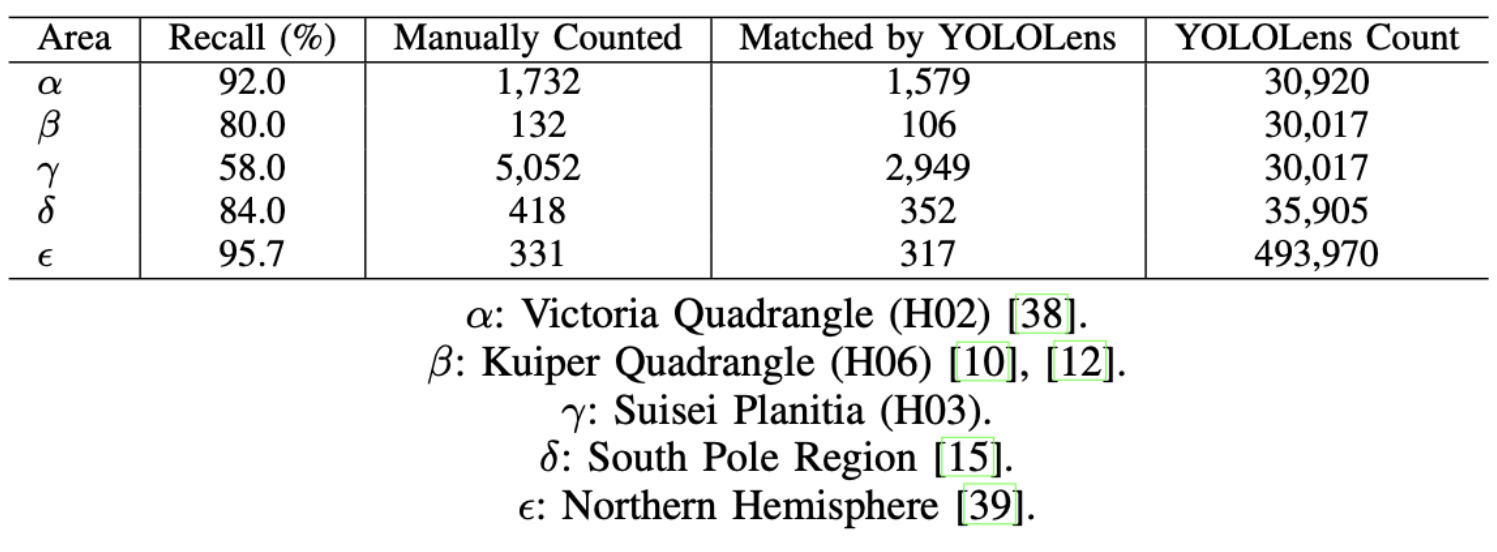
In the investigated regions, high recall values are obtained, suggesting robust performances of the YOLOLens model to identify impact craters. Since the areas used for comparison are representative of all the latitudes, such robustness could be extended to all the Hermean surfaces. Fig. 2 shows the size-frequency distributions.
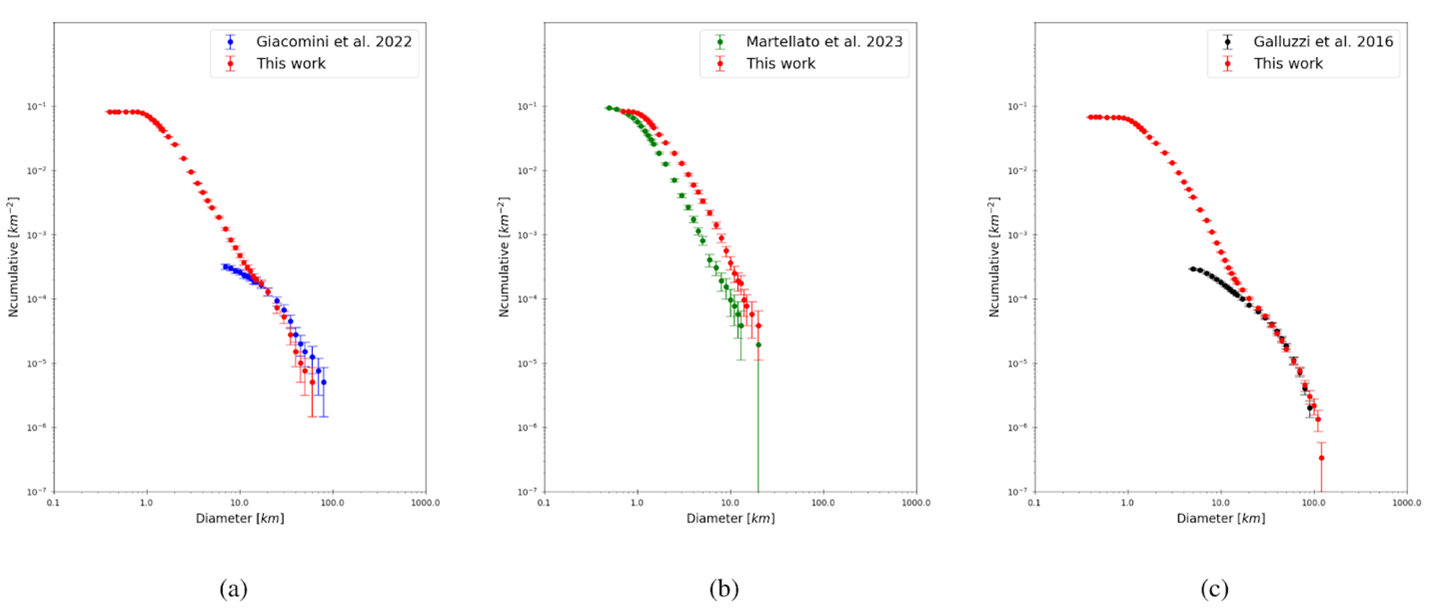
Fig. 2: Comparison of size-frequency distributions (SFDs) between the ME6M300TGT and [6], [7].
The development of a comprehensive global catalog allows us to investigate the distribution of craters and their morphometric characteristics, and from them observe clues about the evolution of the hermean surface. The crater density information provides us with important insights about the age of the different regions and the rates of degradation or remodeling (Fig.3).
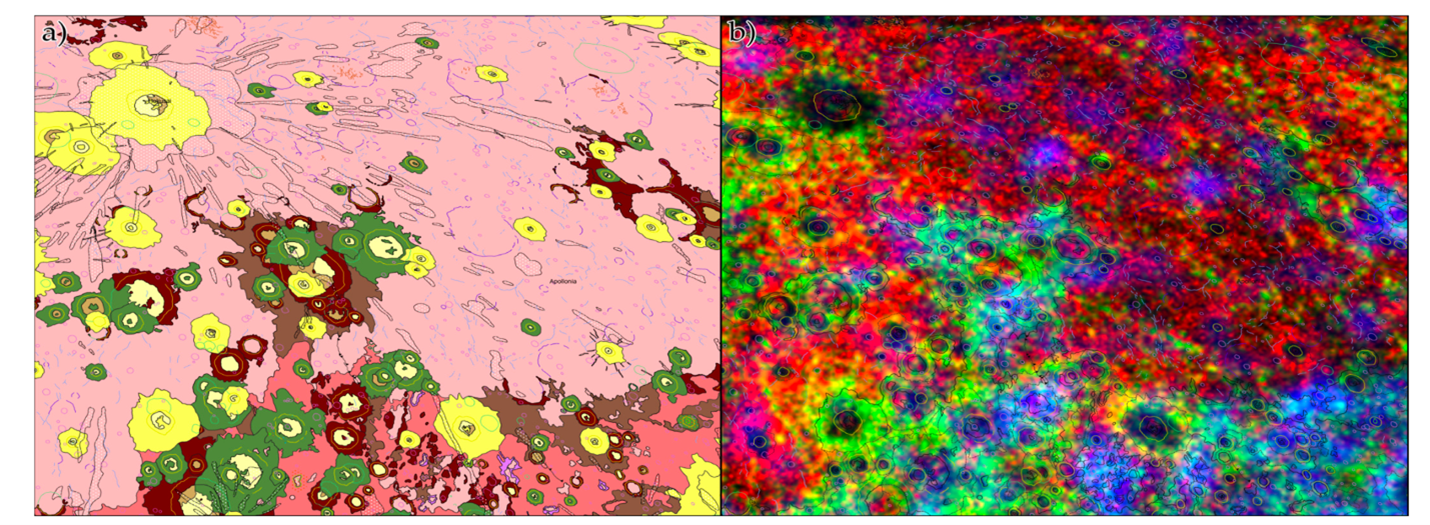
Fig. 3: (a) Extract from the Geological Map of the Hokusai quadrangle (H05)[8] and (b) the same region extracted from the ME6M300TGT to derive the density map by diameter range.
An important parameter for the surface characterization is the depth-to-diameter (d/D) ratio, which is useful to define the post-impact degradation and modification of the crater. The d/D was measured for the entire catalog. Fig.4 shows the distribution of the d/D of the craters.
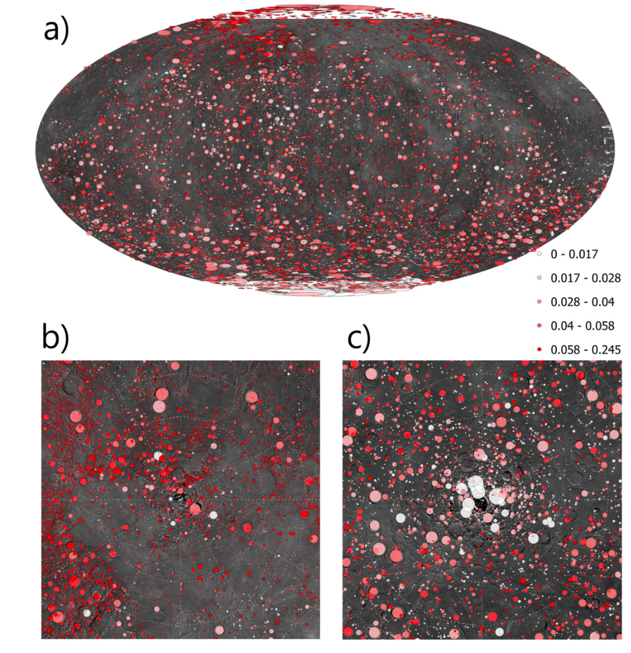
Fig. 4: The map shows the d/D distribution of Mercury’s craters. A) Diameter > 15km over Mercury, B) The North Pole (> 5km) and C) The South Pole (> 15km).
This study presents advancements in planetary surface analysis through the development of a comprehensive crater catalog for Mercury, which exploit images and topographical information simultaneously. The YOLOLens model has demonstrated its capability to detect craters with great accuracy and scale. The datasets also integrate morphometric information, enabling novel insights into crater distributions and the geological evolution of these celestial bodies. In addition, the catalog can function as an important tool in cartographic endeavors currently compiled as a multi-mapper regional-scale project[9].
References
[1] Robbins (2019) J. Geophys. Res. Planets, 124(4), 871-892.
[2] Herrick et al. (2011) Icarus 215(1), 452-454.
[3] La Grassa et al. (2023) Remote Sens. 15(5), 1171.
[4] La Grassa et al. (2025) ISPRS J. Photogramm. 220, 75-84.
[5] Giacomini et al. (2020) Geosci. Front. 11(3), 855-870.
[6] Galluzzi et al. (2016) J. Maps 12(sup1), 227-238.
[7] Martellato et al. (2023) Bull. AAS, 55(8), #116.06.
[8] Wright et al. (2019) J. Maps 15(2), 509-520.
[9] Galluzzi (2019) In: Hargitai (eds) Planetary Cartography and GIS, Springer.
Acknowledgements: we gratefully acknowledge funding from the Italian Space Agency (ASI) under ASI-INAF agreement 2024-40.HH.0
How to cite: La Grassa, R., Re, C., Martellato, E., Tullo, A., Bertoli, S., Galluzzi, V., Giacomini, L., Vergara Sassarini, N. A., Cremonese, G., and faletti, M.: Mercury Global Crater Catalog using Multimodal Deep Learning for Crater Detection and Morphometric Analysis, EPSC-DPS Joint Meeting 2025, Helsinki, Finland, 7–13 Sep 2025, EPSC-DPS2025-1625, https://doi.org/10.5194/epsc-dps2025-1625, 2025.