
 1,2,3,
- 1Université de Liège (ULiege), STAR Institute, Astrophysics, Liège, Belgium (ejehin@uliege.be)
- 2Université Bourgogne Europe, CNRS, Laboratoire Interdisciplinaire Carnot de Bourgogne ICB (UMR 6303), F-21000 Dijon, France
- 3Université Marie et Louis Pasteur, CNRS, Institut UTINAM (UMR 6213), OSU THETA, F-25000 Besançon, France
Introduction. Comets play a crucial role in understanding the formation and evolution of the Solar System, as they preserve the most pristine material from its early stages. Composed of rock, dust, organic material, and ices, comets release gases and dust when heated by the Sun, forming an atmosphere (coma) and characteristic tails. To advance our understanding of comets, it is essential to determine their composition and the physical processes at play and one method is the analysis of the optical spectra of their gazeous coma. At optical wavelengths, these spectra are characterized by emission lines mainly produced from fluorescence-resonance of cometary radicals, ions, and atoms which are the subproducts of the photionization and other processes acting on the larger parent molecules sublimating from the nucleus ices. Identifying correctly these lines among the forest of thousands of lines of the molecular bands at high resolution, is a first and essential step, especially as many remain unidentified despite advances in telescope technology, instrumentation, and laboratory line lists. This has motivated our team to build an atlas of cometary lines, which is a list of validated lines from high resolution and high signal to noise spectra obtained in the last two decades by the Liège team with the 8-m ESO Very Large Telescope (VLT) and covering the whole near-UV and optical range from 3040 A to 10400 A.
High resolution optical spectra. The most comprehensive catalog of cometary optical spectral lines until recently was that of comet 122P/de Vico, compiled by Cochran and Cochran at the McDonald Observatory and published in 2002 [1]. The observation of the bright long period comets C/2002 T7 (LINEAR) in 2004 and more recently in 2018 comet C/2016 R2 (PANSTAARS) with the high-resolution UVES spectrometer (R~100,000) coupled with the large telescope area of the VLT led to some of the best cometary optical spectra ever obtained. These spectra were reduced using the ESO UVES pipeline [2], cosmic rays were removed and SNR improved by combining several spectra taken the same night, and they were wavelength calibrated and shifted in the Earth frame, by considering the geocentric velocities. After a very careful dust continuum subtraction by small wavelength regions using the solar spectrum of Kurucz [3], as well as the removal of the telluric absorptions in the redest part of the spectrum, we studied the cometary emission lines by developing an automatic line detection tool [4], and by identifying them using high-resolution molecular line lists found in the Exomol database [5], derived from recent fluorescence models [6, 7], or more generally found in the literature [1,4,8,9]. The sky emission line atlas observed by VLT/UVES in 2001 [10] was used to confirm the cometary nature of detected emission lines. Emission lines of CO+ and N2+ ions were analyzed thanks to the unique spectrum of comet C/2016 R2 (PanSTARRS), because those species are much brighter in this comet compared to most of other comets [6, 7, 11].
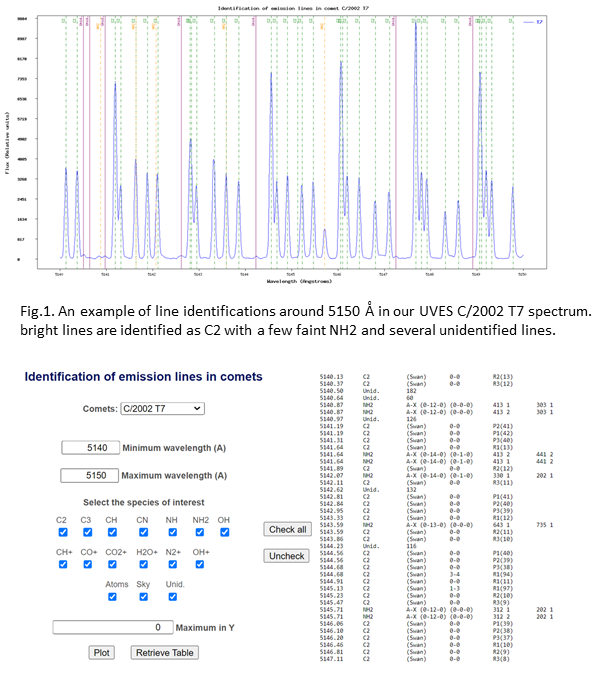
The Cometary line Atlas. We present here a new atlas containing about 22,000 detected emission lines. Among those, approximately 75% were successfully identified as radicals (OH, NH, S2, CN, CH, C3, C2, NH2), ions (OH+, CH+, H2O+, CO+, N2+, CO2+) or atoms ([OI], [CI], [NI], NaI, FeI, NiI). The online tool allows you to check those emission lines, or the species your are interesed in, for a given wavelength range, by displaying them to the high quality spectrum of comet C/2002 T7 (LINEAR), or any comet spectrum normalised and wavelength calibrated to the laboratory rest frame into the system in ascii format (wavelength; flux). With the input of the velocity of the comet with respect to the Earth (the Doppler shift) you can also check the position of the sky lines in the spectrum. Figure 1 represents a small region of the atlas, where C2, NH2, and unidentified lines are indicated and shows the line list and transitions information that can be retreived as a table for the displayed spectrum.
Perspectives. A key aspect of the project involves conducting up-to-date laboratory measurements and developing models to obtain new modelled line positions for comparison with the observed spectra in order to solve the puzzle of the still thousands of lines not identified yet and improve the atlas.
Link to the online atlas. The Liège cometary line atlas can be reached on the following webpage. Comments to improve the tool are welcome.
https://www2.cometa.uliege.be/Cometary_Lineatlas
References
[1] Cochran, A. L., & Cochran, W. D. (2002). "A high spectral resolution atlas of comet 122P/de Vico". Icarus, 157(2), 297-308.
[2] Ballester, P., Modigliani, A., Boitquin, O., et al. (2000). "The UVES Data Reduction Pipeline" The Messenger, 101, 31
[3] Kurucz, R. L. (2005). "New atlases for solar flux, irradiance, central intensity, and limb intensity" Mem. S.A.It Suppl., vol. 8, 189.
[4] Hardy, P. (2022) “Atlas of cometary lines obtained from a high-resolution spectrum of comet C/2002 T7 (LINEAR),” Master’s thesis, University of Liège.
[5] Tennyson, J., “The 2024 release of the ExoMol database: Molecular line lists for exoplanet and other hot atmospheres”, Journal of Quantitative Spectroscopy and Radiative Transfer, vol. 326, 2024.
[6] Rousselot, P., Jehin, E., Hutsemékers, D., Opitom, C., Manfroid, J., & Hardy, P. (2024). "12CO+ and 13CO+ fluorescence models for measuring the 12C/13C isotopic ratio in comets." Astronomy & Astrophysics, 683, A50.
[7] Rousselot, P., Anderson, S. E., Alijah, A., et al. (2022). N+2 fluorescence spectrum of comet C/2016 R2 (PanSTARRS) Astronomy & Astrophysics, 661, A131.
[8] Hardy, P., Jehin, E., Rousselot, P., Hutsemekers, D., & Manfroid, J. (2023, August). "Atlas of Cometary Lines Obtained from High-Resolution Optical Spectra of Comets C/2002 T7 (LINEAR) and C/2016 R2 (PanSTARRS)". In Asteroids, Comets, Meteors Conference.
[9] Blond-Hanten, E. (2024) "Investigation of unidentified lines in optical cometary spectra", Master’s thesis, University of Liège.
[10] Hanuschik R. W. (2003) " A flux-calibrated, high-resolution atlas of optical sky emission from UVES". Astronomy & Astrophysics 407, 1157-1164
[11] Opitom, C., Hutsemékers, D., Jehin, E., et al. (2019). Astronomy & Astrophysics 624, A64
How to cite: Jehin, E., Hardy, P., Blond Hanten, E., Hutsemékers, D., Manfroid, J., and Sohy, S.: An online high resolution atlas of near-UV and optical cometary emission lines, EPSC-DPS Joint Meeting 2025, Helsinki, Finland, 7–12 Sep 2025, EPSC-DPS2025-1777, https://doi.org/10.5194/epsc-dps2025-1777, 2025.