
 1,2,1,3,1,
- 1Space sciences, Technologies & Astrophysics Research (STAR) Institute, University of Liège, Belgium. (shmiddouch@uliege.be)
- 2Cadi Ayyad University (UCA), Oukaimeden Observatory (OUCA), Faculté des Sciences Semlalia (FSSM), High Energy Physics, Astrophysics and Geoscience Laboratory (LPHEAG), Marrakech, Morocco
- 3INAF – Osservatorio Astrofisico di Arcetri – Largo Enrico Fermi, 5, 50125 Firenze, Italy
- 4School of Applied and Engineering Physics, Mohammed VI Polytechnic University, Ben Guerir 43150, Morocco
C/2017 K2 (PanSTARRS), hereafter K2, is a dynamically new comet, discovered by the Pan-STARRS survey [1] in May 2017, when it was at a heliocentric distance of rh=16.1 au [2]. Further investigations enabled to find a prediscovery images of comet K2 exhibiting activity at a very large distance of 23.8 au in May 2013 ([3]). K2 is the second most distant active comet ever discovered, with CO detected in significant abundance at 6.72 au by Yang et al. (2021) [4], potentially accounting for its activity at such a large heliocentric distance.
I will present a detailed study of the comet activity and composition while crossing the water sublimation line using various instruments, including broad and narrow band photometry with TRAPPIST and optical and NIR high-resolution spectroscopy with UVES and CRIRES+ at the 8-m ESO-VLT.
We used both TRAPPIST-North (TN) and –South (TS) [5], to monitor comet K2 for almost eight years. Our observations started with the TN on October 25, 2017, using broad-band filters. At that time, the comet was 15.18 au from the Sun and had a visual magnitude of 19.7 (Figure1). We continued observing the comet with both broadband and HB comet narrowband filters using the TS telescope from September 9, 2021, when it became visible and brighter from the southern hemisphere (rh=5.4 au), until April 20, 2025, after perihelion at 8.46 au. We collected a total of 2204 BB and 174 NB images. The light curve is shown in Figure 1. The brightest magnitude of the comet, with a 5 arcsecond aperture, was 11.18 in the R filter on January 30, 2023. The colors are surprisingly constant throughout the whole range of heliocentric distances, except near the perihelion (< 2.0 au), where the gas contamination of the broadband filters B and V by CN and C2, respectively, is visible. We first detected CN and C2 radicals at the end of March 2022, followed by the majority of other radicals that appeared in the coma about a month later, except for NH, which was observed in mid-August 2022. CN remained detectable in our data until mid-October 2023 at 3.88 au, while C2 and C3 were no longer observed after early October at 3.83 au. OH was detected until September 20 at 3.69 au, while NH was detected until the end of March 2023 at 2.20. The production rates of these daughter species have been derived from a Haser model [6] using the main emission bands and compared to expected parent species detected with CRIRES+ simultaneously.
The Afρ parameter, a proxy for the dust production [7], reached a peak value of approximately 15,000 cm on January 29, 2023, at 1.87 au, placing comet K2 among the most active long-period comets. The Afρ values exhibit significant trends, including a peculiar behavior observed between −260 and −170 days before perihelion (corresponding to heliocentric distances of 3.60 to 2.74 au), where a notable drop is followed by a rapid increase. Based on the production rates, we calculated their ratios relative to CN and OH, as well as the dust-to-gas ratios. Comet K2 falls into the typical compositional group, which is defined by a characteristic abundance of C2 and C3 relative to CN and OH.
To thoroughly investigate the composition of K2 in the optical range and its evolution while getting closer to perihelion, and compare it to other long-period comets. We conducted a program with the high-resolution Ultraviolet Visual Echelle Spectrograph (UVES) at the VLT, at three different epochs before and after the water sublimation line (≈3.5 au). CO2+ ions are detected, but CO+ are never detected, showing that K2 is not a CO+ rich comet like C/2016 R2 [8], observed at the same distance and whose optical spectrum was dominated by CO+ bands. The high resolution and sensitivity of UVES enabled the detection of all three forbidden oxygen [OI] emission lines at each epoch. This also allowed for the calculation of the green-to-red (G/R) intensity ratio.
Observations were conducted with CRIRES+ over three nights, simultaneously with UVES. The settings were chosen to capture major primary volatiles (e.g., H2O, CO, C2H6, CH4, HCN, NH3) and monitor their evolution as the comet approached the Sun. Despite K2’s significant activity at large heliocentric distances, our infrared observations show a contrasting picture: a very weak dust continuum and faint emission lines from several parent species. Notably, the infrared signatures of species commonly seen in the optical, such as H2O, C2H2, and HCN, were barely detectable even when the comet appeared bright. This suggests the comet remained too far from the Sun (Rh > 2 au) for efficient sublimation of water and other less volatile species. Instead, hypervolatiles like CO and CO2 were likely the main drivers of the strong activity observed at these distances. Due to the weak flux, deriving accurate production rates was challenging, however, the data still allowed comparison between parent species in the infrared and daughter species in the optical.
This combined observational approach underscores the value of integrating high-resolution spectroscopic data of both optical and IR with photometric measurements to achieve a comprehensive understanding of cometary activity and composition.
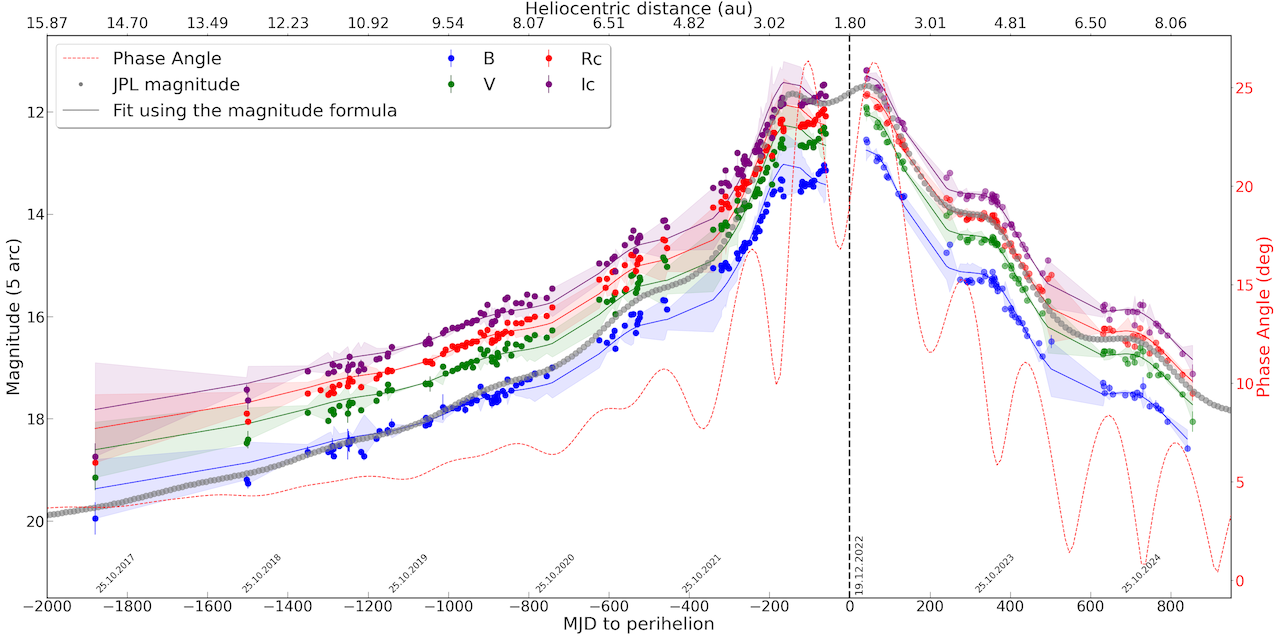
Figure 1: TRAPPIST light curve of comet C/2017 K2 measured within a radius aperture of 5-arcseconds.
References:
[1] Kaiser, N. & Pan-STARRS Team. 2002, in American Astronomical Society Meeting Abstracts, Vol. 201
[2] Wainscoat, R. J., Wells, L., Micheli, M., & Sato, H. 2017, Central Bureau Electronic Telegrams, 4393, 1
[3] Jewitt, D., Hui, M.-T., Mutchler, M., et al. 2017, ApJ, 847, L19
[4] Yang, B., Jewitt, D., Zhao, Y., et al. 2021, ApJ, 914, L17
[5] E. Jehin et al. 2011, The Messenger, 145, 2-6
[6] Haser, L. 1957, Bulletin de l’Academie Royale de Belgique, Vol. 43
[7] A’Hearn, M. F., Schleicher, D. G., Millis, R. L., Feldman, P. D., & Thompson, D. T. 1984, The Astronomical Journal, 89, 579
[8] Opitom, C., Hutsemékers, D., Jehin, E., et al. 2019, A&A, 624, A64
How to cite: Hmiddouch, S., Jehin, E., Lippi, M., Vander Donckt, M., Jabiri, A., Moulane, Y., Manfroid, J., Hutsemekers, D., and Benkhaldoun, Z.: Long-Term Activity and Compositional Evolution of Comet C/2017 K2(PanSTARRS) from Photometric and High-Resolution Spectroscopic Observations, EPSC-DPS Joint Meeting 2025, Helsinki, Finland, 7–12 Sep 2025, EPSC-DPS2025-1785, https://doi.org/10.5194/epsc-dps2025-1785, 2025.