
 1,
1,- 1Lunar and Planetary Laboratory, University of Arizona, Tucson, United States of America
- 2School of Earth & Atmospheric Sciences, Georgia Tech, United States of America
- 3Planetary Science Institute, Denver, United States of America
- 4Institute for Geophysics, University of Texas at Austin, Austin, United States of America
- 5Jet Propulsion Laboratory, Pasadena, United States of America
Introduction: One of the main goals of Mars science and exploration is to explore the shallow subsurface (i.e., 10s-100s meters) and reveal its geologic nature and composition [1]. Although many remote sensing techniques can probe the subsurface, there is currently a sensing gap at depths between ~1 and 100s of meters. Radar surface reflectivity analyses can fill this gap thanks to sensitivity to changes in composition and geologic structures at ~5-15 m depth with the Shallow Radar (SHARAD, [2, 3]) and ~50-150 m depth with the Mars Advanced Radar for Subsurface and Ionosphere Sounding (MARSIS, [4, 5]). Historically, MARSIS surface reflectivity analyses were limited by insufficient coverage and ionospheric effects, which caused attenuation and distortion of the radar echoes. Thanks to new processing techniques and nearly global coverage after continuing MARSIS observations for nearly 20 years [6], it is now possible to probe the Martian near-subsurface at four distinct frequencies ranging from 1.3 MHz to 5.5 MHz.
Methods: We employ a recently released PDS MARSIS dataset that corrects ionospheric phase distortions and provides three empirical parameters associated with ionospheric total electron content (TEC), in turn related to radar echo delay and attenuation [7, 8]. MARSIS operates at four distinct frequency bands, centered at 1.8, 3, 4, and 5 MHz, each with 1 MHz bandwidth, resulting in a free space vertical resolution of 150 m. This allows us to construct four reflectivity maps, each corresponding to a MARSIS band and probing to larger depths as frequency decreases. We process the surface echo power for each frequency through the following steps:
-
Automatic picking of surface echoes based on global topography and “clutter” simulations [9].
-
Path loss correction to account for surface echo power changes due to spacecraft altitude.
-
Ionospheric loss correction via normalization of surface power with respect to solar zenith angle (SZA) and the three TEC parameters (example in Fig. 1).
-
Removal of surface geometry effects via normalization of surface power with respect to slope measured from the Mars Orbiter Laser Altimeter (MOLA, [10]) 463 m/pixel global DEM and surface roughness calculated at 0.6 km, 2.4 km, and 19.2 km baselines from [11] (example in Fig. 2).
Finally, we generate surface reflectivity maps for each MARSIS band by gridding corrected power values at 5 km/pixel resolution and accounting for the variable footprint of each echo, measured as the radius of the 1st Fresnel zone.
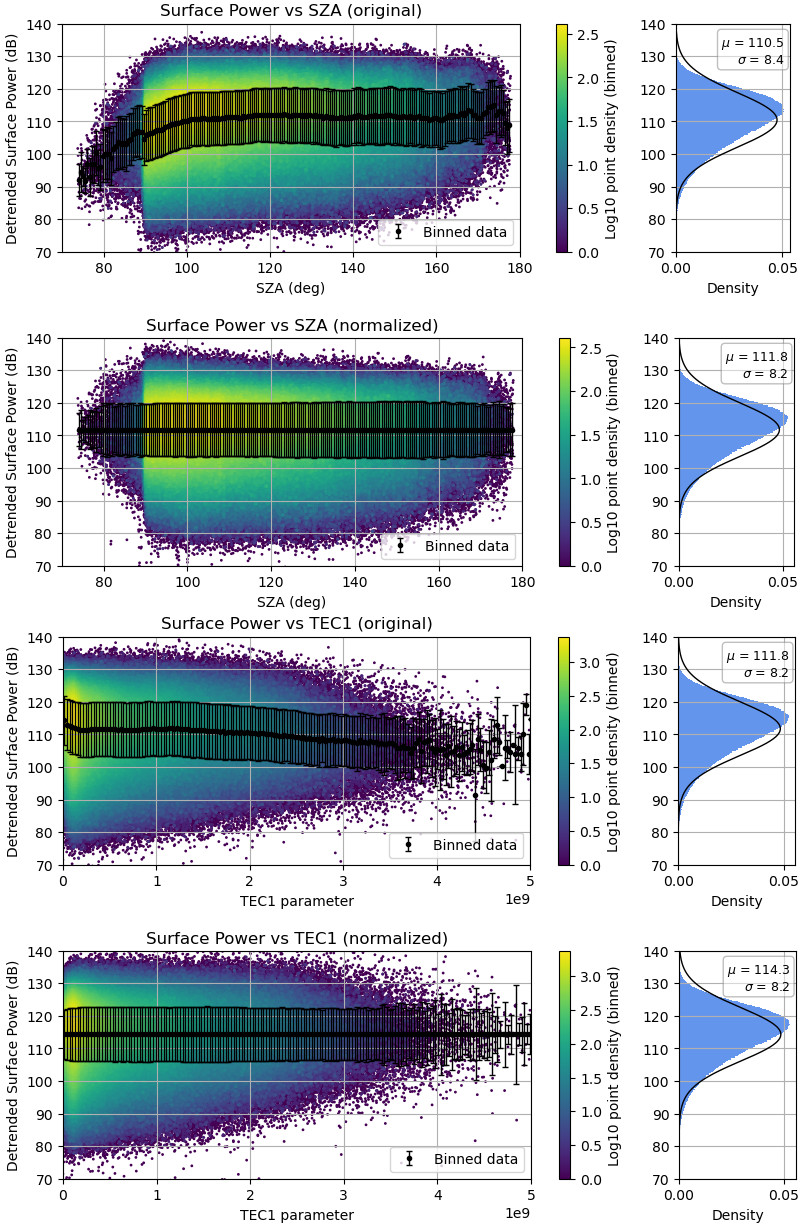
Figure 1: Example of ionospheric effect corrections based on SZA (top) and TEC1 parameter (bottom) applied to the 3 MHz surface echo power data.
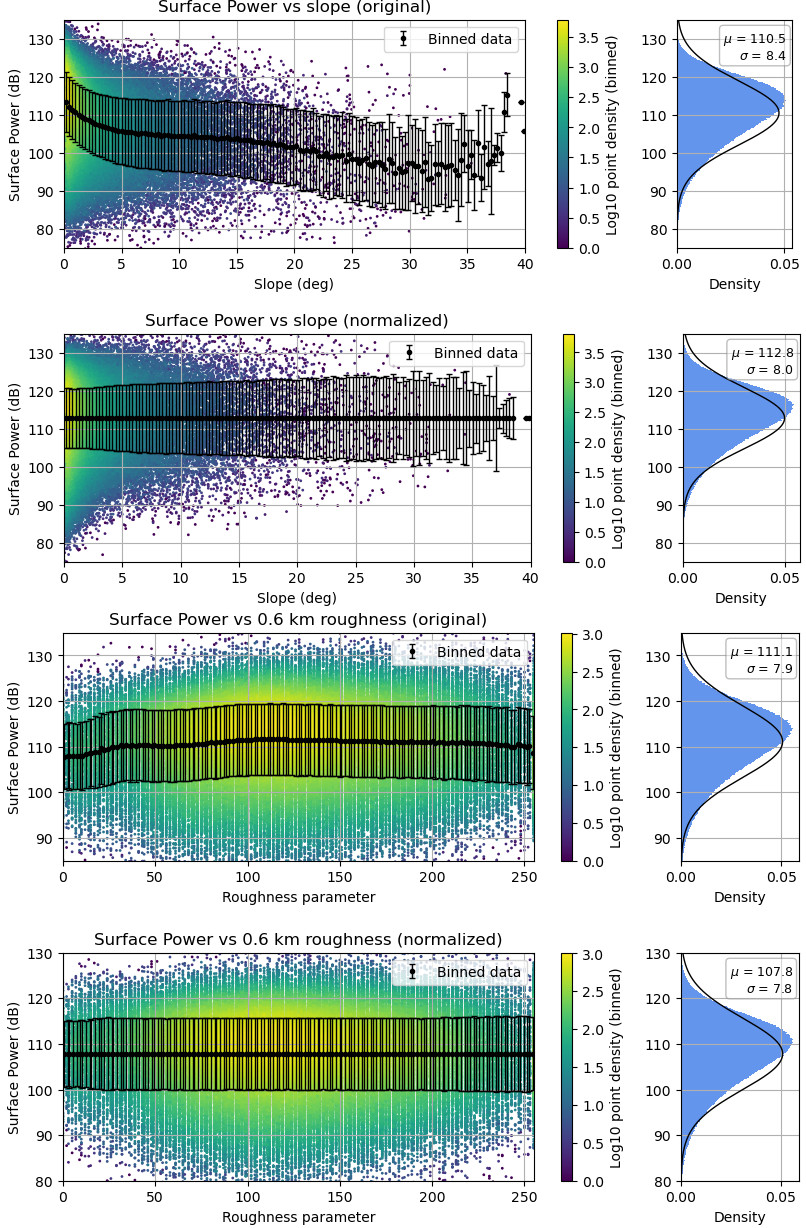
Figure 2: Example of surface geometry corrections based on slope (463 m/pixel) and roughness (at 0.6 km baseline, [11]) applied to the 3 MHz surface echo power data.
Results: We find a strong surface echo power dependence on the local SZA (Fig. 1), with lower frequencies experiencing loss at higher SZA values, an expected behavior for MARSIS [5, 8]. After applying the SZA correction, we still find a non-linear dependence on all TEC parameters (Fig. 1), showing that up to 3-4 dB of loss occurs even at low TEC values. There is also a significant dependence on slope and 0.6 km baseline roughness (Fig. 2), suggesting that MARSIS echo power is most susceptible to short wavelength roughness.
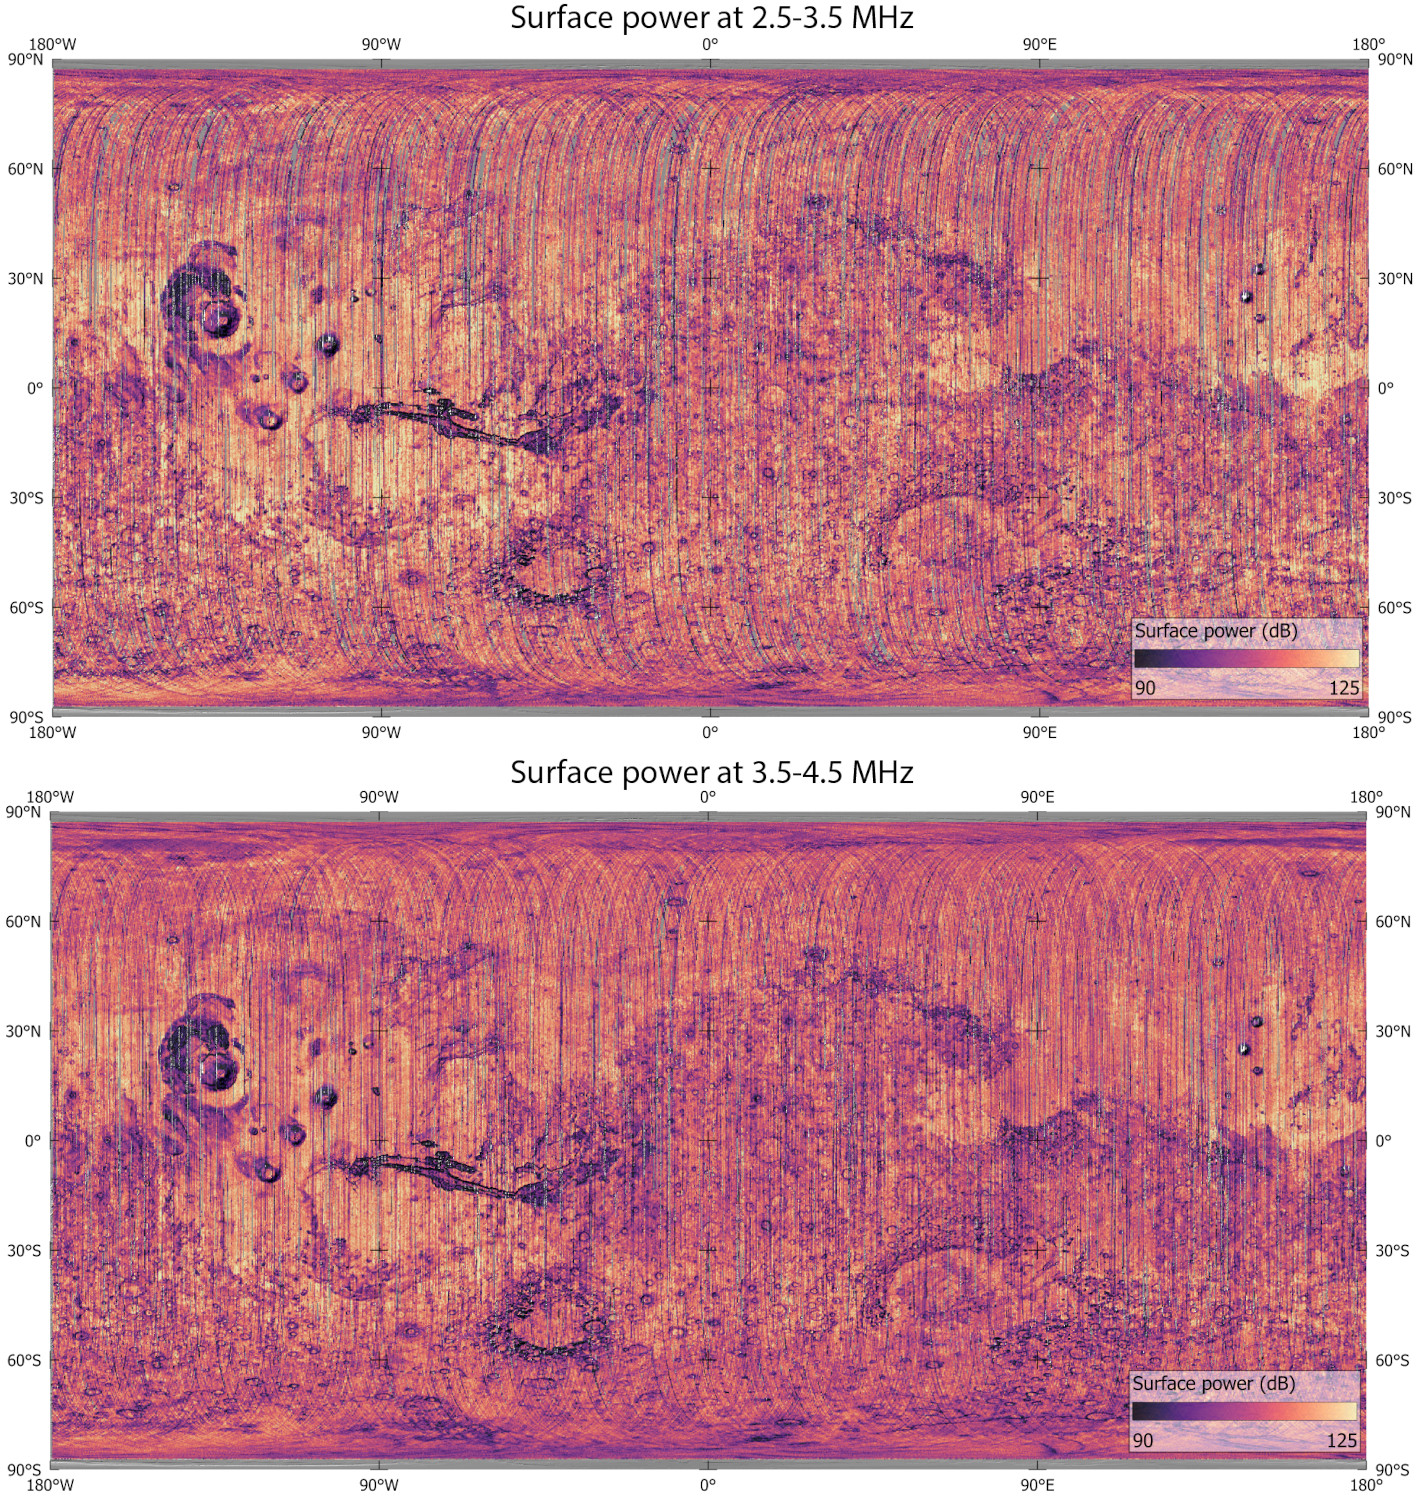
Figure 3: Preliminary MARSIS surface reflectivity maps at the 3 and 4 MHz bands, plotted on MOLA shaded relief.
After empirical correction, the preliminary surface reflectivity maps (examples in Fig. 3) reveal several prominent features, such as high surface reflectivity associated with lava flows in Tharsis and the Elysium/Amazonis Planitiae, and low reflectivity zones corresponding to the friable Medusae Fossae Formation. The Martian northern plains reveal a wide range of reflectivity likely associated with variable terrain types including ice-rich deposits [12, 13] and the latitude-dependent mantle [14].
Discussion: The consistency of surface power measured across adjacent profiles in our preliminary maps indicates that the correction of path and ionospheric losses is effective at all SZA values, thus eliminating the need for filtering. Despite the low number of observations and significant ionospheric losses, we also obtained the first Mars surface reflectivity map at 1.3-2.3 MHz.
There is a weak residual surface power dependence on roughness, likely due to simplifications in our preliminary approach. To address this, we are currently running a detailed analysis of several roughness and slope parameters within the 1st Fresnel zone of each MARSIS echo, leveraging the entire MOLA shot point dataset [10]. This will allow us to capture the effects of short wavelength roughness highlighted by the preliminary results at 0.6 km baseline (Fig. 2).
All reflectivity maps show enigmatic “sinuous stripes” across the southern highlands with low power values compared to surrounding areas. These features are consistent across adjacent profiles and their location and shape resemble ionospheric anomalies associated with remnant crustal magnetization observed by SHARAD [15]. A simple empirical correction based on the total crustal magnetic field [17] appears to remove most of these features, suggesting that MARSIS is particularly sensitive to ionospheric phenomena linked to crustal magnetization. We will further test this hypothesis via analyses of TEC parameters and magnetic anomaly data.
Overall, these results offer new insights into volcanic, sedimentary, and ice-related processes. They also lay the groundwork for future missions targeting subsurface ice or landing sites.
Acknowledgements: This work was supported by NASA MDAP grant 80NSSC22K1079.
References: [1] MEPAG Science Goals document. [2] Campbell et al. (2013)JGR: Planets. [3] Seu et al. (2007)JGR: Planets. [4] Mouginot et al. (2010)Icarus. [5] Jordan et al. (2009)PSS. [6] Orosei et al. (2015)PSS. [7] McMichael et al. (2017)2017 IEEE RadarConf. [8] Plaut (2024)Optimized MARSIS PDS4 release. [9] Choudary et al.(2016)IEEE GRSL. [10] Smith et al. (2001)JGR: Planets. [11] Kreslavsky and Head (2000)JGR: Planets. [12] Bramson et al. (2015)GRL. [13] Stuurman et al. (2016)GRL. [14] Kreslavsky and Head (2002)GRL. [15] Campbell et al. (2024)GRL. [16] Campbell and Morgan (2018)GRL. [17] Langlais et al. (2019)JGR: Planets.
How to cite: Nerozzi, S., Christoffersen, M., Morgan, G., Grima, C., and Plaut, J.: Measuring the Mars Global Surface Reflectivity at 1.3-5.5 MHz with MARSIS, EPSC-DPS Joint Meeting 2025, Helsinki, Finland, 7–12 Sep 2025, EPSC-DPS2025-1857, https://doi.org/10.5194/epsc-dps2025-1857, 2025.