
 1,1,2,1,3,4
- 1CNRS GEOPS, Université Paris-Saclay, Orsay, France
- 2Institut Universitaire de France (IUF), France
- 3Globe Institute, University of Copenhagen, Copenhagen, Denmark
- 4Niels Bohr Institute, University of Copenhagen, Copenhagen, Denmark
1 - Introduction
Understanding the geological processes is a key objective for future lunar exploration. The ESA Màni mission aims to advance this understanding by characterizing the lunar regolith with high resolution imagery, Digital Elevation Model and photometry. This study focuses on the photometric behavior of lunar areas across multiple regions, leveraging an advanced model to estimate the best satellite mission scenario to predict the microphysical properties. At the core of this investigation is the use of the Hapke radiative transfer model [1], a widely used semi-empirical approach for light interaction.
Similar photometric studies on other planetary bodies, such as Europa Mars [2][3] and Europa [4], have demonstrated the effectiveness of multi-angle reflectance observations combined using inversion techniques for retrieving surface microtexture.
Through the application of the Bayesian Monte-Carlo inversion framework [5], we used the mc3 inversion tool [6] and quantified the surface properties that govern the scattering and absorption of light. Particular attention is paid to the efficiency and biases associated with the photometric sampling, following the findings of [7], and to the light-scattering behavior of surfaces as previously explored in experimental study [8].
2 - Method
2.1 - Mission orbit design
The Màni mission will employ a multiple-pass polar orbit strategy, at an altitude of 50 km. The repeated high-resolution data collected will contribute to a deeper understanding of lunar geology and support the broader goals of lunar exploration, including future manned missions and resource utilization.
We assume here the Moon as a perfect sphere. The left side of the Figure 1 represents a global view of the Moon and the mission. Here, the yellow star symbol (L, for light source) represents the subsolar point of the Sun on the surface, the green circle symbol (O, for observer) represents the observer point, which is the location of the satellite and the red circle symbol (T, for target) shows the target position. This configuration reveal crucial angles such as incidence (θ), emergence (θ0), phase (α) and azimuth (ψ) used to calculate and inverse the reflectance.
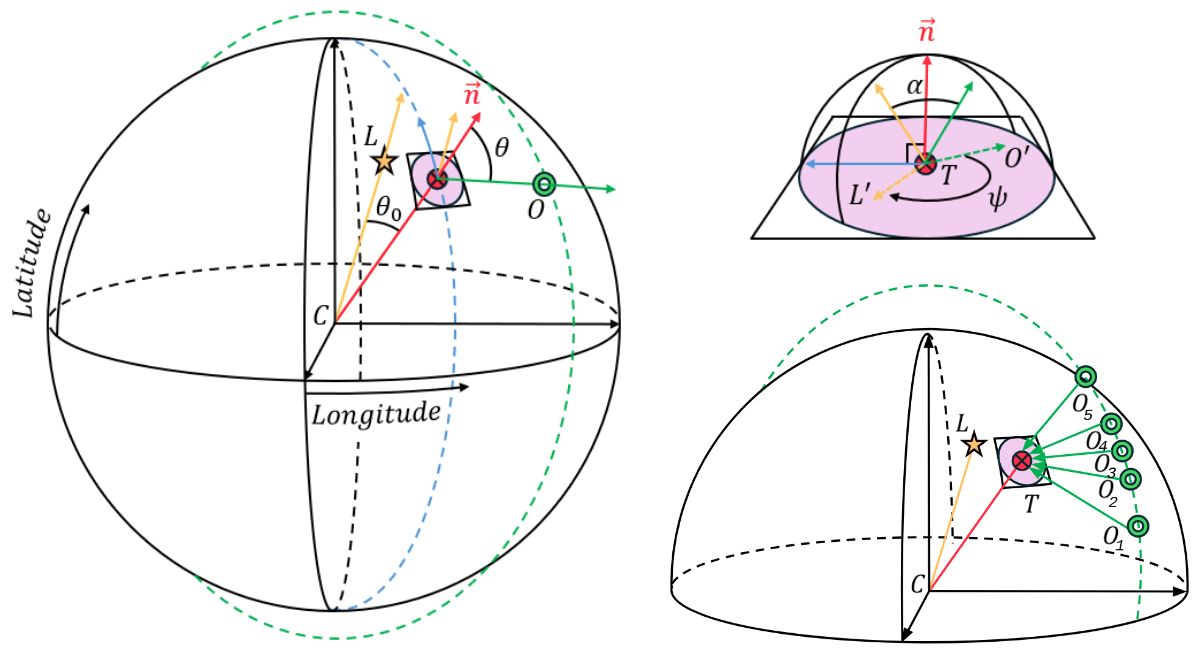
Figure 1 : System coordinates and geometries used for a given scenario. The right figure represents a zoom on the normal plan from the target normal vector (n).
A total of 93 plausible mission geometry were created, with a target at nadir, medium and high latitudes (0o,45o,70o) with different orbits longitudes (−10o,0o,10o).
2.2 - Surface photometry
For the target surface, a variety of 12 photometric microstructure surfaces using different single scattering albedo (ω), Hapke mean slope roughness (ζ), opposition effect amplitude (B0), asymmetry parameter (b), back scatter fraction (c) and opposition effect width (h) are set. To simulate the mission, we combined all the geometries and photometries to make a single dataset of 1116 different scenarios. By evaluating these scenarios, we aim to better understand how photometric behavior varies under different microphysical conditions, informing the optimal choice of parameters for the mission’s orbital configurations.
2.3 - Efficiency
To simulate the mission, we combined all the geometries and photometries to make a single dataset of 1116 different scenarios. We evaluate each scenarios by using the efficiency (E) using the strategy defined in [8]. The main steps are described here after. (i) The reflectance corresponding to each of the 1116 different scenarios (all combinations of possible 93 geometry and 12 photometry) are computed. (ii) For each one of them, the Bayesian inversion is performed, incorporating noise level of 10% and 2%. (iii) The quality of the knowledge on the photometric parameters is estimated by the efficiency "E". The closer the solution to the true parameter set is, the better the estimate. We measure the quality of the tested geometry by considering, for every parameter (for example ω′), the part of the distribution σ(ω′) which lies inside the interval [σ(ω′) − ϵ, σ(ω′) + ϵ], where ϵ is set to 1% of the total parameter space.
3 - Results and Simulations
Figure 2 shows an example of the knowledge on the photometric parameter in one example out of the 1116 scenarios. Given the noise level, a significant fraction of the solutions are outside the ϵ =1% acceptable domain but the maximum likelihood is close to the true solution. The proxy is respectively 2.65 and 6.41 for this example.
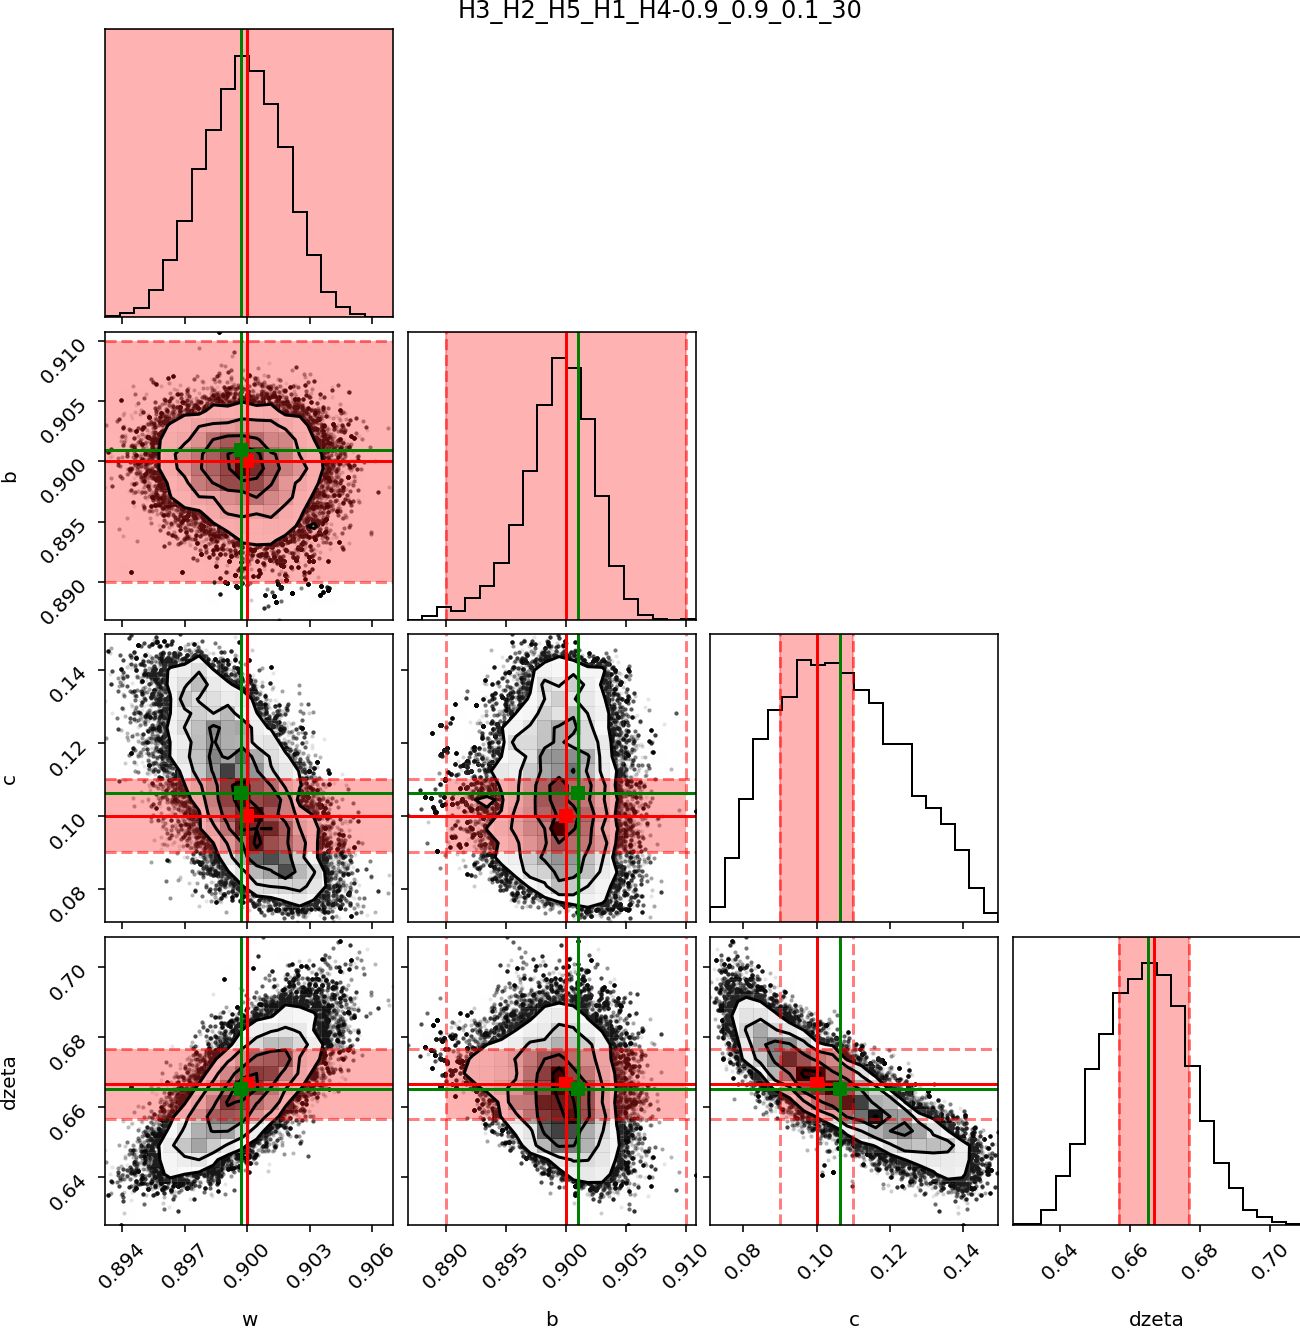
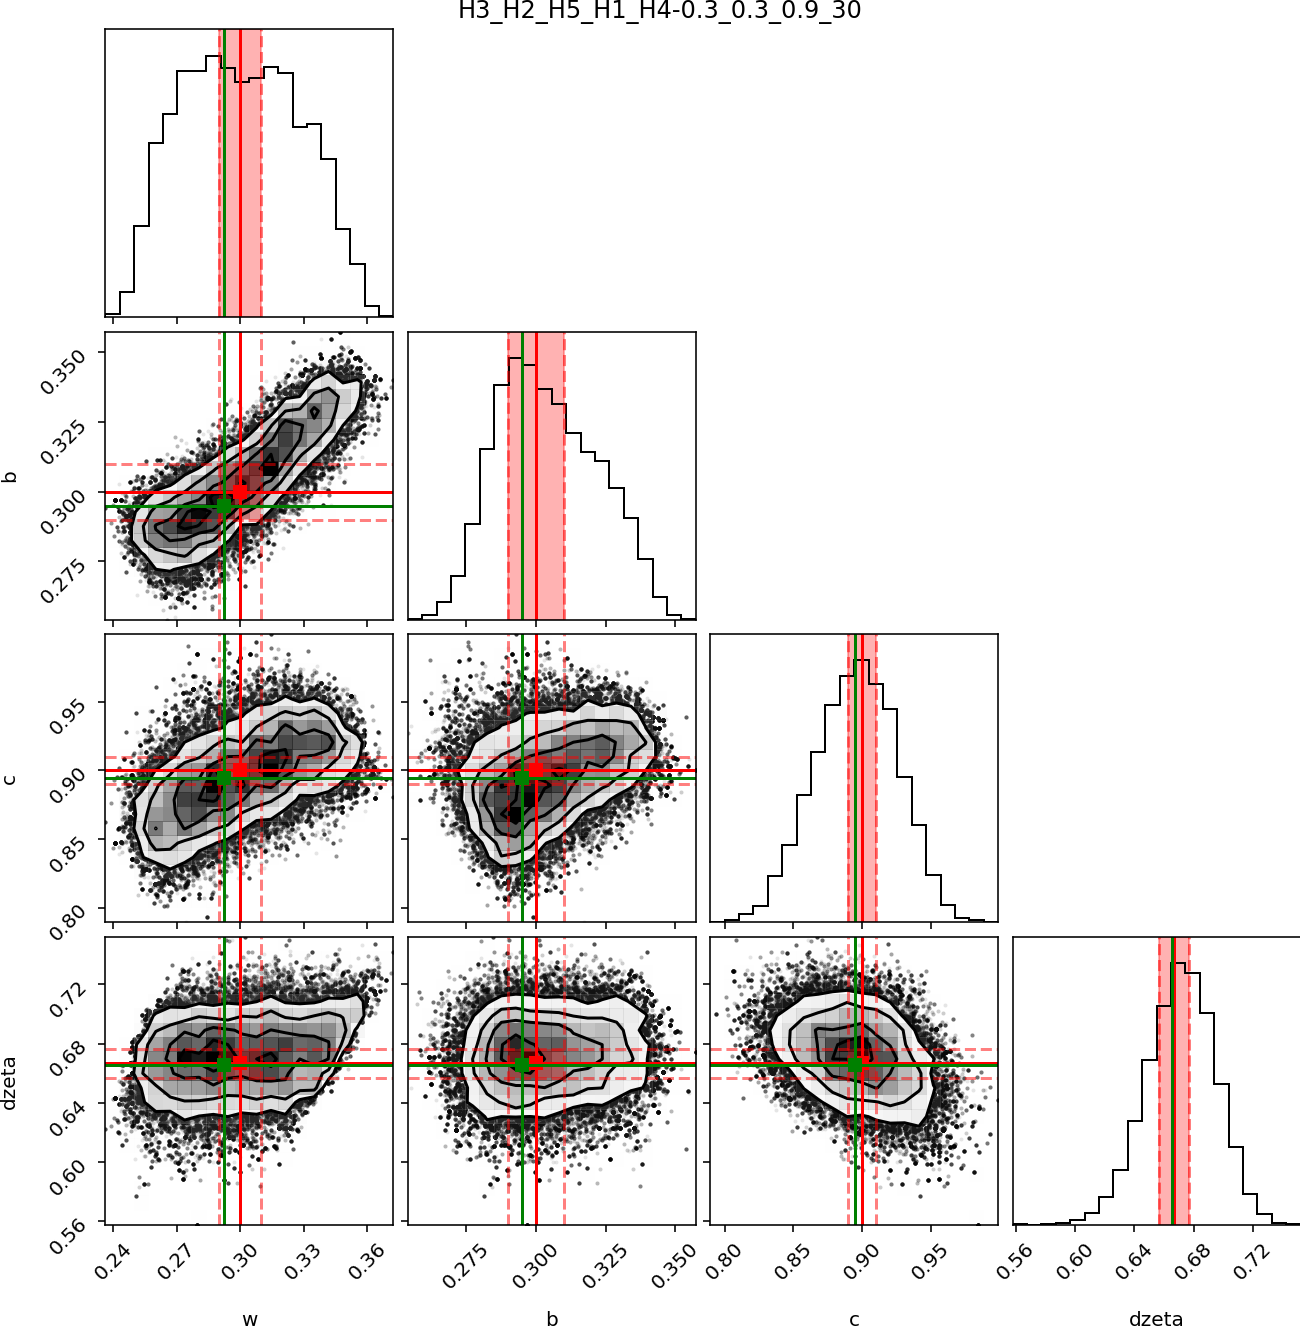
Figure 2 : Results of the mc3 tool for the inversion of the synthetic reflectance at an SNR of 10% for a combination of 5 orbits with a target at 70o latitude for a surface photometric property of (ω=0.9, b=0.9, c=0.1 and ζ=30) and (ω=0.3, b=0.3, c=0.9 and ζ=30).
This approach enables the explicit identification of the incidence, emergence and phase angle combinations that are most effective in predicting the physical parameters of a given type of microtexture. By comparing the proxy value, we demonstrate that 25 observations (5 observations for each of 5 orbit) at 10% noise level contains less information that 15 observations (5 observations for each of 3 orbit) at 2% noise level.
4 - Conclusions
This results provide critical insights into the optimal orbital geometries and observation strategies needed to robustly retrieve lunar surface properties. By identifying the most effective measurements configurations, this work lays the foundation for enhancing the scientific return of future photometric missions, contributing to a deeper understanding of the Moon’s regolith evolution and aiding the preparation for upcoming exploration activities.
References
[1] H. Sato et al. Journal of Geophysical Research: Planets, 2014.
[2] J. Fernando. Thesis, Université Paris Sud - Paris XI, 2014.
[3] J. Fernando et al. Planetary and Space Science, 2016.
[4] I. Belgacem et al. Icarus, 2020.
[5] K. Mosegaard et al. Journal of Geophysical Research, 1995.
[6] P. Cubillos et al. The Astronomical Journal, 2016.
[7] F. Schmidt et al. Icarus, 2019.
[8] A. F. McGuire et al. Icarus, 1995.
[A] J. Frydenvang et al., this meeting, https://meetingorganizer.copernicus.org/EPSC-DPS2025/EPSC-DPS2025-318.html
How to cite: Lancery, H., Schmidt, F., Andrieu, F., Frydenvag, J., Mosegaard, K., and Fernandes, I.: Optimal Photometric geometries for a space mission, EPSC-DPS Joint Meeting 2025, Helsinki, Finland, 7–13 Sep 2025, EPSC-DPS2025-267, https://doi.org/10.5194/epsc-dps2025-267, 2025.