
 1,2,1,1,1,1
- 1German Aerospace Center (DLR), Institute of Planetary Research, Berlin, Germany
- 2The University of Tokyo, Tokyo, Japan
Introduction
Estimating Mercury’s radial contraction is crucial to understanding the planet’s geologic evolution as it reflects cooling of the interior and growth of the solid inner core [e.g., 1]. Radial contraction has been estimated by mapping shortening structures, such as wrinkle ridges and lobate scarps [e.g., 2, 3]. Depending on the interpretation of small shortening structures, previous studies have estimated Mercury’s radial contraction to be 1–2 km, or up to 7 km. These estimates are used as constraints to thermos-chemical evolution models [e.g., 1]; however, it is unclear whether all shortening structures have been successfully detected on Mercury.
A key to this question lies in the heterogeneous distribution of shortening structures. The density of contractional landforms mapped by previous works [e.g., 4] shows deficits at some locations (Figure 1). While tectonic mapping could be biased by the geometric conditions of the MESSENGER observations [5], the deficit is not consistent with the expected longitudinal patterns. Mantle dynamic pressure could also affect the distribution of long fault scarps [6], but the deficits exist even where compressional tectonism is anticipated. An alternative hypothesis is the obscuration of landforms by extensive ejecta from large impact craters and basins [5], which needs further investigation.
To identify young ejecta that might blanket tectonic landforms, we characterize surface freshness using topographic roughness. Although crater formation increases roughness due to ejecta deposition and secondary craters, subsequent mass-wasting events triggered by impact-induced seismic shakings generally reduce topographic reliefs. Therefore, roughness can be used as a proxy for surface age in one geologic unit [7]. However, roughness data at kilometric baselines have been limited to the north-polar region due to a lack of global high-resolution topography data.
In this study, we create a global roughness map based on the latest high-resolution digital terrain model (DTM) [8] to quantitatively investigate the obscuration of tectonic landforms by ejecta. We then discuss how this process affects estimates of Mercury’s radial contraction.
Method
As an indicator of topographic roughness, we focused on the statistics of topographic curvatures [e.g., 7]. We calculated topographic curvature at each location by comparing surface heights at points separated by a certain distance (i.e., baseline). The difference between 75 % and 25 % quantiles of curvatures within a 5-km moving window was calculated at each location to map the spatial distribution of roughness. This roughness analysis was conducted at baselines down to the effective DTM resolution of 5 km [8]. The derived roughness values were validated in comparison with the MESSENGER laser altimetry data to correct roughness bias in image-based DTM.
Results and discussion
Figure 1 shows the created roughness map of Mercury at the baseline of 5 km, where various geologic features are reflected. For example, the largest variation is caused by the smooth plains [9]. In addition, continuous ejecta of large young craters [10] exhibit roughness enhancement.
Furthermore, this roughness map shows a spatial anti-correlation between roughness and the distribution of shortening structures. Similar to the high-roughness ejecta regions, a high-roughness region (outlined by the cyan dashed line in Figure 1) also exhibits fewer shortening structures. This anti-correlation is confirmed by statistical analysis of roughness at the contractional landforms and across the whole plain (Figure 2). When the 5-km moving window contains contractional landforms (histograms in Figure 2), roughness tends to be lower than that across the whole plains including high roughness areas lacking contractional features (lines in Figure 2). The difference in the mean roughness is statistically significant (t-statistic of > 50 for both plains).
This anti-correlation may suggest three possibilities. Firstly, ejecta deposition from younger basins may mask older tectonic features. Secondly, roughness may make it difficult to detect tectonic landforms by visual inspection. Thirdly, contractional landforms could be less likely to form in rough regions. Heavily cratered (i.e., rough) terrains may have porous thick regolith [11], which makes local crustal material less competent for fault formations.
We propose a roughness-based correction of radial contraction using the latest tectonic contraction map [12]. The cumulative average decreases with increasing roughness (Figure 3). Since strain values at low-roughness regions are less affected by obscuration, the cumulative ratio at low roughness could represent the actual radial contraction. While the corrected value depends on many factors, such as the interpretation of small shortening structures, underestimation due to the obscuration can reach 2 km. Combined with the radial contraction of 2.1 km that can be accumulated by elastic deformation prior to the onset of fracturing in Mercury’s lithosphere [13], estimates of Mercury’s radial contraction from the tectonic record need to be increased by 4 km for future comparison with interior evolution models.
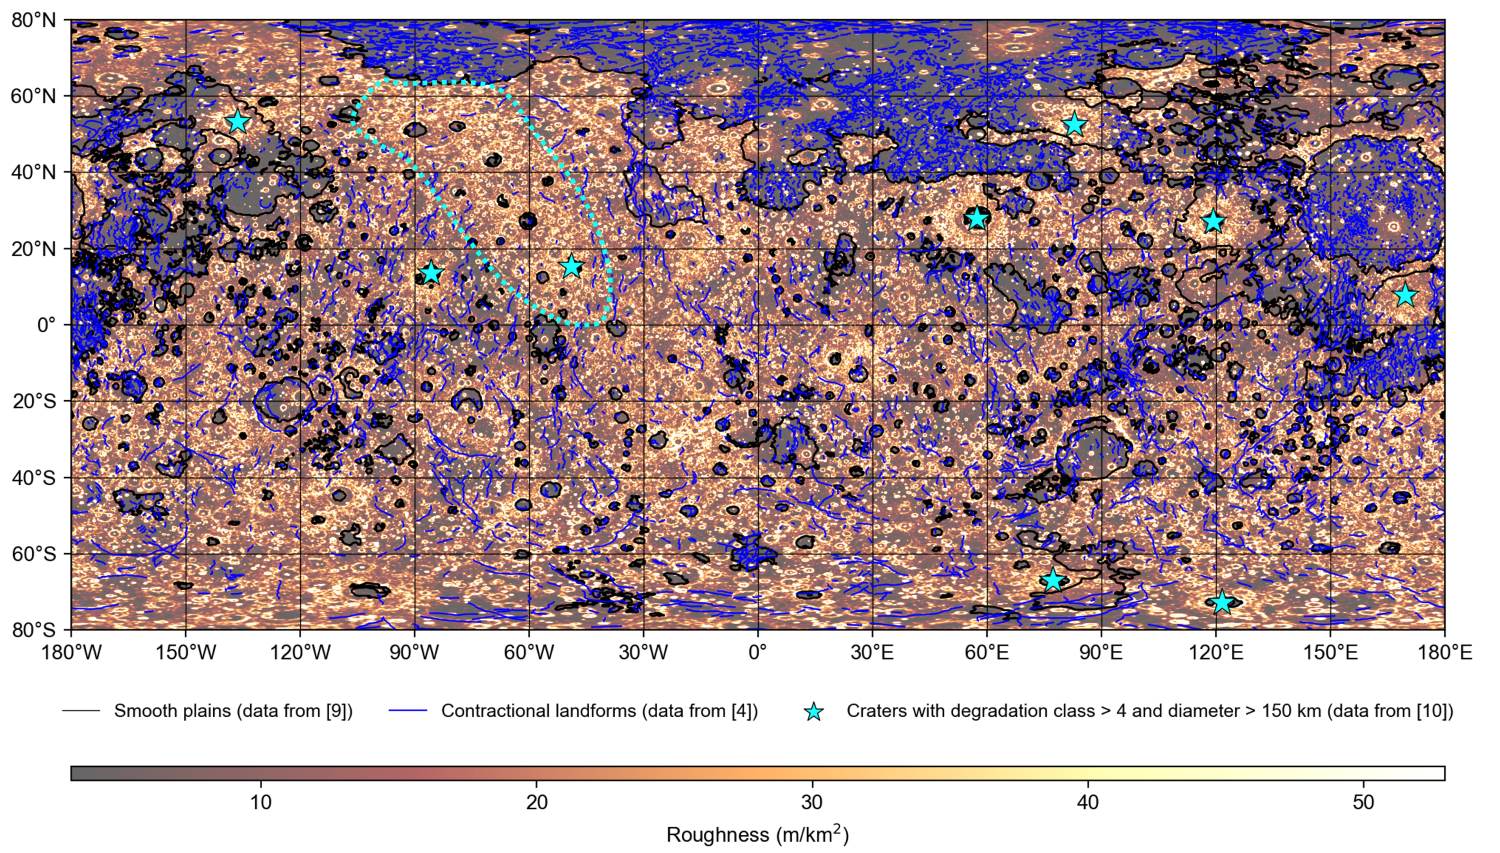
Figure 1. The roughness map with geologic features, such as smooth plains, contractional landforms, and large young craters and basins.
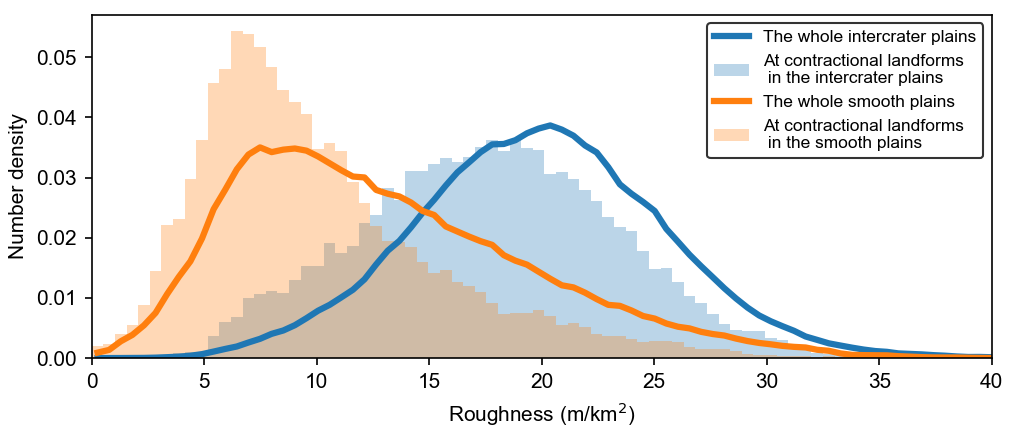
Figure 2. Histograms of roughness distribution across the whole plains and where the surface contains contractional landforms within its 5-km moving window. The blue and orange histograms show distributions for the intercrater plains and smooth plains, respectively.
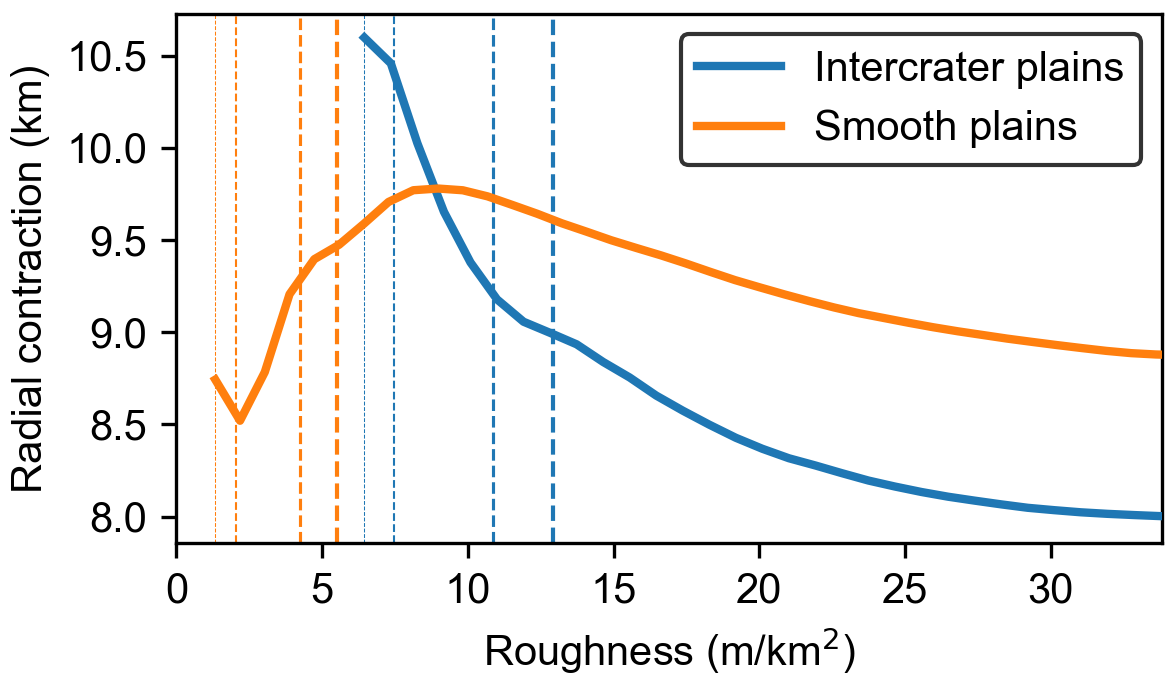
Figure 3. Cumulative average of Mercury’s radial contraction as a function of roughness. The blue and orange dashed lines show roughness values at 0.5, 1, 5, and 10 % quantiles, respectively.
References
[1] Tosi et al. (2013), JGR: Planets, 118, 12, 2474–2487.
[2] Byrne et al. (2014), Nat. Geosci., 7, 4, 301–307.
[3] Watters (2021), Commun. Earth Environ., 2, 1, 1–9.
[4] Klimczak et al. (2025), EPSL, 658, 119331.
[5] Byrne et al. (2018), Mercury: The view after MESSENGER, 249–286.
[6] Watters et al. (2021), GRL, 48, 17, e2021GL093528.
[7] Kreslavsky et al. (2014), GRL, 41, 23, 8245–8251.
[8] Preusker et al. (2017), PSS, 142, 26–37.
[9] Denevi et al. (2013), JGR: Planets, 118, 5, 891–907.
[10] Kinczyk et al. (2019), Icarus, 341, 113637.
[11] Broquet et al. (2024), GRL, 51, 21, e2024GL110583.
[12] Broquet & Andrews-Hanna, submitted to Icarus.
[13] Klimczak, (2015), JGR: Planets, 120, 12, 2135–2151.
Acknowledgment
This work was supported by JSPS KAKENHI Grant Number JP22K21344 and JSPS Overseas Research Fellowship.
How to cite: Nishiyama, G., Preusker, F., Broquet, A., Stark, A., Hussmann, H., Tosi, N., and Hauber, E.: Correcting Mercury’s Radial Contraction for Obscuration of Shortening Structures by Surface Roughness, EPSC-DPS Joint Meeting 2025, Helsinki, Finland, 7–12 Sep 2025, EPSC-DPS2025-290, https://doi.org/10.5194/epsc-dps2025-290, 2025.