Multiple terms: term1 term2
red apples
returns results with all terms like:
Fructose levels in red and green apples
Precise match in quotes: "term1 term2"
"red apples"
returns results matching exactly like:
Anthocyanin biosynthesis in red apples
Exclude a term with -: term1 -term2
apples -red
returns results containing apples but not red:
Malic acid in green apples
hits for "" in
Network problems
Server timeout
Invalid search term
Too many requests
Empty search term
TP5

This session invites observational, analytical, theoretical, and analogue fieldwork research into any aspect of planetary endogenic processes. We welcome submissions on comparing landforms and processes on multiple bodies; geochemical and chronological data from planetary material; numerical modeling studies; tectonics and seismicity across the Solar System; theoretical and technical designs for current or future missions; as well as data analysis and insights on the seismicity and interior structures of planets and small bodies.
Session assets
Introduction
Estimating Mercury’s radial contraction is crucial to understanding the planet’s geologic evolution as it reflects cooling of the interior and growth of the solid inner core [e.g., 1]. Radial contraction has been estimated by mapping shortening structures, such as wrinkle ridges and lobate scarps [e.g., 2, 3]. Depending on the interpretation of small shortening structures, previous studies have estimated Mercury’s radial contraction to be 1–2 km, or up to 7 km. These estimates are used as constraints to thermos-chemical evolution models [e.g., 1]; however, it is unclear whether all shortening structures have been successfully detected on Mercury.
A key to this question lies in the heterogeneous distribution of shortening structures. The density of contractional landforms mapped by previous works [e.g., 4] shows deficits at some locations (Figure 1). While tectonic mapping could be biased by the geometric conditions of the MESSENGER observations [5], the deficit is not consistent with the expected longitudinal patterns. Mantle dynamic pressure could also affect the distribution of long fault scarps [6], but the deficits exist even where compressional tectonism is anticipated. An alternative hypothesis is the obscuration of landforms by extensive ejecta from large impact craters and basins [5], which needs further investigation.
To identify young ejecta that might blanket tectonic landforms, we characterize surface freshness using topographic roughness. Although crater formation increases roughness due to ejecta deposition and secondary craters, subsequent mass-wasting events triggered by impact-induced seismic shakings generally reduce topographic reliefs. Therefore, roughness can be used as a proxy for surface age in one geologic unit [7]. However, roughness data at kilometric baselines have been limited to the north-polar region due to a lack of global high-resolution topography data.
In this study, we create a global roughness map based on the latest high-resolution digital terrain model (DTM) [8] to quantitatively investigate the obscuration of tectonic landforms by ejecta. We then discuss how this process affects estimates of Mercury’s radial contraction.
Method
As an indicator of topographic roughness, we focused on the statistics of topographic curvatures [e.g., 7]. We calculated topographic curvature at each location by comparing surface heights at points separated by a certain distance (i.e., baseline). The difference between 75 % and 25 % quantiles of curvatures within a 5-km moving window was calculated at each location to map the spatial distribution of roughness. This roughness analysis was conducted at baselines down to the effective DTM resolution of 5 km [8]. The derived roughness values were validated in comparison with the MESSENGER laser altimetry data to correct roughness bias in image-based DTM.
Results and discussion
Figure 1 shows the created roughness map of Mercury at the baseline of 5 km, where various geologic features are reflected. For example, the largest variation is caused by the smooth plains [9]. In addition, continuous ejecta of large young craters [10] exhibit roughness enhancement.
Furthermore, this roughness map shows a spatial anti-correlation between roughness and the distribution of shortening structures. Similar to the high-roughness ejecta regions, a high-roughness region (outlined by the cyan dashed line in Figure 1) also exhibits fewer shortening structures. This anti-correlation is confirmed by statistical analysis of roughness at the contractional landforms and across the whole plain (Figure 2). When the 5-km moving window contains contractional landforms (histograms in Figure 2), roughness tends to be lower than that across the whole plains including high roughness areas lacking contractional features (lines in Figure 2). The difference in the mean roughness is statistically significant (t-statistic of > 50 for both plains).
This anti-correlation may suggest three possibilities. Firstly, ejecta deposition from younger basins may mask older tectonic features. Secondly, roughness may make it difficult to detect tectonic landforms by visual inspection. Thirdly, contractional landforms could be less likely to form in rough regions. Heavily cratered (i.e., rough) terrains may have porous thick regolith [11], which makes local crustal material less competent for fault formations.
We propose a roughness-based correction of radial contraction using the latest tectonic contraction map [12]. The cumulative average decreases with increasing roughness (Figure 3). Since strain values at low-roughness regions are less affected by obscuration, the cumulative ratio at low roughness could represent the actual radial contraction. While the corrected value depends on many factors, such as the interpretation of small shortening structures, underestimation due to the obscuration can reach 2 km. Combined with the radial contraction of 2.1 km that can be accumulated by elastic deformation prior to the onset of fracturing in Mercury’s lithosphere [13], estimates of Mercury’s radial contraction from the tectonic record need to be increased by 4 km for future comparison with interior evolution models.
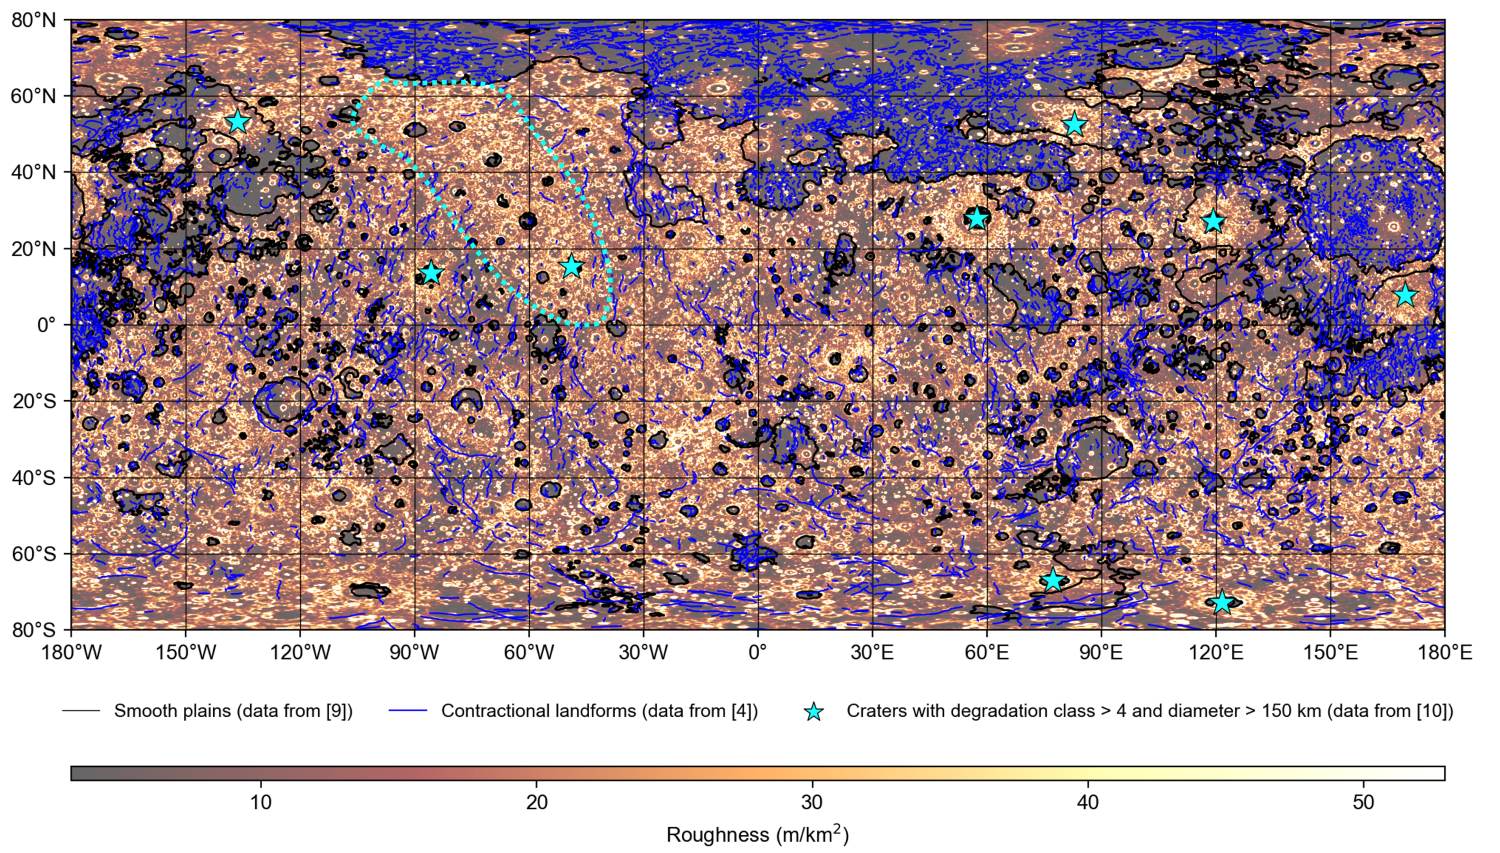
Figure 1. The roughness map with geologic features, such as smooth plains, contractional landforms, and large young craters and basins.
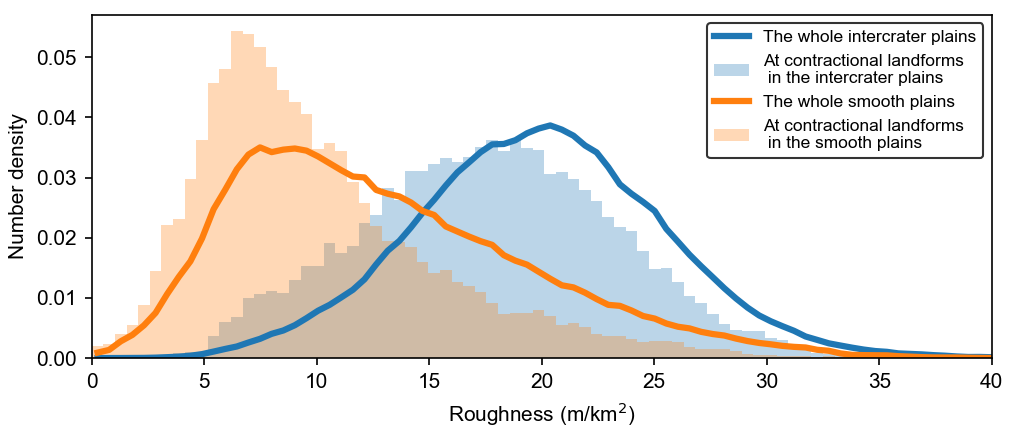
Figure 2. Histograms of roughness distribution across the whole plains and where the surface contains contractional landforms within its 5-km moving window. The blue and orange histograms show distributions for the intercrater plains and smooth plains, respectively.
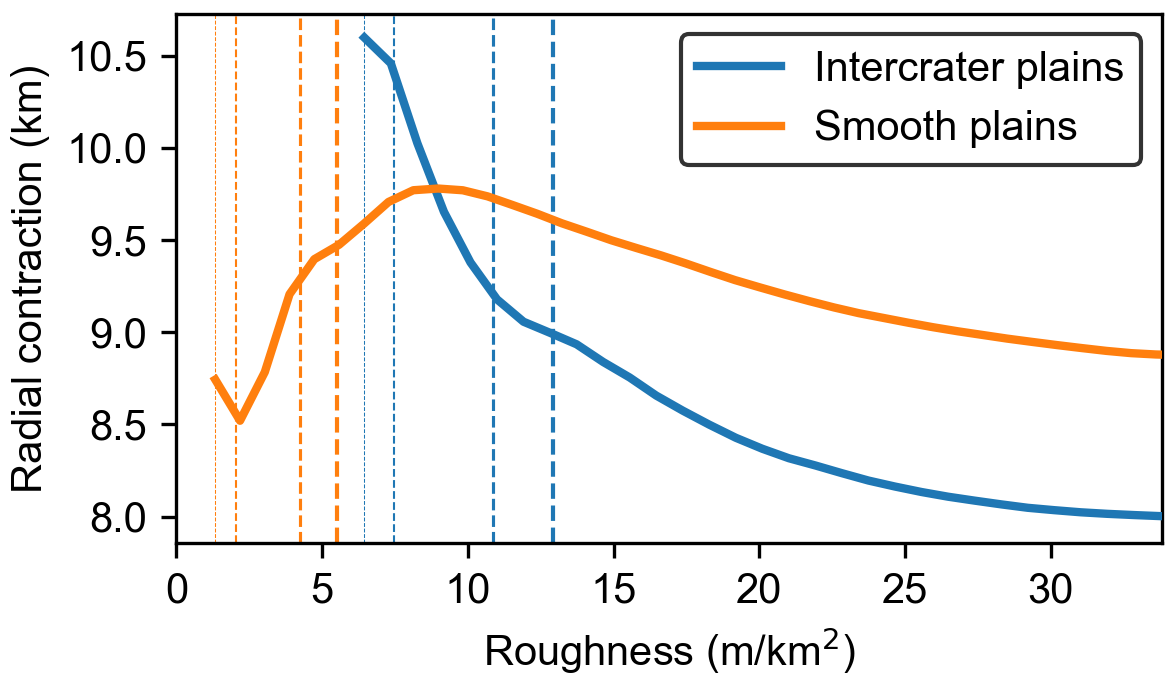
Figure 3. Cumulative average of Mercury’s radial contraction as a function of roughness. The blue and orange dashed lines show roughness values at 0.5, 1, 5, and 10 % quantiles, respectively.
References
[1] Tosi et al. (2013), JGR: Planets, 118, 12, 2474–2487.
[2] Byrne et al. (2014), Nat. Geosci., 7, 4, 301–307.
[3] Watters (2021), Commun. Earth Environ., 2, 1, 1–9.
[4] Klimczak et al. (2025), EPSL, 658, 119331.
[5] Byrne et al. (2018), Mercury: The view after MESSENGER, 249–286.
[6] Watters et al. (2021), GRL, 48, 17, e2021GL093528.
[7] Kreslavsky et al. (2014), GRL, 41, 23, 8245–8251.
[8] Preusker et al. (2017), PSS, 142, 26–37.
[9] Denevi et al. (2013), JGR: Planets, 118, 5, 891–907.
[10] Kinczyk et al. (2019), Icarus, 341, 113637.
[11] Broquet et al. (2024), GRL, 51, 21, e2024GL110583.
[12] Broquet & Andrews-Hanna, submitted to Icarus.
[13] Klimczak, (2015), JGR: Planets, 120, 12, 2135–2151.
Acknowledgment
This work was supported by JSPS KAKENHI Grant Number JP22K21344 and JSPS Overseas Research Fellowship.
How to cite: Nishiyama, G., Preusker, F., Broquet, A., Stark, A., Hussmann, H., Tosi, N., and Hauber, E.: Correcting Mercury’s Radial Contraction for Obscuration of Shortening Structures by Surface Roughness, EPSC-DPS Joint Meeting 2025, Helsinki, Finland, 7–13 Sep 2025, EPSC-DPS2025-290, https://doi.org/10.5194/epsc-dps2025-290, 2025.
Mercury’s geodynamic evolution has been characterized by a long history of global contraction in response to interior cooling and inner core growth [1]. A record of this history is preserved in the form of a global population of compressional landforms, including lobate scarps, high-relief ridges, and wrinkle ridges [2,3]. Different interpretations of Mercury’s tectonic record led to distinct contraction estimates of <2 km [2] or up to 7 km [3]. Proponents of the large contraction interpretation consider all tectonic landforms, including wrinkle ridges, as lithosphere-scale faults activated by global planetary contraction, while other interpret wrinkle ridges as thin-skinned structures that do not reflect global contraction. In addition, studies commonly use displacement-length ratios to estimate global contraction. However, it is unclear whether such approach can adequately infer global contraction from tectonic databases that are subject to ridge segmentation and where the shortening associated with individual faults might be overestimated with the mapping of secondary ridges [2]. A further key outstanding question is to what extent strain from deformation of the lithosphere contributes to the tectonic record.
Here, we revisit Mercury’s tectonic record using a global tectonic database [4] together with machine learning to evaluate tectonic strain. We then invert observed gravity and topography to estimate how lithospheric deformation contribute to the tectonic record.
Methods:
Ridge database. We extract 1-km-spaced elevation profiles from a global DEM [5] at each of the 18,500 individual ridge segments mapped by [4] (Fig. 1A). The profiles are outlier-corrected, detrended, shifted and aligned to construct a representative average profile for each segment.
Primary ridges. In some previous work, an independent fault was attributed to each tectonic landform, including small scarps on the shoulder of a larger ridge, which can lead to instances of double counting of strain [2,3]. To avoid this issue and map primary structures, we created a 100-km-wide rectangular box along each ridge segment. A ridge is considered as primary if it is not intersecting any other box, or if it is intersecting other boxes including parallel ridges over >20% of the rectangular box area, but is the longest of all. This approach removes small secondary ridges that are parallel and in close vicinity to a longer ridge, and assumes that the removed ridges are related to the primary fault that formed the longest regional ridge in that specific direction.
Tectonic strain. We constructed a Keras neural network [5] to map ridge endpoints in profiles orthogonal to the ridge strike. The network was trained on 100 visually inspected profiles for which we provided ridge endpoints. Ridge height is estimated as the elevation difference between ridge crest and endpoints. Comparison to previous mapping indicates the network adequately estimates ridge height. Tectonic shortening is estimated assuming a 30° dip and contraction is mapped considering ridge orientation, location, and height.
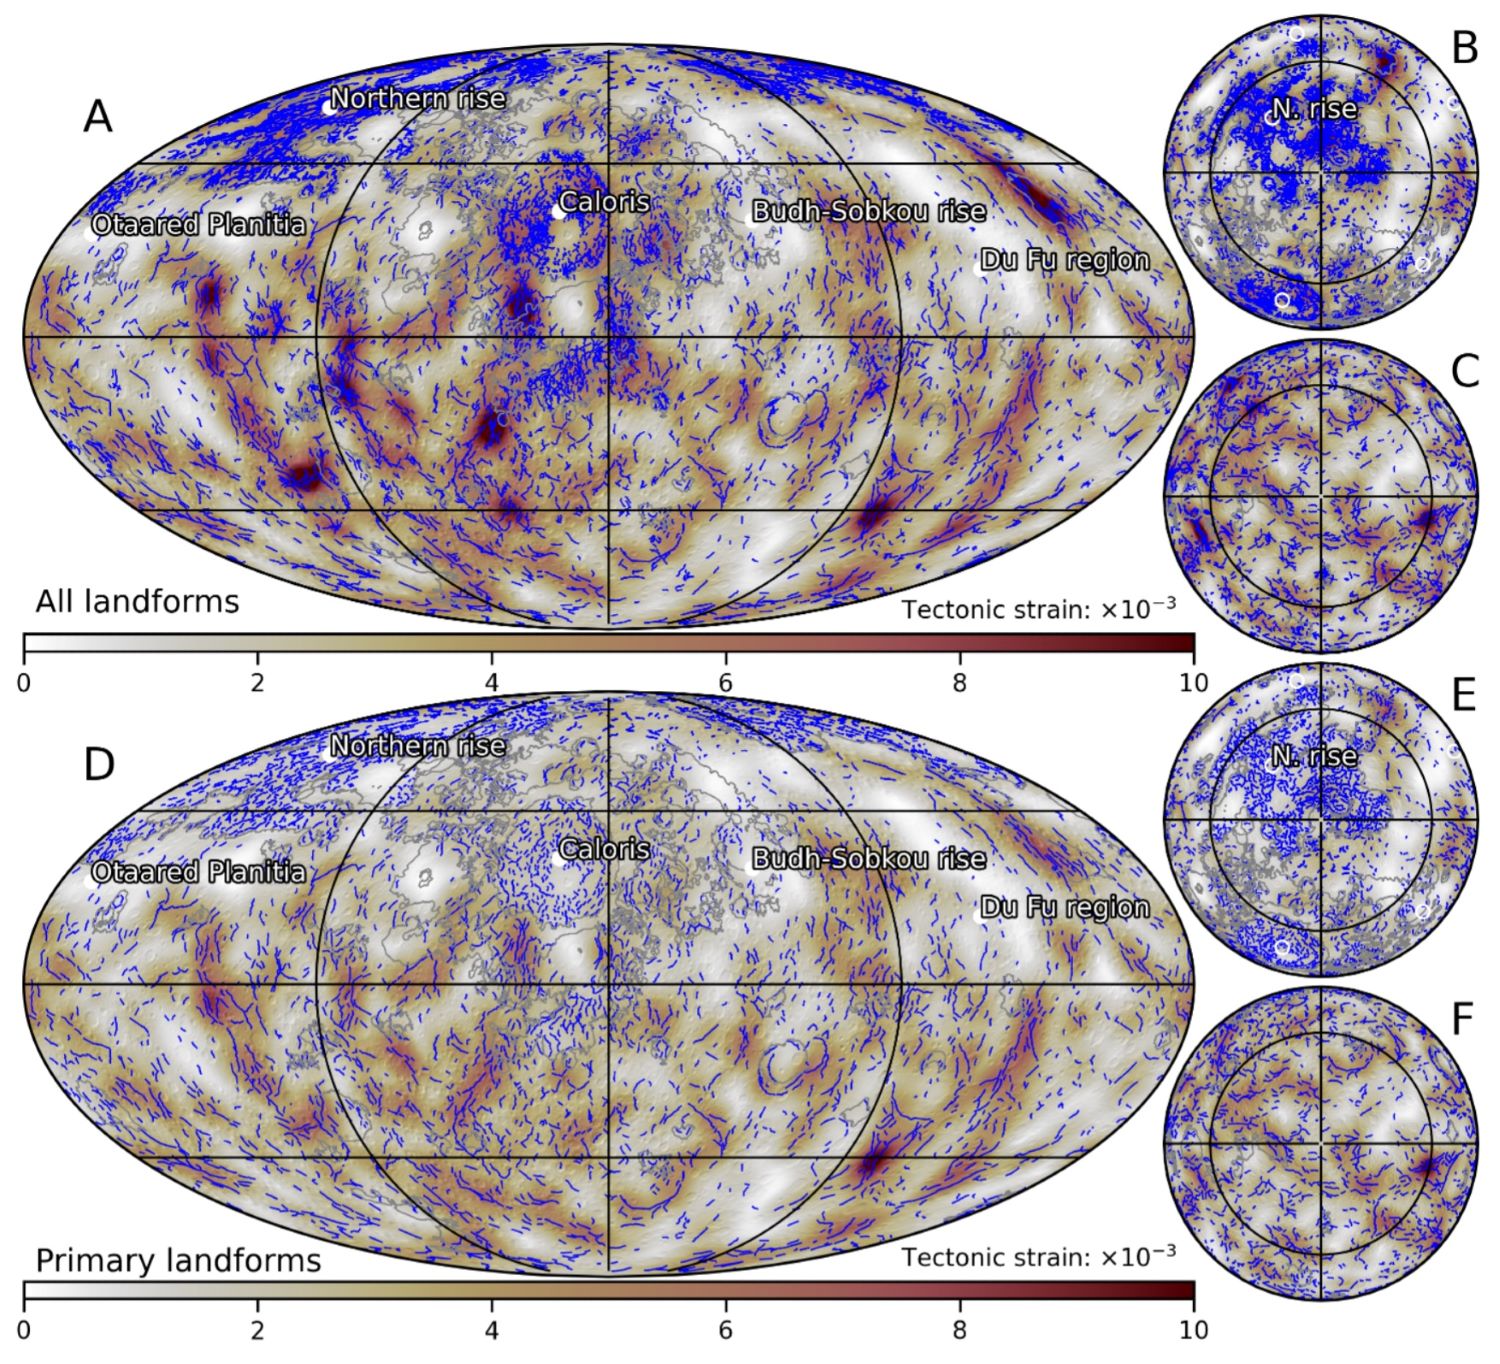
Fig. 1: Tectonic strain considering all (top) and primary (bottom) landforms. The leftmost maps are in Mollweide projection (A, D) and others are in north (B, E) and south (C, F) polar projections. Tectonic landforms are shown in blue and smooth plains are in grey.
Membrane-flexural strain. In one inversion, crustal loading and lithospheric flexure are used to infer membrane-flexural strain, with crustal top/bottom loads being constrained from gravity and topography [6]. In a second inversion, we use a combination of crustal and mantle loading, together with lithospheric flexure. Long-wavelength gravity and topography are assumed to result from an isostatic crust with crustal top/bottom loads in the isostatic ratio, combined with support from a variable density mantle. Shorter wavelengths are attributed to crustal loading and the transition between both regimes is defined by a cosine taper with a 10-degree bandwidth and half amplitude at degree 15 [6]. We assume average elastic and crustal thicknesses of 40 and 30 km, respectively.
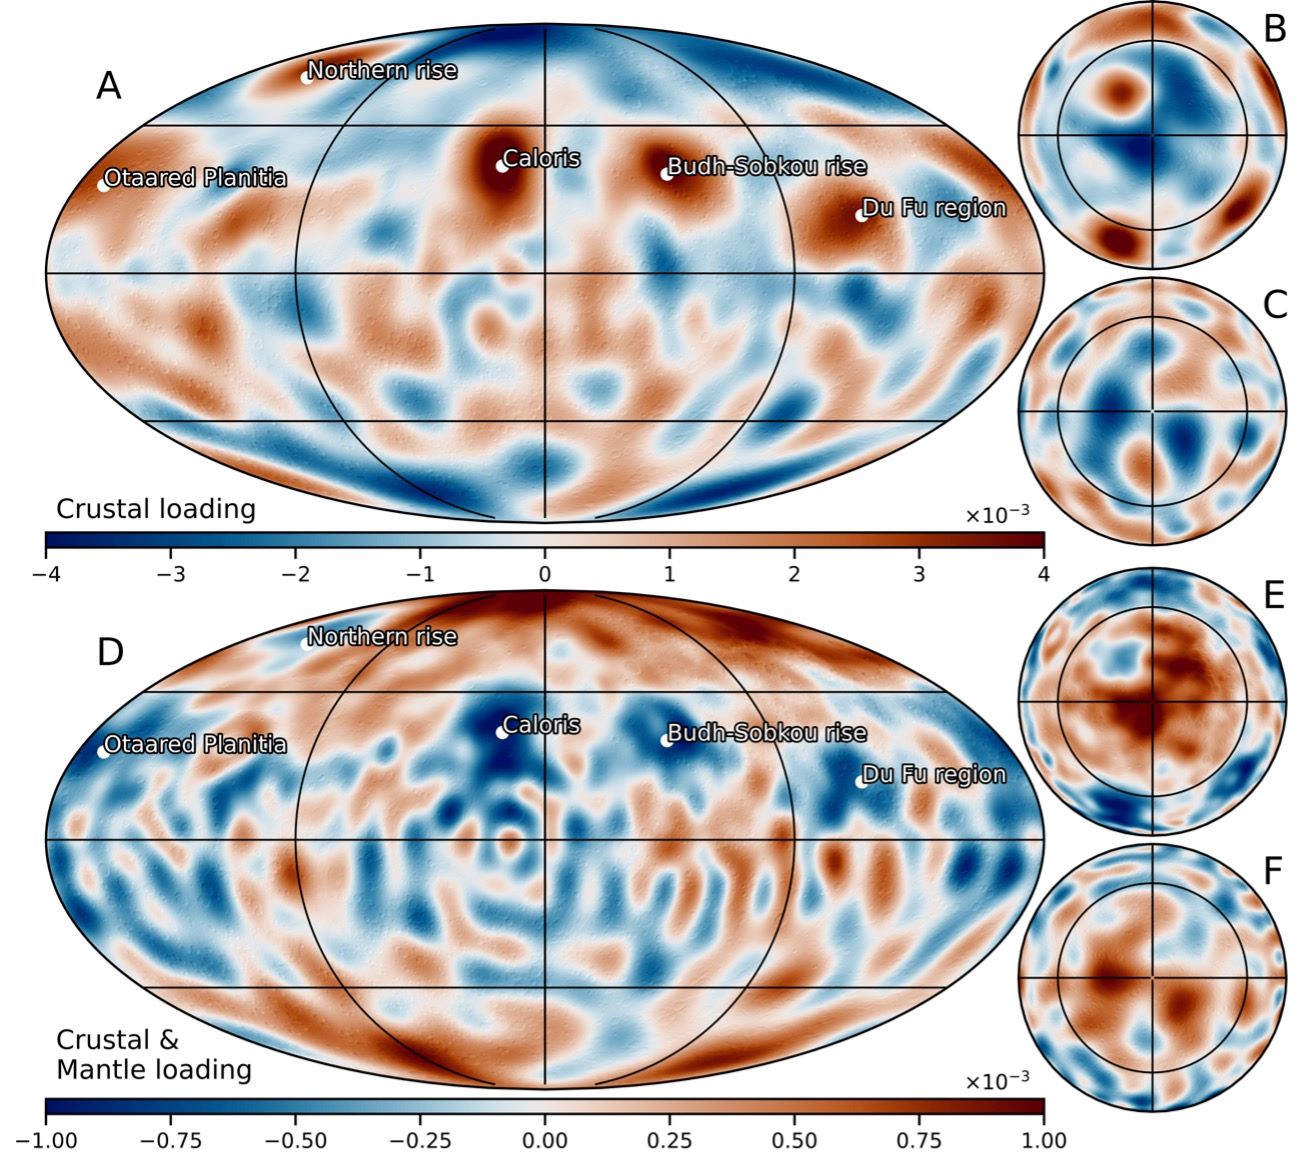
Fig. 2: Membrane-flexural strains considering crustal loading (top) or a combination of crustal and mantle loading (bottom).
Results & conclusions:
Considering that all compressional landforms are associated with an individual fault whose displacement is represented by the relief of the overlying ridge, we obtain an average global strain of 3.4±1.8×10⁻³ and contraction of 8.3±4.3 km, consistent with previous work (Fig. 1A, [3]). For our preferred approach using primary landforms, strain and contraction are decreased to 2.6±1.3×10⁻³ and 6.3±3.2 km (Fig. 1C). Even in this conservative case, the global contraction recorded in the cratered terrain of 6.6 km is markedly higher than ~1.2 km estimated when neglecting wrinkle ridges [2].
Tectonic strain exhibits prominent lateral variation, with regions experiencing near-zero strain, while others recorded strains >10×10-3. There is a general lack of significant compressional tectonics in the northern and Budh-Sobkou rises as well as the Caloris, Otaared, and Du Fu regions. Long-wavelength mantle support predicts uplift and extension in these regions, thereby providing an explanation for the local tectonic strain deficit (Fig. 2D). A substantial fraction of the flexural uplift at these locals must either pre-date or have occurred concurrently to global contraction, early in Mercury’s geologic history. Tilted crater floors is some of these regions imply uplift and global contraction at <4.1 Ga [7]. The uplift preservation suggests long-standing thermal/compositional mantle anomalies supporting topography or crustal underplating.
Other regions with a tectonic strain excess/deficit can also be partly explained by local deformation of the lithosphere, and this indicates that membrane-flexural strain can counteract contraction as well as add to it. In the northern smooth plains, the mantle support model predicts prominent membrane-flexural compression (Fig. 2). Although such compression would partially contribute to the overconcentration of wrinkle ridges and the associated regional strain, completely neglecting the compressional tectonics in this region would underestimate the contractional strain. Thus, future work must consider membrane-flexural strains and mantle support as an important contribution to Mercury’s tectonic record.
[1] Hauck S.A. et al. (2004) EPSL, 222. [2] Watters T.R. (2021) Nat. Com., 2. [3] Byrne P.K. et al. (2014) Nat. Geo., 7. [4] Klimczak, C. et al. (2025) EPSL, 658. [5] Abadi M. et al. (2016) 12th USENIX Conference. [6] James P.B. et al. (2015) JGR:Planets, 120. [7] Zuber M.T. et al. (2012) Science 336.
How to cite: Broquet, A. and Andrews-Hanna, J. C.: Mercury's geodynamic and tectonic history, EPSC-DPS Joint Meeting 2025, Helsinki, Finland, 7–13 Sep 2025, EPSC-DPS2025-489, https://doi.org/10.5194/epsc-dps2025-489, 2025.
Introduction: The global distribution of shortening structures on Mercury as well as geographic and temporal trends of their morphometric and structural parameters are key to learn more about the planets’ history of contraction, tidal despinning, and lithologic/rheologic variations in its current crust [1–6]. Mapping efforts carried out over the past decade by [4,5,7,8] had access only to limited topographic data [9–12] which prevented comprehensive morphometric analyses other than displacement-length (D/L) assessments of only the largest scarps. Furthermore, as recently elaborated on by [8], the association of shortening structures with larger tectonic complexes needs to be assessed to derive a more realistic inventory of actually implied faults. We have produced a new global map and morphometric parameter catalog of shortening structures (i.e., lobate scarps, high-relief ridges, wrinkle ridges) on Mercury (“MerCatSS” – Mercury Catalog of Shortening Structures) using the final MDIS mosaics (166 m/px) in combination with novel stereo-imaging-derived DTMs (222 m/px) that we completed for the entire globe based on preliminary earlier work [10–12] (Fig. 1). The goal of MerCatSS is to provide the community with an agnostic, yet comprehensive dataset for a multitude of further analyses and to serve as vantage point for refinements enabled by future data by Bepi-Colombo.
Data & methodology: We established a thorough step-by-step procedure [13] to map and parametrize each identified shortening structure (including individual front and back scarps of wrinkle ridges). To ensure consistency, polyline digitization is carried out with a fixed vertex spacing of 2 km. Parameters that have been measured or derived for every single fault scarp include geodetic length, maximum relief, D/L (derived from relief), maximum width and width at point of maximum relief, assignment to a scarp complex/cluster if possible, vergence, lobateness, whether they are concentric to an ancient basin, or if they are (partially) within a crater.
Select results: MerCatSS is the most detailed and comprehensive map to date of tectonic shortening structures on Mercury excluding the northern plains (which have already been thoroughly mapped by [1]). We identified 6,873 fault scarps (1,462 of which are uncertain), 705 ridges bound by antithetic fault scarps (including wrinkle ridges on smooth plains), and 471 tentative, undifferentiated high-relief ridges of potential tectonic origin but not associated with any fault scarps. Approximately 57% of our mapped fault scarps had not been recognized by [4,14] (does not include partially recognized structures). No longitudinal or latitudinal trends in fault scarp density or average length are apparent although both parameters are geographically very heterogeneous (Fig, 1). While average scarp length shows no clear geographic trends, scarp density (outside smooth plains) is significantly higher along curvilinear bands around the Caloris basin and the ancient basins “b56”, “b57”, and “b90” as mapped by [15] (Fig. 1). This might indicate areas of structurally weakened crust by specific basin-forming events, potentially a function of basin size and age.
Across the globe, over a fifth of fault scarps outside of smooth plains are concentric (quasi-parallel and within one basin radius to its outline) to large, ancient basins as mapped by [15], e.g., the Andal-Coleridge, Sobkou, or Vincent-Yakolev basins. This indicates that global scarp orientation patterns need to be re-examined as they have been significantly affected by basin-related crustal structures. In general, MerCatSS confirms that N-S orientations dominate along the equator, which is indicative of tidal spindown [5,14,16,17].
Release: MerCatSS is available for download at https://www.geol.umd.edu/~hbernhar/.
Figure 1: Robinson projection of MerCatSS, the most detailed and comprehensive tectonic map of Mercury to date. Here, a color-coded density map of all 6,873 mapped fault scarps (black lines with sawteeth) is superposed on two heatmaps: One green-to-red of the fault scarp, i.e., line, density, and one grey-to-white of the average fault scarp length within 300 km-sized bins. Grey areas are smooth plains (which include the northern plains, i.e., Vastitas Borealis) as mapped by [18] which have been cut out in this figure. Wrinkle ridges and undifferentiated ridges mapped as part of MerCatSS are also not shown. White circles show ancient impact basins as mapped by [15].
References: [1] K.T. Crane, C. Klimczak, Icarus 317 (2019) 66–80. [2] M.E. Banks, Z. Xiao, S.E. Braden, N.G. Barlow, C.R. Chapman, C.I. Fassett, S. Marchi, J. Geophys. Res. Planets 122 (2017) 1010–1020. [3] M.E. Banks, Z. Xiao, T.R. Watters, R.G. Strom, S.E. Braden, C.R. Chapman, S.C. Solomon, C. Klimczak, P.K. Byrne, J. Geophys. Res. Planets 120 (2015). [4] P.K. Byrne, C. Klimczak, A.M. Celâl Şengör, S.C. Solomon, T.R. Watters, S.A. Hauck, Nat. Geosci. (2014) 1–7. [5] C. Klimczak, K.T. Crane, P.K. Byrne, in: Lunar Planet. Sci. Conf., 2023, p. 1122. [6] R.G. Strom, N.J. Trask, J.E. Guest, J. Geophys. Res. 80 (1975) 2478–2507. [7] B. Man, D.A. Rothery, M.R. Balme, S.J. Conway, J. Wright, Nat. Geosci. (2023). [8] T.R. Watters, Commun. Earth Environ. 2 (2021) 9. [9] K.J. Becker, M.S. Robinson, T.L. Becker, L.A. Weller, K.L. Edmundson, G.A. Neumann, M.. E. Perry, S.C. Solomon, in: Lunar Planet. Sci. Conf., 2016, p. 2959. [10] A. Stark, F.Preusker, J. Oberst, K.-D. Matz, K. Gwinner, T. Roatsch, in: Lunar Planet. Sci. Conf., 2017, p. 2287. [11] J. Oberst, F. Preusker, A. Stark, K.-D. Matz, K. Gwinner, T. Roatsch, in: Lunar Planet. Sci. Conf., 2017, p. 1442. [12] F. Preusker, A. Stark, J. Oberst, K.-D. Matz,K. Gwinner, T. Roatsch, T.R. Watters, Planet. Space Sci. 142 (2017) 26–37. [13] H.Bernhardt, J.D. Clark, F. Preusker, C. Klimczak, M.E. Banks, D.A. Williams, D.M. Nelson, T.R. Watters, in: Eur. Sci. Congr., Granada, Spain, 2022. [14] P.K. Byrne, in: Oxf. Res. Encycl. Planet. Sci., Oxford University Press, 2019, pp. 1–30. [15] C. Orgel, C.I. Fassett, G. Michael, C. Riedel, C.H. van der Bogert, H. Hiesinger, J. Geophys. Res. Planets 125 (2020). [16] T.R. Watters, M.M. Selvans, M.E. Banks, S.A. Hauck, K.J. Becker, M.S. Robinson, Geophys. Res. Lett. 42 (2015) 3755–3763. [17] A.J. Dombard, S.A. Hauck, Icarus 198(2008) 274–276. [18] B.W. Denevi, C.M. Ernst, H.M. Meyer, M.S. Robinson, S.L. Murchie, J.L. Whitten, J.W. Head, T.R. Watters, S.C. Solomon, L.R. Ostrach, C.R. Chapman, P.K. Byrne, C. Klimczak, P.N. Peplowski, J. Geophys. Res. Planets 118 (2013) 891–907
How to cite: Bernhardt, H., Clark, J. D., Crane, K. T., Preusker, F., Klimczak, C., Banks, M. E., Frueh, T., Williams, D. A., Nelson, D., and Watters, T. R.: THE MERCURY CATALOG OF SHORTENING STRUCTURES (MerCatSS): THE MOST COMPLETE AND ACCURATE TECTONIC MAP OF MERCURY, EPSC-DPS Joint Meeting 2025, Helsinki, Finland, 7–13 Sep 2025, EPSC-DPS2025-2108, https://doi.org/10.5194/epsc-dps2025-2108, 2025.
Introduction: The Moon has been suggested to have a highly asymmetric volcanic history, with at least three times more volcanic activity recorded on the nearside with respect to the farside [1]. One possible explanation to the asymmetry has been suggested to be the asymmetric distribution of subsurface Heat Producing Elements (HPE, i.e. Th, U, and K) [2]. However, the timeline and nature of a potential redistribution of HPE, during or after the lunar magma ocean (LMO) solidification, remains highly debated [3].
Here, we investigate the lateral distribution and concentration of HPE, testing various extents and enrichments of a putative KREEP-rich anomaly formed during or after LMO crystallization [3]. Modeled present-day surface heat flux is compared to observations to identify best-fit models of lunar interior.
Methods: We model the thermal evolution of the Moon in a 3D spherical shell geometry, using the geodynamic code Gaia [4]. The code solves the conservation equations of mass, linear momentum and thermal energy, assuming a homogeneous mantle with purely Newtonian rheology and negligible inertia.
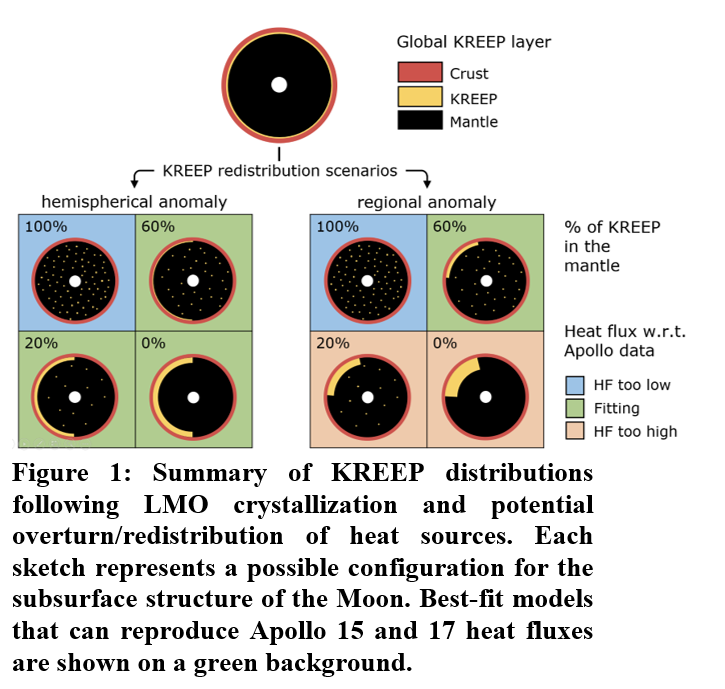
First, we use a simplified model setup consisting of a thin KREEP unit squeezed between a homogeneous mantle and a 39-km-thick crust. Using this setup, the lateral extent of the KREEP layer is varied between global, hemispherical (i.e. nearside), regional (i.e., 1300 km radius assuming circular geometry), and completely absent (Fig. 1).
Additionally, the concentration of HPE in the layer is varied to simulate different scenarios from a complete overturn and KREEP remixing (100% of KREEP in the mantle, no KREEP layer) to a perfectly efficient KREEP concentration underneath the nearside (0% of KREEP in the mantle, Fig. 1). For all scenarios, we compare the predicted heat flux to the Apollo measurements and discard inconsistent models.
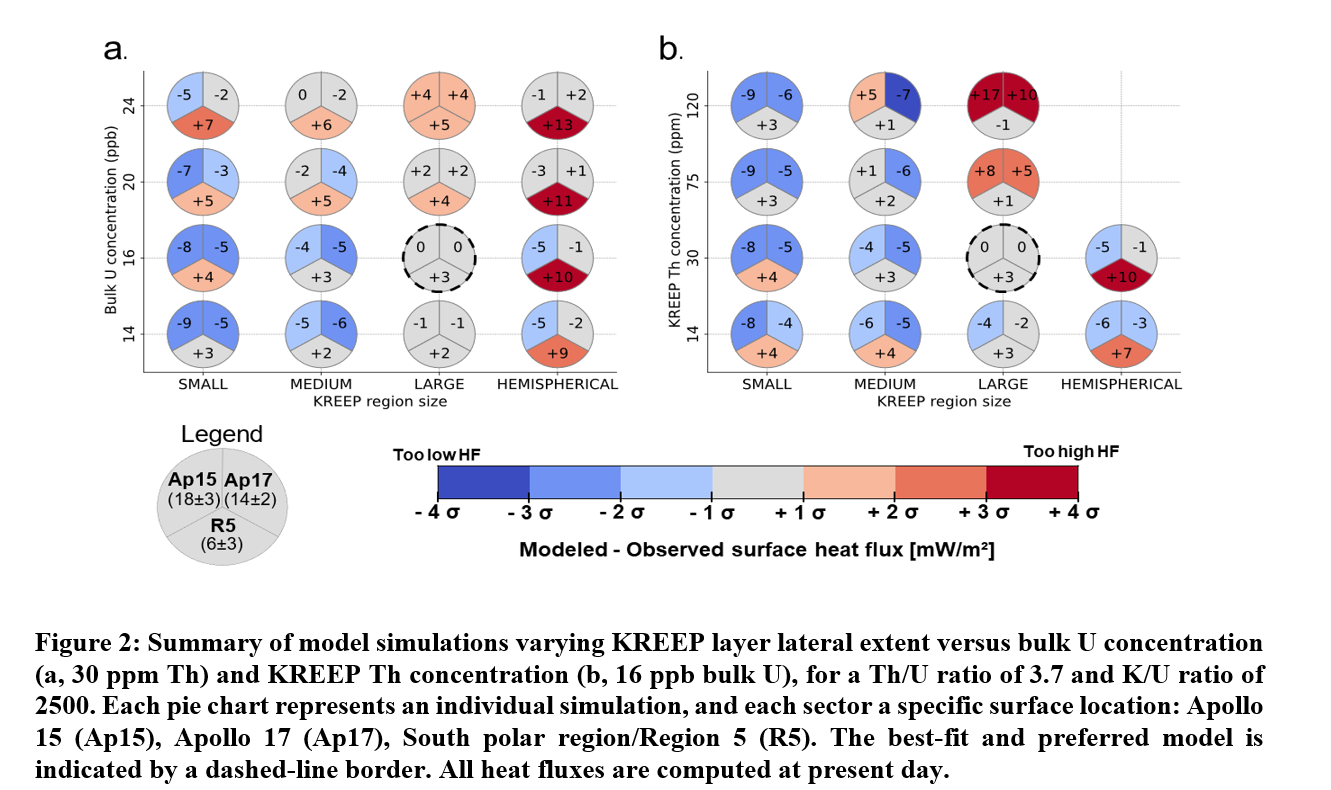
Next, we use a more sophisticated model, similar to [5], to investigate the local heat flux variability at the Apollo 15 and 17 landing sites, and in regions with remote-sensing low heat flux estimates [6]. This second model employs a laterally variable crustal thickness [7], and a laterally variable KREEP layer thickness that considers basin excavation.
In this second setup, we vary the lateral extent of the KREEP anomaly relative to the observed heat flux data. First, we assume all three locations of interest (Apollo 15 and 17 landing sites, and nearside south polar region) to be underlain by a hemispherical KREEP layer (Fig. 2). Additional models include a KREEP layer only beneath the two Apollo sites (large KREEP size model), only beneath Apollo 15 (medium KREEP size), and far from all three locations (small KREEP size). For each model configuration, we also vary the HPE concentration of the crust and KREEP layer, and the lunar bulk U abundance, and we select models that can reproduce currently observed lunar heat flux values (Fig. 2).
Results and discussion:
Constant crustal thickness setup. Using the simpler model setup (constant crustal thickness) we are able to exclude end-member KREEP distribution scenarios (Fig. 1). The scenarios of global KREEP layer and complete KREEP overturn/remixing (topmost sketch and blue tiles in Fig. 1, respectively) cannot produce heat flux values as high as Apollo 15, assuming Earth-like HPE abundances [8]. For a regional KREEP layer (~1300 km radius), we find that at least 60% of KREEP material is required to be remixed in the mantle to match Apollo 15 and 17 heat flux. Conversely, a hemispherical KREEP layer requires <60% of KREEP to be mixed in the mantle, in order to reach heat fluxes as high as Apollo 15 (Fig. 1).
Therefore, our results suggest that some degree of HPE sequestering on the nearside is likely, but it may not have been an efficient process. Up to 60-80% of KREEP material from magma ocean crystallization could have remained well-mixed in the mantle after overturn.
Variable crustal thickness setup. Using the more complex model setup, we find that surface heat flux at all locations increases with increasing bulk HPE (Fig. 2a). Increasing the KREEP HPE concentration increases the surface heat flux within the KREEP region and decreases it elsewhere (Fig. 2b), with the global surface average remaining constant.
If the remote-sensing estimate of a measurably lower heat flux in the south polar region is considered accurate [6], then our models with variable crust and KREEP thickness show that only a large, low-HPE-enriched KREEP beneath the Apollo 15 & 17 landing sites is able to reproduce the observation (~1600 km radius, 30 ppm Th concentration and 16-20 ppm bulk U). However, if the south polar estimate is considered inaccurate, we find consistent scenarios also for a hemispherical or medium KREEP (~1200 km radius), with south polar heat flux being comparable to the surface average (12-14 mW/m2).
The upcoming measurement by the LISTER instrument onboard Blue Ghost lander [9] will provide a heat flux value located sufficiently far from Oceanus Procellarum. Including this value in our model will allow us to put strong constraints on KREEP size and enrichment, along with bulk U concentration.
Outlook:
In future steps we will compute seismic velocities associated with our modeled temperatures. Similar to [10], we will combine our 3D thermal evolution models with ray tracing calculations using the TTBOX software package [11]. This will allow us to compare our results with the Apollo seismic measurements [12]. As a validation step, we will additionally test the feedback effect between the 3D temperature field predicted in our global models and crustal thickness inversions. In particular, we will input the temperature-induced density variations produced by our models in the crustal thickness inversion models in [7], and iteratively update our models to ensure that the crustal thickness estimates do not diverge due to the effect of temperature anomalies.
References: [1] Broquet and Andrews-Hanna (2024). [2] Laneuville et al. (2013). [3] Moriarty et al. (2021). [4] Hüttig et al. (2013). [5] Plesa et al. (2016). [6] Wei et al. (2023). [7] Broquet and Andrews-Hanna (2023). [8] Taylor and Wieczorek (2014). [9] Nagihara et al. (2023). [10] Plesa et al. (2021). [11] Knapmeyer (2004). [12] Nunn et al. (2020).
How to cite: Santangelo, S., Plesa, A.-C., Broquet, A., Breuer, D., and Grott, M.: Unveiling the subsurface extent of the lunar KREEP unit from geodynamic modeling., EPSC-DPS Joint Meeting 2025, Helsinki, Finland, 7–13 Sep 2025, EPSC-DPS2025-1728, https://doi.org/10.5194/epsc-dps2025-1728, 2025.
The DIMPLE (Dating an Irregular Mare Patch with a Lunar Explorer) payload, selected under NASA’s PRISM program, will determine the age and chemical composition of rocks at Ina on the Moon. This objective will be achieved through in situ Rb–Sr isochron analysis performed by the Chemistry, Organics, and Dating EXperiment (CODEX) aboard a Commercial Lunar Payload Services (CLPS) lander. A critical subsystem of CODEX is a compact time-of-flight mass spectrometer designed for high mass resolution, high sensitivity, and long-term stability under lunar conditions. Its dual-mode concept maximizes science return, as (i) a 266 nm UV ablation laser provides spatially resolved bulk element geochemistry, and (ii) after the ablation plume expands, additional lasers resonantly ionize Rb and Sr in sequence, enabling precise isotope ratio measurements for geochronology. We present the status of the engineering development unit (EDU) and the roadmap to a flight-qualified instrument. The EDU incorporates a flight-like ion-optical subsystem that has been numerically modeled, built, and functionally tested. Initial tests confirm that the mass spectrometer meets the required mass resolution and sensitivity for both geochemical analysis and isotope dating. Ongoing EDU raster experiments demonstrate high accuracy and operational stability over repeated runs. When combined with proven sample-handling and imaging subsystems, this performance positions DIMPLE to deliver the first radiometric age for an irregular mare patch. By distinguishing between a young (~30 Ma) and an ancient (>3 Ga) origin for Ina, DIMPLE could refine lunar crater-count chronologies and constrain how long internal heat sources can sustain late-stage volcanism. The demonstrated analytical capability of CODEX establishes a foundation for precise planetary geochronology within the stringent mass, volume, and power constraints characteristic of small lunar payloads.
How to cite: Fausch, R., Aebi, A., Anderson, F. S., Bierhaus, E. B., Braden, S. E., Fagan, A. L., Head, J. W., Joy, K. H., Levine, J., Osterman, S., Pernet-Fisher, J. F., Tartèse, R., Wurz, P., and Yant, M.: Advancing Lunar Volcanism Studies: Status of the CODEX/DIMPLE Mass Spectrometer for Geochemical and Geochronological Measurements, EPSC-DPS Joint Meeting 2025, Helsinki, Finland, 7–13 Sep 2025, EPSC-DPS2025-1007, https://doi.org/10.5194/epsc-dps2025-1007, 2025.
Motivation: The prevailing explanation for the dramatic asymmetry in lunar volcanism is that the Procellarum KREEP Terrane (PKT) represents a unique lunar province hosting a shallow reservoir of heat-producing elements. But is the story more complex? Isolated from other mare deposits within the Nectarian-aged Crisium Basin (Figure 1a), the 550 km-wide Mare Crisium and surrounding mare units offer a critical non-PKT reference point for exploring just how unique PKT volcanism really was (Figure 1).
The Crisium region hosts a surprisingly diverse range of volcanic structures and deposits. In addition to flood basalts, the region contains volcanic cones, such as Mons Latreille [1], domes [2], and as we will present, potential pyroclastic deposits and well-preserved flow features not reported elsewhere on the Moon (Figure 1). This complex assemblage of volcanic features suggests that a range of eruptive styles—from effusive to explosive—occurred throughout the basin’s history. This region was also the landing site of the recent Firefly Aerospace Blue Ghost Mission 1.
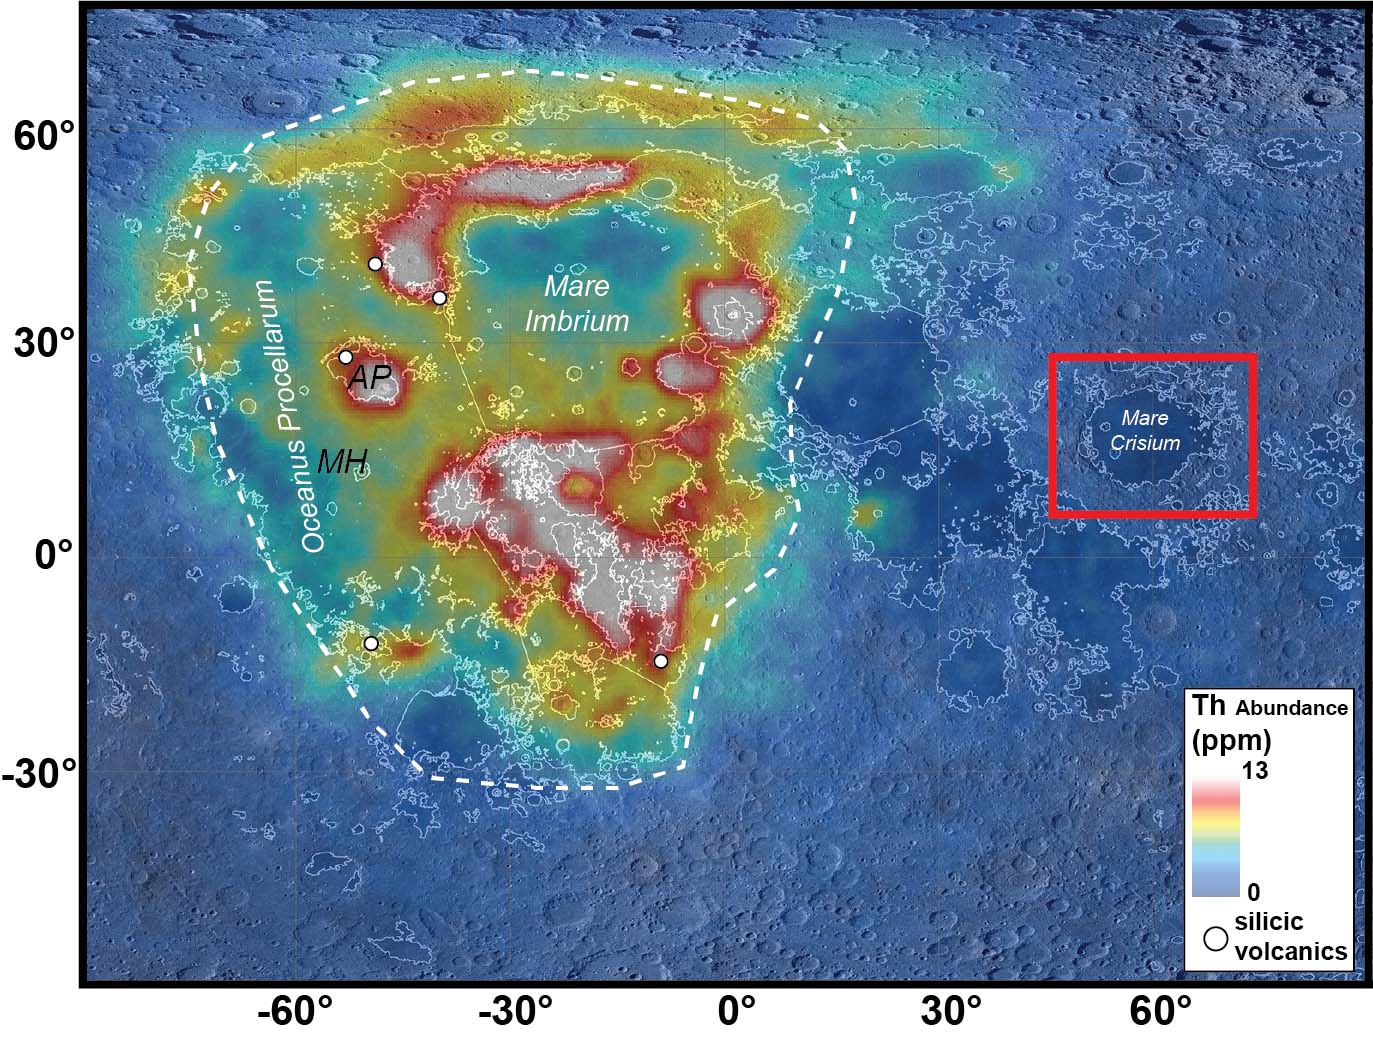
Figure 1. Th abundance from Lunar Prospector (Lawrence et al., 2007) showing concentrated values within the PKT (white dashed region). The major volcanic regions within the PKT are highlighted (AP = Aristarchus plateau, MH = Marius Hills) as is the Crisium region.
Investigations: Leveraging the diverse array of available orbital data sets, we will present the results of an integrated approach to analyzing the Crisium Region. A major focus of our cross-dataset analysis is the use of multi-wavelength radar data (4.2 – 70 cm) from the Mini-RF instrument on Lunar Reconnaissance Orbiter [5] and Earth-based radar observations [e.g. 6]. Radar analysis enables both the surface and the underlying regolith to be interrogated, revealing surface/subsurface boulder distributions, near-surface structure, and TiO2 content of lunar basalts. Due to the range of TiO2 content within Mare Crisium and–as we will present–the occurrence of pyroclastic deposits (which exhibit unique signatures in radar data), radar is particularly useful in delineating eruption events and styles. Radar data has also proven critical in assessing engineering concerns regarding landing site selection.
Additionally, we are in the second year of a four-year Lunar Data Analysis Program project to produce a 1:1,000,000 scale map of the Crisium basin region. The study area is defined by 46°E to 73°E and 6°N to 28°N and incorporates Mare Crisium, the major Crisium basin structure and surrounding small mare units including Mare Undarum and Mare Anguis.
Results and interpretation: Our new analysis has enabled a radar-based compositional delineation of Mare Crisium and provided a fresh perspective on the eruptional history of the basin’s eastern portion.
Mare Units: Earth-based 70 cm radar mapping reveals broad variations in backscatter that suggest at least five distinct mare units (Figure 2). These units show some alignment with the most recent mapping effort [1], particularly in the east, but the radar data also highlight potential unit boundaries that were previously mapped as broad ejecta using UV-NIR datasets.
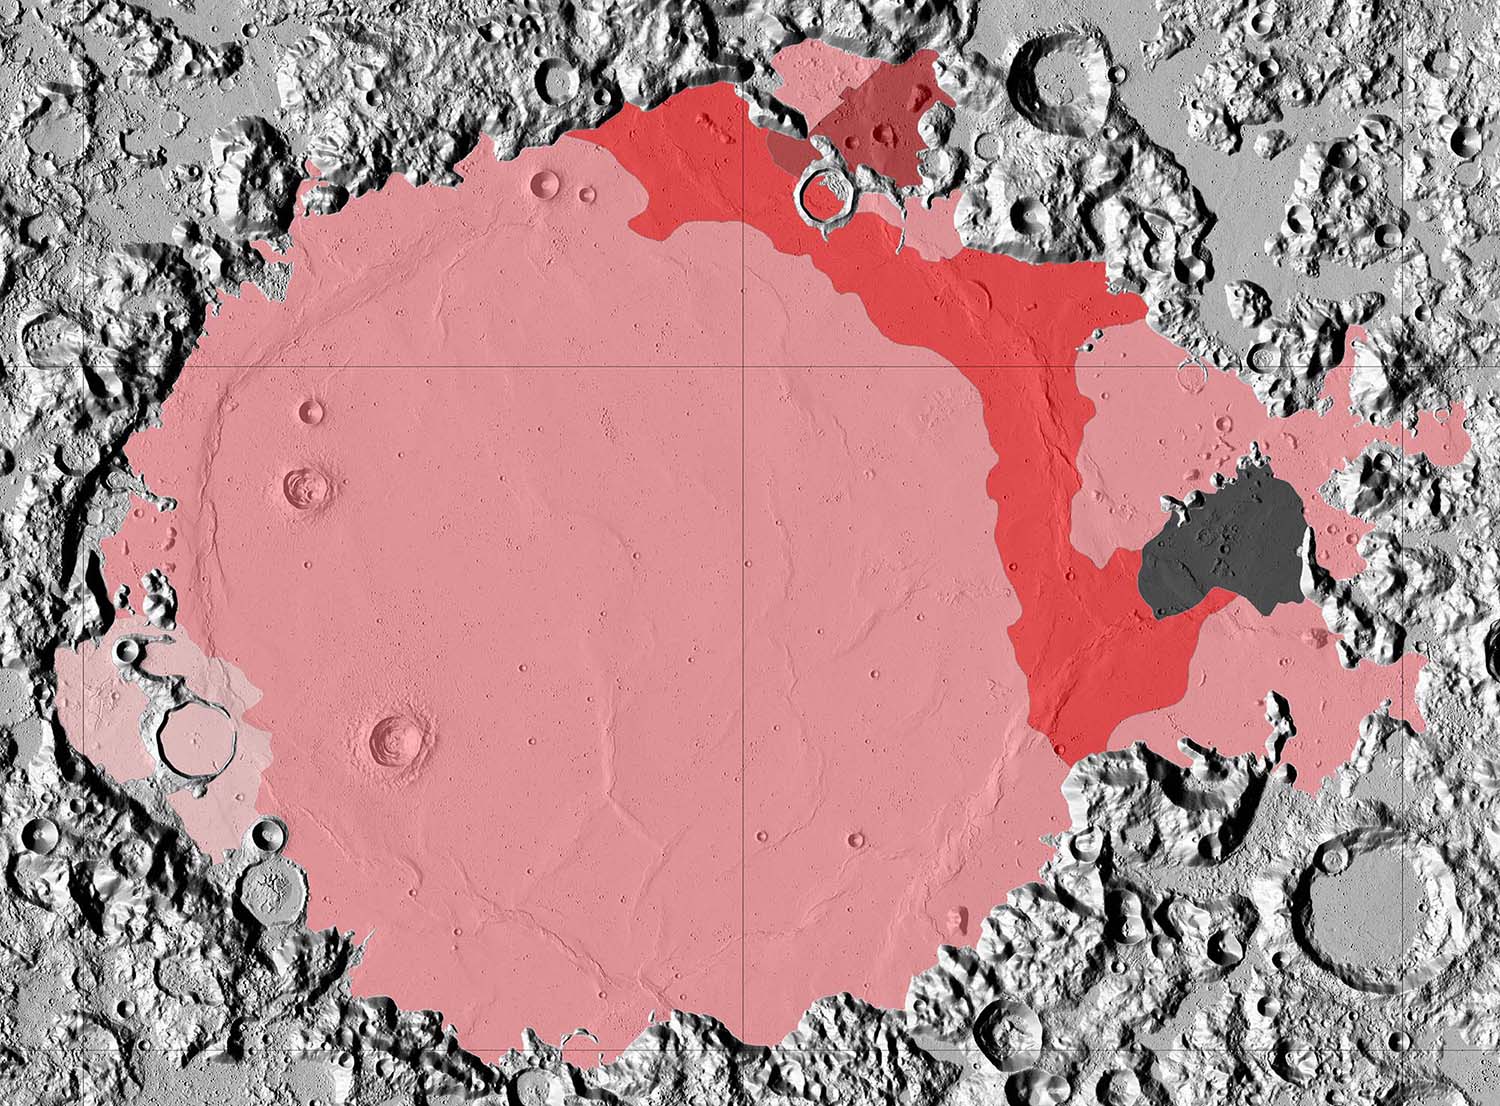
Figure 2. 70 cm radar based map of mare units within Mare Crisium.
Explosive Eruptions: All radar wavelengths reveal a reduced backscatter response associated with volcanic cones (Figure 3). The absence of centimeter-scale scatterers suggests the presence of previously unrecognized small-scale pyroclastic deposits. If this interpretation is correct, it implies that these cones differ from terrestrial cinder cones (which would generate a significantly brighter backscatter response), pointing to an explosive component in the eruptions that formed them.
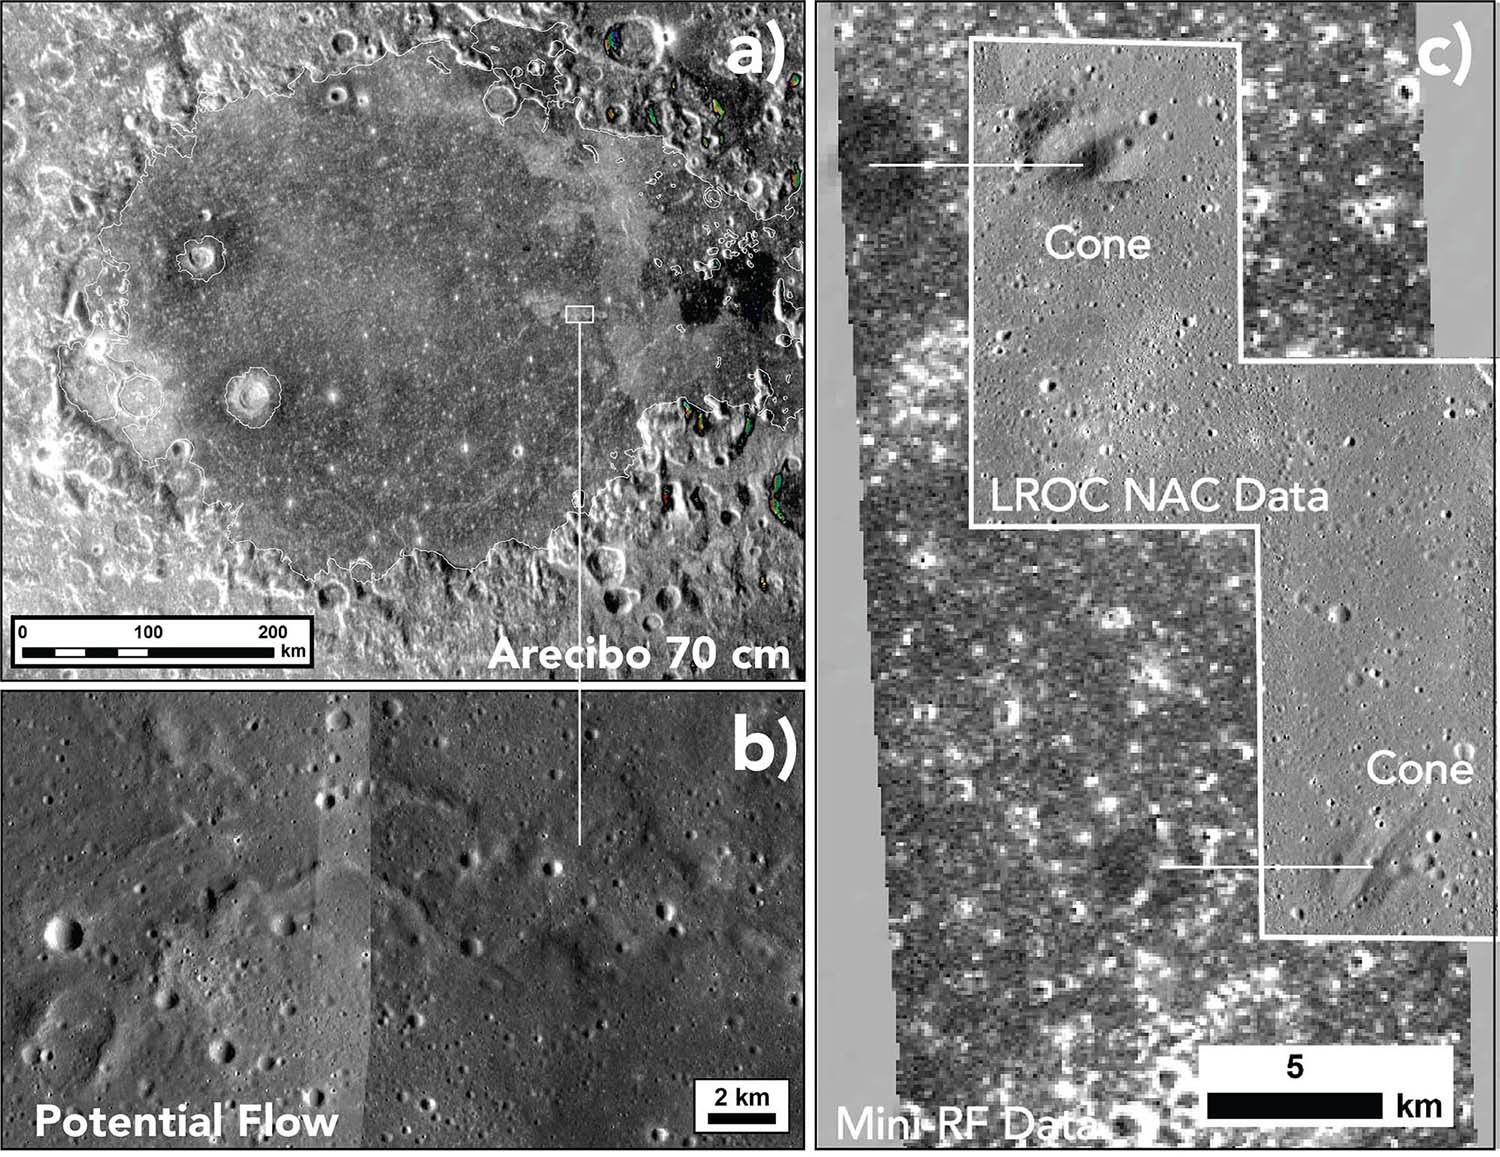
Figure 3. Radar coverage of volcanic structures within Mare Crisium. (a) Earth-based 70 cm coverage. Note that distinct differences in backscatter delineate individual units within the mare. (b) LROC NAC images of unusual radar bright flow feature. (c) Mini-RF 4.2 cm coverage of cones (see LROC NAC image for context). Note the cones exhibit a very low backscatter response consistent with pyroclastic materials.
Individual Flow Units: In contrast to Earth, Venus, and Mars, most individual mare flow morphologies are subdued—due in part to the low eruptive magma viscosity and the associated thin nature of lunar lava—and are thus masked by the impact-generated regolith. A few exceptions exist, such as the extensive, young flows in central Mare Imbrium, situated within the PKT. There, 70 cm radar-bright features elongated perpendicular to the broad local slope (east-west) are clearly identifiable (Figure 3). Inspection of the corresponding LROC NAC images reveals these features to have rough textures that broadly resemble platy terrestrial or Martian lava flows and appear to be sourced from cone-like structures (Figure 4).
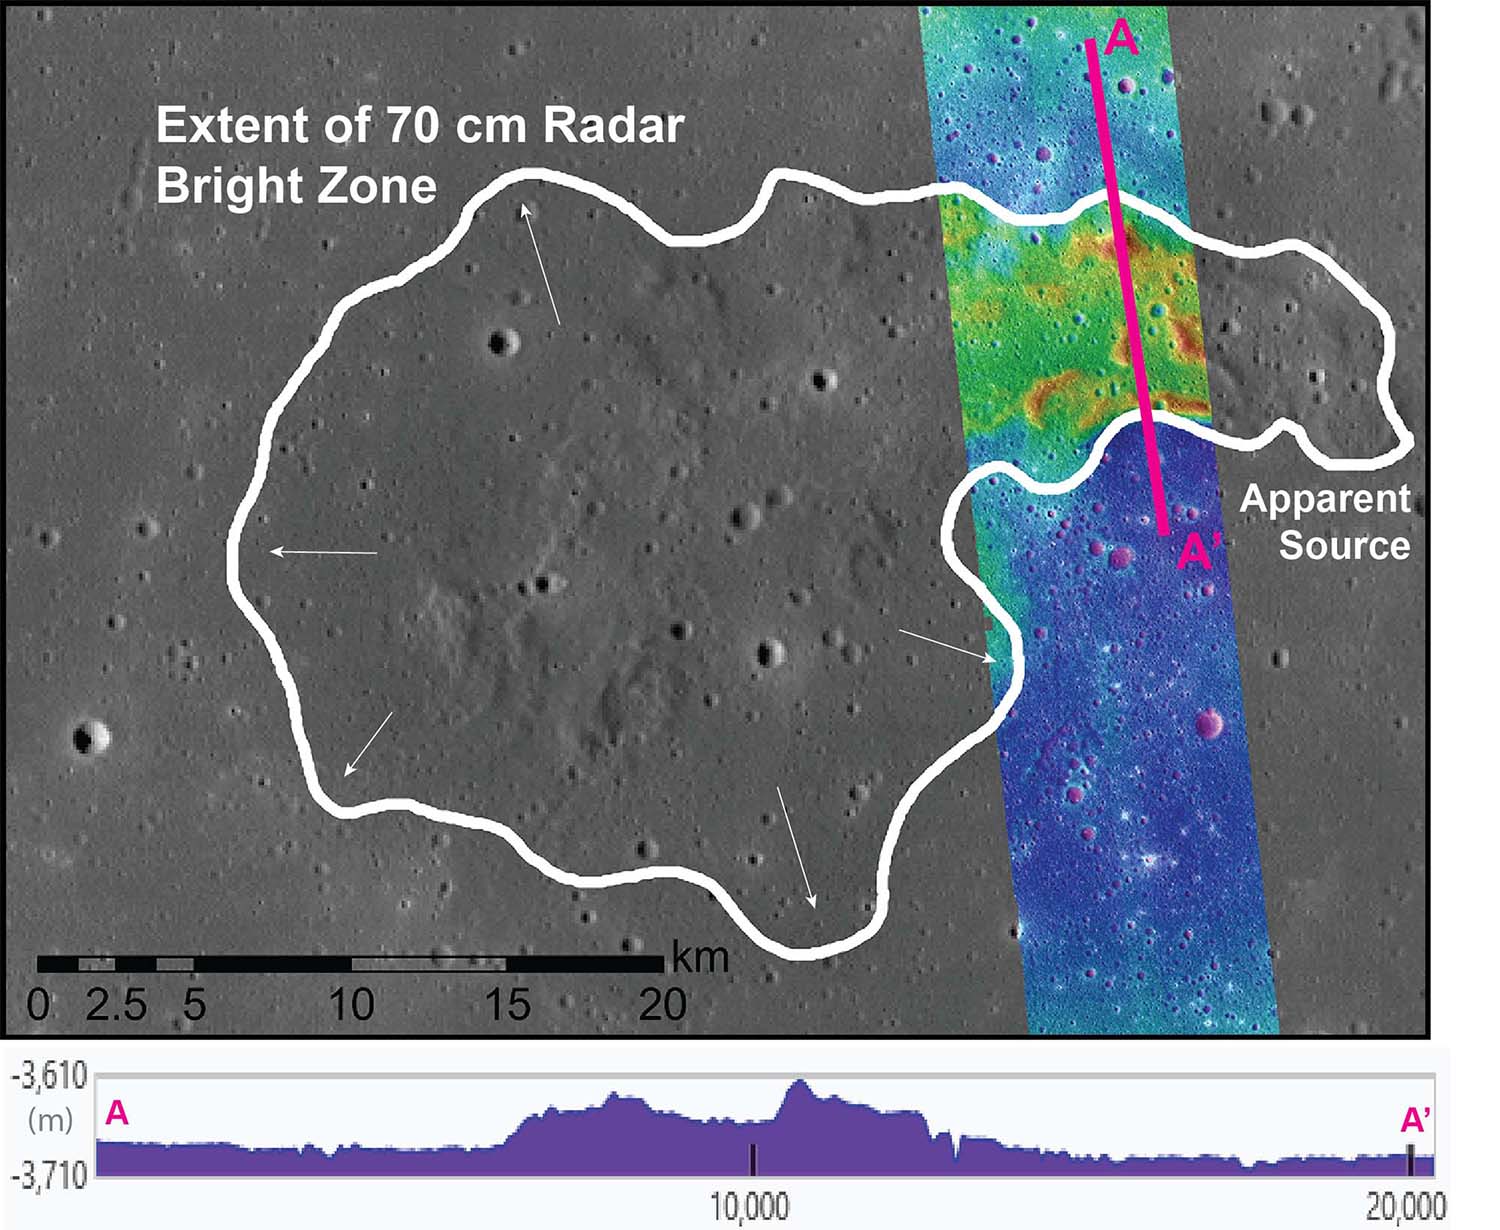
Figure 4. LROC WAC image of the northernmost potential flow feature. Note to the west, the radar signature extends beyond the topographic signature of the flow. The arrows highlight the direction and location of potential breakouts. Topo profile from LROC NAC stereo DTM.
Further comparison of image, topographic, and radar data indicates that these potential flows are ~30 m thick with higher-standing levees. The rugged nature of the flows suggests deflation, while the edges display smooth, radar-bright lobes that may represent breakouts. The elevated 70 cm backscatter could reflect a localized increase in blocky material on the surface and suspended within the regolith. We interpret these features as individual lava flows that have not been as fully degraded by impact gardening as typical mare flows. Their distinct morphology relative to the Imbrium flows suggests a different rheology, indicating that different eruption conditions have occurred across the mare.
References: [1] Lu et al., 2021, Remote Sens. 13(23), 4828. [2] Lina et al., 2008, Planetary and Space Science, 56, 3–4, 553-569 [3] Spudis, and Sliz., 2017, J. Geophys. Res. Lett., 44, 1260–1265, doi:10.1002/2016GL071429. [4] Runyon et al., 2020, J. Geophys. Res. 125, e2019JE006024. https://doi.org/10.1029/2019JE006024 [5] Patterson et al., 2017, Icarus, 283, [6] Campbell et al., 2007, IEEE Trans. Geosci. Remote Sensing, 45, 12, DOI: 10.1109/TGRS.2007.906582.
How to cite: Morgan, G., Weitz, C., Berman, D., Jawin, E., Russell, M., Campbell, B., Stopar, J., Patterson, G., and Stickle, A.: Unveiling Lunar Volcanic Complexity Beyond the Procellarum Kreep Terrane, EPSC-DPS Joint Meeting 2025, Helsinki, Finland, 7–13 Sep 2025, EPSC-DPS2025-1058, https://doi.org/10.5194/epsc-dps2025-1058, 2025.
Introduction: The Gruithuisen domes (36°N, 40°W) were first identified as volcanic structures distinct from their surrounding mare flows based on their morphology and unusually red-sloped UV-visible spectrum [e.g., 1–3]. Morphologic analyses of the steep-sided domes suggested they are composed of highly viscous magmas similar to terrestrial extrusive volcanic features, which are consistent with higher silica contents (> 52 wt.% SiO2) found in rhyolites, dacites and basaltic andesites [e.g., 4]. Further observations by Lunar Prospector (LP), Diviner Lunar Radiometer (Diviner), and the Lunar Reconnaissance Orbiter Camera (LROC) have shown that the domes are enriched in Th (~17 to 40 ppm) and SiO2, and low in FeO [e.g., 5–7]. However, the exact composition of the rock making up the domes has remained elusive. In particular, Diviner’s compositional bands were not optimized for constraining the composition of highly silicic materials [6,8], making it challenging to constrain how such rocks could form on a single plate planetary body like the Moon.
Mission Objectives: The Lunar Vulkan Imaging and Spectroscopy Explorer (Lunar-VISE) instrument suite was selected through NASA’s Payloads and Research Investigations on the Surface of the Moon (PRISM) program and will be deployed on the Moon by Firefly Aerospace, which was selected through NASA’s Commercial Lunar Payload Services (CLPS) program for task order CP-21. Lunar-VISE will land on Mons Gruithuisen Gamma (hereafter referred to informally as “the Gamma dome”) and will use its combined lander and rover payload to determine the composition and physical properties of the rocks and regolith comprising the domes, placing critical constraints on their formation mechanism.
The overarching science goal of our investigation is to understand how late-stage lunar silicic volcanism works under lunar conditions, as typified by the Gruithuisen domes. This goal will be accomplished through two science objectives that place critical constraints on the two main hypotheses for the formation of non-mare silicic volcanic constructs by (1) mapping spatial variations in composition along multiple traverses across the landing site, and correlating the measured variations to rock and regolith properties, surface features, and dome morphology. Lunar-VISE will also (2) relate those local-scale measurements to orbital remote sensing observations from previous and current spacecraft. Our primary exploration goal is to understand the geotechnical properties of the lunar regolith on the domes at the lander/rover scale. This exploration goal will be accomplished by mapping local variations in regolith properties of the region surrounding the landing site and along the rover’s traverse.
Lunar-VISE Instrument Suite: To achieve our goals and objectives, Lunar-VISE includes a complementary suite of heritage instruments on a rover and lander. The rover payload includes two separate units, the Lunar-VISE Visible/Infrared Multiband Suite (LV-VIMS) and the Gamma-Ray and Neutron Spectrometer (LV-GRNS). The lander suite includes two additional cameras for characterizing the landing site, surrounding area, and rover traverse: the Lunar-VISE Descent Camera (LV-DC) for surface imaging during landing, and the Lunar-VISE Context Camera (LV-CC) for panoramas up to 270° around the landing site and the rover traverse. Both cameras are copies of the LV-VIC but without the multispectral capabilities.
Current Mission Status: The Lunar-VISE team passed NASA CDR in January/February 2024 and KDP in March 2024. Instrument building, integration, and environmental testing of the Lunar-VISE payload instruments is currently underway. Delivery in place is on schedule and currently planned for fall 2025. With the recent selection of Firefly Aerospace as the CLPS provider for CP-21, the Lunar-VISE team will begin working with Firefly and Honeybee Robotics to integrate the payload instruments onto the lander and rover and further develop surface operation plans.
Acknowledgments: Lunar-VISE is funded through NASA’s PRISM2 cooperative agreement number 80NSSC22M0303. Thanks to our Mission Manager C. Benson, Program Scientist R. Watkins, Project Scientist M. Banks, CLPS Integration Manager J. Schonfeld, and NASA HQ and PMPO teams.
References: [1] Head J. W. and McCord T. B. (1978) Science, 199, 1433-1436. [2] Bruno B. C. et al. (1991) LPSC XXI, 405-415. [3] Chevrel S. D. et al. (1999) JGR, 104, 16515-16529. [4] Wilson L. and Head J. W. (2003) JGR Planets, 108(E2), 5012. [5] Hagerty J. J. et al. (2006) JGR, 111, doi:10.1029/2005JE002592. [6] Glotch T. D. et al. (2010) Science, 329, 1510-1513. [7] Clegg-Watkins R. N. (2017) Icarus, 285, 169-184. [8] Greenhagen B. T. et al. (2010) Science, 329, 1507-1509.
How to cite: Donaldson Hanna, K., Bennett, K., Byron, B., Denevi, B., Dove, A., Hagerty, J., Hardgrove, C., Hayne, P., Heffern, L., Landis, M., Rudd, V., Schindhelm, R., Shirley, K., Siegler, M., Sunshine, J., Prettyman, T., Tripathi, P., Williams, J. P., and Valencia, S.: The Lunar-VISE Investigation of Mons Gruithuisen Gamma, EPSC-DPS Joint Meeting 2025, Helsinki, Finland, 7–13 Sep 2025, EPSC-DPS2025-1099, https://doi.org/10.5194/epsc-dps2025-1099, 2025.
Under the acronym PALMALAB, the University of the Basque Country is conducting several analysis campaigns on the island of La Palma, Canary Islands, Spain. The Canary Islands archipelago, located off the northwest coast of Africa, is of entirely volcanic origin and represents one of the most prominent examples of oceanic intraplate volcanism. Formed over a presumed mantle hotspot, the islands are aligned roughly east to west and exhibit a progression in age, with the eastern islands (e.g., Fuerteventura and Lanzarote) being older than the western ones (e.g., La Palma and El Hierro). This age progression, combined with the geochemical and petrological signatures of the volcanic products, supports the hypothesis of a stationary hotspot beneath the moving African Plate. Volcanism in the archipelago began approximately 20 million years ago, and it continues today, as evidenced by historical eruptions such as those in La Palma (2021) and El Hierro (2011). La Palma stands out as a geologically significant site due to its ongoing volcanic activity, well-preserved lava tubes, and diverse range of volcanic terrains, making it not only a key natural laboratory for studying terrestrial volcanism but also a high-fidelity analogue for planetary surfaces such as those of Mars and the Moon.
From a volcanic perspective, La Palma features a highly active rift zone (Cumbre Vieja) and a variety of volcanic landforms—shield volcanoes, scoria cones, fissure vents, and extensive lava fields—that reflect both effusive and mildly explosive basaltic eruptions. These processes are analogous to those observed or inferred on the Moon and Mars, where basaltic volcanism has shaped large portions of their surfaces. Notably, the morphology and internal architecture of La Palma’s lava tubes closely resemble lava tubes identified in orbital imagery of the lunar maria and Martian volcanic provinces, such as in regions like Mare Tranquillitatis or Arsia Mons. Moreover, the mineralogical composition of La Palma's basalts shares key similarities with planetary basalts, namely low silica content and the presence of olivine, pyroxene, and plagioclase. These characteristics make the island particularly valuable for testing in-situ analytical instruments like Raman spectroscopy and X-ray fluorescence (XRF), technologies already integrated into Mars rovers (e.g., Perseverance and Curiosity) and proposed for future lunar and martian missions, i.e. ExoMars. Studying La Palma's volcanic features in-situ allows simulating planetary surface exploration, refining remote sensing techniques, and calibrating analytical tools in a terrestrial environment that mimics the physical and chemical conditions expected on Mars and the Moon.
In February 2025, the first analytical campaign was carried out using portable Raman spectroscopy and XRF systems. Several lava tubes of different formation ages were analysed. From the oldest ones of the island to a lava tube from the Tajogaite volcano (2021) were studied in order to evaluate their potential as planetary analogues. The objective of studying systems of different ages was to evaluate the differences in geochemistry due to the time of exposure of the volcanic material to the Earth's atmosphere.
For the mentioned aim, two portable InnoRam (BWTEKINC, USA) Raman systems were employed for testing different excitation laser wavelengths. In this sense, 532 and 785 nm lasers were used for the analysis of the lava tubes. In addition, a handheld XRF Tracer 5 spectrometer (Bruker, EEUU) equipped with an Rh tube as the X-ray source was used.
Both techniques demonstrated perfect performance in determining the elemental and molecular composition of lava tubes. XRF did not present any inconvenience from the analysis point of view. The major elements found in all tubes regardless of age were Si, Fe, Ca, Al and, to a lesser extent, Mg. Si, Fe and Mg did not show significant differences in their relative presence from cave to cave. In contrast, Al varied by cave, with a higher relative presence of this element in older caves. The presence of Ca varied significantly depending on the salt crust precipitation processes present in each tube. It should be noted that in the tube analyzed from the last eruption, the determined presence of Ca was lower. In general, calcium presented a significant correlation with sulfur, and to a lesser extent with P, in the tubes that presented greater precipitation of salt crusts. However, in certain caves where precipitation processes were not detected, S was not determined, being below the LOD of the technique. Thus, S is related to fumarolic processes that give rise to the precipitation of sulfate-rich salts.
The main elemental differences were observed in the minority elements. It is worth mentioning K, an element detected as a minority in the oldest caves and, on the other hand, as a majority in the most recent caves, showing a behaviour totally contrary to that of Al. Other elements that showed cave-related variability were Br, Sr, Ni, Zn and Mn.
Regarding Raman spectroscopy, considering the fluorescence and vitreous character of the samples, more difficulties were encountered in obtaining good signals from the igneous rock matrix. Some iron oxides and carbonates were detected unequivocally.
However, this technique was very useful to characterize the salt crusts and crystalline structures formed on the walls of the lava tunnels. Using low integration times, the SNR obtained was sufficient to discern between different polymorphs and accurately determine the heterogeneous composition of these structures.
This spectroscopic analysis campaign demonstrates the ability of Raman and XRF to determine the geochemistry of lava tunnels. This fact is of great relevance considering the potential of these structures for future Martian and lunar exploration missions.
Acknowledgements
This work has been supported through the PAMMAT project “Alteration processes in Mars and Moon Meteorites, and Terrestrial Analogues at different environments: Mars2020, Rosalind Franklin and Returned Samples from Mars and Moon” (Grant No. PID2022-142750OB-I00), funded by the Spanish Agency for Research (MICIU/AEI/10.13039/501100011033/FEDER/UE).
How to cite: Aramendia, J., Alberquilla, F., Coloma, L., Martinez-Arkarazo, I., Arana, G., Gonzalez, A., Diaz, E., Gisbert, R., Diez-Cobiella, P., Perestelo, M., and Madariaga, J. M.: Exploring the geochemical secrets of the lava tubes in La Palma: in-situ Raman and XRF spectroscopy for the study of these volcanic structures, EPSC-DPS Joint Meeting 2025, Helsinki, Finland, 7–13 Sep 2025, EPSC-DPS2025-1466, https://doi.org/10.5194/epsc-dps2025-1466, 2025.
Introduction
The Tharsis region on Mars represents one of the most prominent volcanic and tectonic provinces in the Solar System, shaped over the past four billion years through sustained magmatic and tectonic activity [1]. The prevailing hypothesis attributes the formation of Tharsis to a long-lived mantle plume beneath a relatively thin lithosphere [2,3]. Alternative models propose a superplume origin [4] or invoke a combination of isostatic uplift, lithospheric flexure, volcanic loading, and intrusive thickening [5,6]. Simulations have been employed to test these hypotheses and explore variations in crustal thickness and mantle flow [7,8], while geological and structural observations support the presence of plume-induced stress centers that have governed the development of step-like topographic decreases from the center outward and the formation of compressional landforms [9,10].
A key manifestation of this tectonic evolution is the widespread system of compressional landforms called “wrinkle ridges”, which encircle the Tharsis rise and extend into the Northern Plains. These landforms, typically several hundred meters in height and tens of kilometers in width, are best preserved around Syria, Thaumasia, and Lunae Planum [11]. Their morphology, spacing, and radial distribution suggest a genetic link to underlying detachment and a link with Tharsis uplift. Their formation remains debated due to limited subsurface data, with hypotheses ranging from fault-propagation folding to blind thrusting over detachments [12–13]. In several regions, wrinkle ridges display regular spacing that decreases with distance from the Tharsis center, particularly between Sinai Planum and Solis Dorsa [14].
This study investigates (i) the mechanical connection between circumferential compressional features and large-scale detachment and (ii) the influence of detachment rheology—frictional versus viscous—on stress transfer within wedge-shaped topography. These questions are addressed using two-dimensional thermomechanical models driven by gravitational forces arising from isostatic and volcanic loading, in the absence of external tectonic boundary conditions.
Methodology
Primary datasets were sourced from NASA’s Planetary Data System (PDS) and the Mars Global GIS repository. Topographic profiles were extracted from the MOLA-HRSC blended digital elevation model at 200 m/pixel resolution [15]. THEMIS daytime infrared mosaics (~100 m/pixel) [16] were used as the base for identifying circumferential wrinkle ridges [17]. We applied the Swath Profiler Toolbox [18] to derive average topographic cross-sections within 1,500 km-wide swaths focused on well-preserved wrinkle ridges. Features overprinted by Amazonian-era resurfacing were excluded from analysis.
Numerical simulations were performed using a finite-difference thermo-mechanical code [19,20] based on a marker-in-cell approach, which couples a fixed Eulerian grid with freely advected Lagrangian markers. Governing equations for conservation of mass, momentum, and energy were solved on a static grid, while the fourth-order Runge-Kutta method was used to update marker positions. Our domain consisted of an 8 km-thick sticky-air layer above a 7 km-thick upper crustal unit characterized by a quartzite rheology. Below this, a 2 km-thick mechanically weak detachment layer was introduced, implemented either as low-frictional (fluid-overpressured shale) or low-viscosity (salt). The base of the crust comprised an 8 km-thick megaregolithic layer modeled using dry olivine flow laws. Detachment depths were validated by the shallow seismic profiles of the InSight mission [20]. We conducted 60 exploratory runs to probe the parameter space and selected 10 representative models for detailed analysis. For the frictional case, mobile shale detachment zones were simulated under fluid overpressure ratios from 0.7 to 0.99. In viscous cases, the salt layer viscosity was varied from 10¹⁷ to 10¹⁹ Pa·s.
Results and Conclusion
Our numerical modeling reveals distinct behaviors for low-frictional versus viscous detachments. Specifically, for the wedge structure, notably low alpha and beta angles imply that the mechanically homogeneous wedge requires an exceptionally low friction coefficient to match the gravity-driven geometry. This supports the presence of a low-friction detachment, potentially shale, possibly activated by fluid overpressure. Simulations with an initial overpressure of 0.7 show no deformation, with localization beginning only beyond a threshold of 0.85. Between 0.85 and 0.99, proximal normal faulting is followed by deformation in a transmission zone and the formation of a distal thrust front. In contrast, viscous detachment models—representing salt with a viscosity of ~10⁷ Pa·s—produce diapiric upwellings, with normal faults shifting from radial to offset configurations, indicating unstable wedge deformation. When viscosity increases to 10⁸ Pa·s, the detachment transmits stress from the Tharsis uplift without localized diapirism, aligning best with observed topography.
Here, we propose that the presence of such low-friction detachment is likely linked to alteration of pyroclastic materials, and a viscous detachment, particularly around Tharsis, and in the Valles Marineris region, may be attributed to previously suggested [22] chlorite-based hydrothermal alteration processes. This mechanism could plausibly reduce both the frictional strength and viscosity of the detachment zone, thereby facilitating the observed tectonic features.
References
[1] Carr & Head (2010) EPSL, 294, 185–203. [2] Dohm et al. (2001) JGR, 106, 32943–32958.
[3] Breuer et al. (1996) JGR, 101, 7531–7542. [4] Baker et al. (2007) Superplumes, 507–522.
[5] Banerdt et al. (1982) JGR, 87, 9723. [6] Thurber & Toksöz (1978) GRL, 5, 977–980.
[7] Breuer et al. (1998) GRL, 25, 229–232. [8] Harder & Christensen (1996) Nature, 380, 507–509. [9] Anderson et al. (2001) JGR, 106, 20563–20585. [10] Mège & Masson (1996b) PSS, 44, 1471–1497. [11] Watters (1988) JGR, 93, 10236–10254. [12] Schultz, R. A. (2000) JGR: Planets, 105(E5), 12035–12052. [13] Karagoz et al. (2022) EPSL, 595, 117759. [14] Montési, L. G., & Zuber, M. T. (2003) JGR: Planets, 108(E6), 5048. [15] Fergason et al. (2018) USGS.
[16] Edwards et al. (2011) JGR, 116, E10008. [17] Knapmeyer et al. (2006) JGR, 111, E11008.
[18] Pérez-Peña, J. V. et al. (2017) Comput. Geosci., 104, 135–150. [19] Gerya (2019) Introduction to Numerical Geodynamic Modeling. [20] Ruh et al. (2020) Front. Earth Sci., 8, 605239. [21] Ehlmann, B. L. et al. (2011) Nature, 479(7371), 53–60. [22] Osterloo, M. M. et al. (2008) Science, 319(5870), 1651–1654.
How to cite: Karagoz, O., Ruh, J. B., and Kenkmann, T.: The low-friction and viscous detachments drive deformation on Mars , EPSC-DPS Joint Meeting 2025, Helsinki, Finland, 7–13 Sep 2025, EPSC-DPS2025-1680, https://doi.org/10.5194/epsc-dps2025-1680, 2025.
Introduction: Channels of alluvial, fluvial, glacial, and volcanic origin (Figure 1) are observed on Mars and may be distinguished as volcanic channels formed via lava eruption by sharp, parallel channel boundaries, source vents, associated effusive deposits, consistent or decreasing width along their lengths, and channel shallowing along length. Some lava channels have been interpreted to have formed by either thermal, mechanical, or thermomechanical (both) erosion into the substrate. These enigmatic channels are observed on Mercury, Venus, the Moon, and Mars, with the most notable variant being sinuous rilles [1-5]. Unlike channelized lava flows which represent a particular lava flow regime and result in constructive landforms, the channels investigated in this study have been interpreted as primarily erosive features [2-4; 6-7]. The primary objectives of this work were to: [1] establish a geospatial dataset of volcanic channels on Mars interpreted to have formed via lava effusion; [2] classify observed channels based on morphology; [3] quantify the morphology of channels; and [4] understand spatial and temporal distribution of channels across Mars. The data presented here represents an overarching effort to characterize a global dataset.
Methods: An initial global survey of the entire surface of Mars was conducted in order to identify volcanic channels formed via the eruption of lava and build a geospatial dataset of effusive volcanic channels. We utilized the Java Mission-planning and Analysis for Remote Sensing (JMARS) GIS to access planetary datasets and perform data analysis. To identify channels, we utilized THEMIS (100 m/px), CTX (~5 m/px), and HiRISE (~0.5 m/px). For topographic analyses, we utilized the MOLA 128 ppd DEM (200 m/px) and HRSC DEMs where available (~50-70 m/px). We developed a confidence ranking to assess which channels were likely created by effusive volcanism. We rated channels from 1 = very low confidence in a volcanic origin to 5 = very high confidence in volcanic origin. Confidence in a volcanic origin was determined by identification of a likely volcanic source, presence of erupted deposits, morphological comparison to other similar volcanic features, including those on Venus, the Moon, and Earth, and geological context. Only channels ranked 4 (likely) or 5 (very likely) were considered for further study.
To quantify channel morphology, we measured and calculated the following channel dimensions: length of main channel, width, depth (where available), mean slope, and sinuosity. Length was measured by drawing a profile along the channel centerline (thalweg) from its source - or where first observed - to its terminus. To calculate mean width and depth, we drew equally spaced transects (every ~0.5 – 2 km) perpendicular to channel length, measuring the distance between channel walls and the vertical distance between the top of the channel wall and the bottom of the channel floor. The channel slope was calculated by dividing the total relief by channel length, and then taking the arctan of the quotient. To calculate sinuosity, we divided the channel length by the meander belt length [3]. We also measured the distance from the volcano summit by measuring the distance from the edge of the summit caldera to the ‘source’ or ‘head’ of the channel. All of the volcanoes in the study had a summit caldera. Surface ages were determined using an existing global geologic map [8] and supplemented with data from a global surface dating study by [9].
Preliminary Results: To date, we have mapped approximately 350 volcanic channels interpreted to have formed via flowing lava, although analysis is ongoing. The channels occurred on the rift aprons of the Tharsis Montes and 6 Martian central volcanoes (Ceraunius, Uranus, and Hecates Tholi; Elysium Mons and its rise (above -0.3 km in elevation); Syrtis Major; and Alba Mons) [8-9]. Classification of channel morphology is ongoing although four categories of channels have emerged: sinuous, non-sinuous (fairly straight), pit crater, and bifurcated. Preliminary channel lengths of channels on six central volcanoes range from ~7 to 319 km, with a mean of 61 km and a median of 42 km. Channel widths were between ~0.15 and 3 km, with a mean of 0.54 km and a median of 0.47 km. On average, observed channels had a slope of 2.2 degrees (median of 0.76) and a sinuosity value of 1.11 (median of 1.09). Given the large dataset, analysis is ongoing.
Preliminary Discussion: The presence of lava formed volcanic channels across Martian geologic history suggests the planet was capable of producing low viscosity lavas erupted at sustained effusion rates for much of its history. The lava channels observed on six central volcanoes are broadly consistent in morphology with lunar examples of volcanic channels [3,7], with similar mean sinuosities [1.11 vs 1.2 for the Moon], lengths [61 km vs ~68 km for the Moon], and widths [540 m vs 637 m for the Moon]. Longer channels are additionally observed with higher frequency on the lower flanks of volcanoes, which could suggest easier magma ascent in areas with thinner crust and may hint at the presence of more than one magmatic source feeding channels.

Figure 1: HiRISE image of a sinuous rille on the lower flanks of the Elysium rise. Note the lack of levees which would indicate a constructional process. This section of the channel is 750m wide and 40 m deep
References: [1] Gulick and Baker [1990], J. Geophysical Research: Solid Earth, 95, B9, p. 14325-14344. [2] Oshigami et al. [2009] [3] Hurwitz et al [2013], Planetary and Space Science, 79-80, p. 1-38. [4] Sutton et al. [2022], Icarus, 374, p. 114798. [5] Carr [1973], J. of Geophysical Research, 78, 20, p. 4049-4062. [6] Williams et al. [2005], J. Geophysical Research, 110. [7] Hurwitz et al. [2012], J. of Geophysical Research, 117. [8] Tanaka et. al. [2014], USGS Geologic Map of Mars. [9] Werner [2009], Icarus, 201, p. 44-68. [10] Plescia [2004], Journal of Geophysical Research: Planets, 109, E3.
How to cite: Peters, S., McDonald, W., and Derenoncourt, K.: Assessing the Origin and Evolution of Effusive Volcanic Channels on Mars, EPSC-DPS Joint Meeting 2025, Helsinki, Finland, 7–13 Sep 2025, EPSC-DPS2025-409, https://doi.org/10.5194/epsc-dps2025-409, 2025.
Please decide on your access
Please use the buttons below to download the supplementary material or to visit the external website where the presentation is linked. Regarding the external link, please note that Copernicus Meetings cannot accept any liability for the content and the website you will visit.
Forward to presentation link
You are going to open an external link to the presentation as indicated by the authors. Copernicus Meetings cannot accept any liability for the content and the website you will visit.
We are sorry, but presentations are only available for users who registered for the conference. Thank you.
The formation of large wrinkle ridges in the lunar maria is estimated to have initiated soon after basalt emplacement or synchronous with mare basalt emplacement and cooling. Several studies suggest most large wrinkle ridges formed between 3.5 and 3.1 Ga, and some as recently as 2.4 Ga. Although the timing of early lunar wrinkle ridge formation is well-constrained, we have only recently started to explore the timing of formation and slip-event(s) at small mare ridges using crater counting methods. A large number (2,697) of small mare ridges (SMRs) have been identified across the lunar surface, creating the most complete map to date. Based on their fresh morphologies, cross-cutting relationships with decameter-scale impact craters, and the presence of nearby small-scale graben, SMRs are presumed to have been recently formed and reactivated (< 100 Ma) via stress fields corresponding to global contraction, orbital recession, and solid body tides similar to lobate scarps in the lunar highlands.
To further constrain SMR formation and the timing of coseismic events, we have implemented age determination methods previously used for the lobate thrust fault scarps in the highlands. These methods allow us to investigate the geologic history of SMRs where the cratering record adjacent to the tectonic landform is reset due to seismic shaking related to coseismic slip events on ridge faults. Here, we explore the variations in the crater size-frequency distributions (CSFDs) and derive absolute model ages (AMAs) for a selection of SMRs on the near- and far side of the Moon. The age variations of SMRs and lobate scarps across the lunar surface have the potential to improve our understanding of the evolution of stresses and the degree to which the Moon is currently tectonically active.
Methods: We used high-resolution (2–5 m/px) Narrow Angle Camera (NAC) images from the Lunar Reconnaissance Orbiter Camera (LROC) with high solar incidence angles (55–80°) for our CSFD measurements. Individual NAC images were calibrated and georeferenced in the Integrated System for Imagers and Spectrometers: Version 3 (ISIS3). The CSFD measurements were conducted in QGIS using OpenCraterTools and then exported to Craterstats for plotting and fitting. We used the techniques outlined by [16] and the production and chronology functions of [17], which are valid for lunar craters >10m and <100 km in diameter, to determine AMAs.
Figure 1: Global distribution of 34 lunar scarps ages (circles) and 7 small mare ridge ages (stars, [5] and this study) on an equidistant cylindrical projection of the LROC WAC global mosaic. The color scale goes from yellow to purple, where yellow represents the youngest ages between 0 – 50 Ma, and purple represents ages over 250 Ma.
Clementine Color-Ratio images were used to locate secondary impact crater chains to avoid skewing derived ages. Count areas were placed on relatively flat surfaces with less than a 10-degree slope to minimize mass-wasting effects that could result in younger apparent ages . The sizes of the count areas for SMRs range from 0.5 - 8 km2 and vary based on the size of the tectonic landform and the availability of homogeneous, flat areas. Due to their small size, we estimate that the areas produce errors up to ~20-30% per derived AMA. Past studies of small count areas (0.5 - 2 km2) have found that count area size does not significantly affect the precision of AMAs. Therefore, we assume that the AMAs vary by a few to 10s of million years. A rectangular shape was often used for our count areas, but occasionally, a more irregular shape is required to omit steep slopes, uneven terrain, and limited optimal image coverage for CSFD measurements. The crater diameter fit range has been discussed in detail in previous works.
Results and Discussion: Results from traditional CSFD methods for seven SMRs reveal an age range of ~50 - 310 Ma with an average age of 124 Ma (Fig. 1). This range of ages for SMRs is similar to ages derived for the lobate thrust fault scarps (~24 – 400 Ma) in the highlands [Fig.1]. The temporal similarities between SMRs and lobate scarps suggest that the crustal stresses forming the lobate thrust fault scarps (e.g., late-stage global contraction and tidal forces) are also being expressed by the SMRs.
As seen in other studies using traditional CSFD methods at wrinkle ridges, their application to SMRs is challenging and requires great care to make sure that derived ages are robust and representative. For all CSFD measurements, we explored the crater population in cumulative, differential, and relative forms to get the best fit. The cumulative resurfacing correction was applied to the subset of craters used to derive AMAs. Occasionally, an age cannot be determined because the entire crater population is parallel to the equilibrium line as defined by [30], meaning that the count area is in a crater equilibrium state (i.e., new craters form at the same rate that old craters are erased). Figure 2: The maximum and minimum fit crater diameters affected by seismic events related to ridge activity at lobate scarps (shades of red, [11]) and seven SMRs (shades of blue).
Many of the ages that we fit use a minimum fit near 10 m (Fig.2) because this is the limit allowed by the lunar production function [16]. At present, the 10 m diameter is a boundary condition for our analysis until the production function has been extended to smaller craters. The maximum crater diameter reset by the scarp activity minus the minimum crater diameter defines the ∆Crater diameter (Fig.3). For the seven SMRs, the diameter range is 10 m to 35 m. Compared to the ∆Crater diameter for lobate thrust fault scarps (blue, Fig.3), SMRs (red, Fig.3) have a reduced affected size range and a shallower upward trend toward older ages. The differences in target properties between lobate scarps and SMRs could be one factor controlling the distinct ∆Crater diameter slopes.
Figure 3: Crater diameter range affected by slip motion at lobate scarps (red) and SMRs (blue).
How to cite: Clark, J. D., Nypave, C. A., Frueh, T., Watters, T. R., and Banks, M. E.: Investigating the Seismic Record Around Small Mare Ridges and Lobate Scarps, EPSC-DPS Joint Meeting 2025, Helsinki, Finland, 7–13 Sep 2025, EPSC-DPS2025-2106, https://doi.org/10.5194/epsc-dps2025-2106, 2025.
The scattering attenuation structure of the Martian lithosphere provides key insights into its composition, volatile content, and the geological processes that have shaped the planet’s evolution, including crustal differentiation and impact-induced fracturing. Prior studies of seismic scattering on Mars have largely focused on high-frequency coda envelope modeling using analytical techniques (Lognonné et al., 2020; Karakostas et al., 2021; Menina et al., 2021; Menina et al., 2023) . However, such approaches are inherently limited in their ability to capture the complexity of the Martian subsurface. In this study, we leverage the long-duration, low-frequency coda waves recorded by the SEIS experiment (Lognonné et al., 2019; Lognonné et al., 2023) on InSight (Banerdt et al., 2020) and generated by the largest marsquake recorded, S1222a (Kawamura et al., 2022; Onodera et al., 2023), to delve into the Martian lithospheric scattering structure through full waveform numerical simulations. Using the SPECFEM3D_GLOBE software package (Komatitsch & Tromp, 2002), we model seismic wave propagation accounting for realistic topography, crustal layering including Moho undulations, and stochastic structural variations that represent subsurface heterogeneities. Our simulations successfully reproduce the envelope of long-period scattered coda associated with Rayleigh and Love waves of S1222a and provides new estimations of the S1222a moment and magnitude as function of scattering strength.
Our findings indicate that at frequencies between 0.04 and 0.08 Hz, variations in surface topography and Moho relief, while influential on surface wave travel times, are insufficient to account for the observed strength of the scattered coda waves. Instead, these features are best attributed to large-scale crustal heterogeneities. By fitting the observed coda envelopes with a von Karman-type scattering model, we estimate correlation lengths of 10–20 km and maximum velocity perturbations of 20–30%. Additionally, we find that the southern highlands exhibit background velocities approximately 10% higher than the northern lowlands, along with enhanced scattering strength characterized by maximum perturbations reaching up to 40% (Figure 1). Considering the older geological age and higher crater density of the southern hemisphere (Tanaka et al., 2014), our simulation results imply that the enhanced scattering in the southern highlands may reflect an ancient crust that is highly fractured due to intense meteoritic bombardment, or that preserves more pronounced lithological heterogeneities associated with the formation and long-term evolution of the Martian crustal dichotomy.
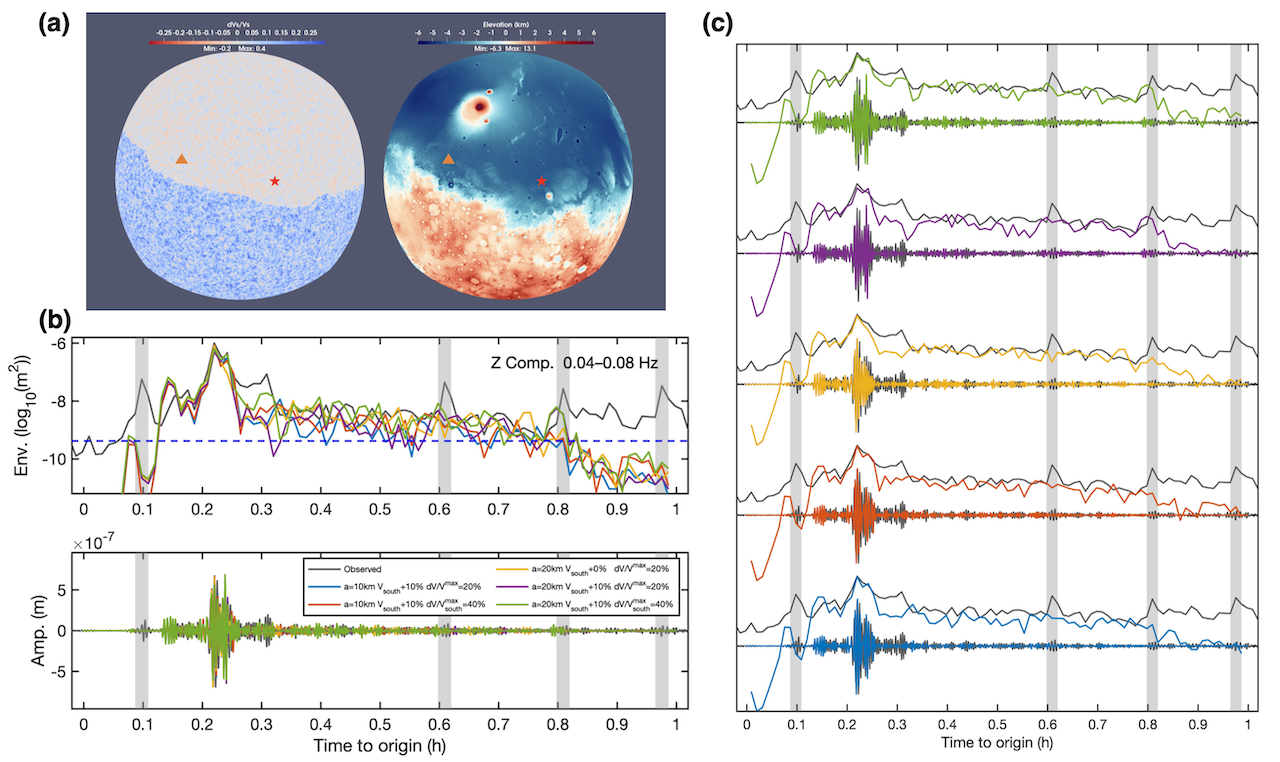
Figure 1. Simulation results. (a) Model configuration. We run the simulation in one chunk covering 120 degrees in both latitude and longitude directions. Surface topography and Moho relief are incorporated into the mesh. Velocity perturbations are generated based on the von Karman scattering model and superimposed on the background velocity structure. The left panel shows the spatial distribution of these perturbations: the northern lowlands exhibit maximum velocity perturbation of 20%, whereas the southern highlands show a 10% increase in background velocities and a maximum perturbation amplitude of up to 40%. The right panel presents the surface topography. The red star marks the epicenter of event S1222a, while the orange triangle indicates the InSight lander location. (b) Comparison between observed and simulated data. The top and bottom panels display envelopes and waveforms, respectively, comparing observations (gray lines) with simulation results (colored lines). Light gray bars highlight glitch-affected time windows. The blue dashed line represents the upper bound of the noise level, calculated as the mean plus three standard deviations of the noise. Colored lines correspond to simulations with varying model parameters, including different correlation lengths, a 10% increase in background velocity in the southern highlands, and a maximum perturbation amplitude of 40% in that region. (c) Individual simulation results. Same as (b), but the simulation results are shown separately for clarity.
References
Banerdt, W. B., Smrekar, S. E., Banfield, D., Giardini, D., Golombek, M., Johnson, C. L., et al. (2020). Initial results from the InSight mission on Mars. Nature Geoscience, 13(3), 183-189. https://doi.org/10.1038/s41561-020-0544-y
Karakostas, F., Schmerr, N., Maguire, R., Huang, Q., Kim, D., Lekic, V., et al. (2021). Scattering Attenuation of the Martian Interior through Coda‐Wave Analysis. Bulletin of the Seismological Society of America, 111(6), 3035-3054. https://doi.org/10.1785/0120210253
Kawamura, T., Clinton, J. F., Zenhäusern, G., Ceylan, S., Horleston, A. C., Dahmen, N. L., et al. (2022). S1222a - the largest Marsquake detected by InSight. Geophysical Research Letters, 49, e2022GL101543. https://doi.org/10.1029/2022GL101543
Komatitsch, D., & Tromp, J. (2002). Spectral-element simulations of global seismic wave propagation—I. Validation. Geophysical Journal International, 149(2), 390-412. https://doi.org/10.1046/j.1365-246X.2002.01653.x
Lognonné, P., Banerdt, W. B., Clinton, J., Garcia, R. F., Giardini, D., Knapmeyer-Endrun, B., et al. (2023). Mars Seismology. Annual Review of Earth and Planetary Sciences, 51, 643-670. Review. https://doi.org/10.1146/annurev-earth-031621-073318
Lognonné, P., Banerdt, W. B., Giardini, D., Pike, W. T., Christensen, U., Laudet, P., et al. (2019). SEIS: Insight’s Seismic Experiment for Internal Structure of Mars. Space Science Reviews, 215(1), 12. https://doi.org/10.1007/s11214-018-0574-6
Lognonné, P., Banerdt, W. B., Pike, W. T., Giardini, D., Christensen, U., Garcia, R. F., et al. (2020). Constraints on the shallow elastic and anelastic structure of Mars from InSight seismic data. Nature Geoscience, 13(3), 213-220. https://doi.org/10.1038/s41561-020-0536-y
Menina, S., Margerin, L., Kawamura, T., Heller, G., Drilleau, M., Xu, Z., et al. (2023). Stratification of Heterogeneity in the Lithosphere of Mars From Envelope Modeling of Event S1222a and Near Impacts: Interpretation and Implications for Very-High-Frequency Events. Geophysical Research Letters, 50(7), e2023GL103202. https://doi.org/10.1029/2023GL103202
Menina, S., Margerin, L., Kawamura, T., Lognonné, P., Marti, J., Drilleau, M., et al. (2021). Energy Envelope and Attenuation Characteristics of High‐Frequency (HF) and Very‐High‐Frequency (VF) Martian Events. Bulletin of the Seismological Society of America, 111(6), 3016-3034. https://doi.org/10.1785/0120210127
Onodera, K., Maeda, T., Nishida, K., Kawamura, T., Margerin, L., Menina, S., et al. (2023). Seismic Scattering and Absorption Properties of Mars Estimated Through Coda Analysis on a Long-Period Surface Wave of S1222a Marsquake. Geophysical Research Letters, 50(13), e2022GL102716. https://doi.org/10.1029/2022GL102716
Tanaka, K. L., Robbins, S. J., Fortezzo, C. M., Skinner, J. A., & Hare, T. M. (2014). The digital global geologic map of Mars: Chronostratigraphic ages, topographic and crater morphologic characteristics, and updated resurfacing history. Planetary and Space Science, 95, 11-24. https://doi.org/10.1016/j.pss.2013.03.006
How to cite: Dai, M., Lognonné, P., Kawamura, T., Menina, S., Xu, Z., and Kizhaekke Pakkathillam, S.: Numerical Modeling the Long Period Scattering Features of Marsquake S1222a, EPSC-DPS Joint Meeting 2025, Helsinki, Finland, 7–13 Sep 2025, EPSC-DPS2025-1061, https://doi.org/10.5194/epsc-dps2025-1061, 2025.
Seismic scattering provides critical insights into the internal structure and dynamics of planetary interiors. In this study, we analyze marsquakes waveform data collected during the InSight mission to investigate the effects of mantle heterogeneities on P-wave propagation. We apply a monte-carlo, particle-based phonon model [1] to derive the seismic scattering on Mars following the approach used to constrain the Earth’s mantle heterogeneities. With this model, we infer 1-D scattering parameters of the shallow subsurface of Mars from existing values of layer depths, mean seismic velocities and mean density by extracting the power spectra of crustal heterogeneity. The model’s envelopes provide good fits to the seismic-energy profiles of both direct arrivals and coda seen InSight’s nearby impacts (S1034a, S0793a, S0981c, S0986c). Our best-fitting parameters reflect existing interior models [2] to more accurately capture the complex scattering behavior in multi-layer heterogeneous media. We apply this model to frequencies up to and beyond 10 Hz, a regime which is better suited to monte-carlo, particle-based modelling compared to other techniques such as finite-difference and spectral-element computation. This model can be extended to distinguish more distant impacts from shallow marsquakes and constrain the scattering contribution of subsurface water [3].
[1] Shearer, P. M., & Earle, P. S. (2004). The global short-period wavefield modelled with a Monte Carlo seismic phonon method. Geophysical Journal International, 158(3), 1103-1117.
[2] Drilleau, M., Beucler, É., Shi, J., Knapmeyer‐Endrun, B., Garcia, R. F., Ansan, V., ... & Banerdt, W. B. (2023). Structure of the Martian crust below InSight from surface waves and body waves generated by nearby meteoroid impacts. Geophysical Research Letters, 50(23), e2023GL104601.
[3] Sun, W., Tkalčić, H., Malusà, M. G., & Pan, Y. (2025). Seismic evidence of liquid water at the base of Mars' upper crust. National Science Review, nwaf166.
How to cite: Zhang, S., Charalambous, C., and Pike, W. T.: Mars Subsurface Structure Investigation from InSight using a Monte-Carlo Method, EPSC-DPS Joint Meeting 2025, Helsinki, Finland, 7–13 Sep 2025, EPSC-DPS2025-2008, https://doi.org/10.5194/epsc-dps2025-2008, 2025.
Meteoroid impacts reshape planetary surfaces and generate seismic waves that probe interior structure — yet on Mars, linking seismic detections to fresh craters remains a major challenge. Seismic events often lack a visible surface feature to confirm the source of recorded marsquakes, while newly imaged craters are rarely matched to a known seismic event. This disconnect stems from limitations in both datasets: seismic signals originating near the surface are affected by strong crustal scattering and uncertainties in attenuation and velocity structure, while orbital imaging is constrained by resolution, material contrasts, coverage gaps, and long revisit intervals.
We demonstrate how combining seismic, seismoacoustic, and orbital data can overcome these barriers. Using data from NASA’s InSight mission, this integrated approach has enabled the confirmation of new impact events [1-5]. Recent work shows that even low-resolution orbital images, when analyzed at the pixel level, can be cross-referenced with seismic signals to improve source localization and refine models of seismic wave propagation on Mars [4].
We present a new, comprehensive test case linking an InSight-detected marsquake to a fresh impact crater, confirmed through integrated analysis of seismic data and a diverse set of orbital images – ranging from high-cadence, low-resolution to high-resolution, low-frequency observations. This cross-disciplinary approach enhances estimates of impact rates [e.g., 6–7], improves our understanding of surface modification processes, and provides a valuable framework for future planetary missions. As we look ahead to lunar seismology and real-time monitoring of other planetary bodies, integrating seismic and surface datasets will be essential for revealing dynamic processes across the solar system.
References: [1] Posiolova et al., 2022, Science, [2] Garcia et al., 2022, NatGeo, [3] Daubar et al., 2023, PSJ, [4] Charalambous et al., 2025, GRL, [5] Bickel et al., 2025, GRL, [6] Daubar et al., 2024, SciAdv, [7] Zenhäusern et al., 2024, NatAstr
How to cite: Charalambous, C., Pike, W. T., Fernando, B., and Zhang, S.: A Multi-Dataset Approach to Confirming Marsquakes as Recent Impact Events, EPSC-DPS Joint Meeting 2025, Helsinki, Finland, 7–13 Sep 2025, EPSC-DPS2025-2012, https://doi.org/10.5194/epsc-dps2025-2012, 2025.
The recent investigation of Mars by InSight [1, 2] has confirmed that seismology is the most powerful way of investigating the interior of any planet, critical for understanding its structure and evolution. However, Venus, with its high surface temperature and pressure present considerable challenges to developing equivalent instrumentation for a similar surface investigation [3]. While this has motivated the development of airborne approaches to detect seismic activity on Venus using infrasound [4], ground truth from the deployment of a seismic package on the surface still provides the most direct path to study the interior.
We describe here the development of a micromachined silicon seismometer, based on the instrument successfully deployed as part of InSight’s seismic payload [5], and the first tests under simulated Venus conditions in the Glenn Extreme Environments Rig (GEER).
The silicon sensor of InSight’s microseismometer offers the possibility of adapting a proven approach of a through-wafer-etched single-crystal-silicon suspension die incorporating gold sputtered electrodes, an insulating oxide and electroplated coils. We have adapted this design by adopting open-loop sensing and using thermocompressive bonding between the die frame and the glass. We demonstrated that open-loop operation does not compromise the noise floor of the device, with a floor below 5x10⁻⁹ m/s2/rtHz, and are modifying the capacitance topology to allow operation over an enhanced tilt range.
To investigate the viability of this approach, prototype sensors were exposed to a Venus environment in GEER. Samples used the same wafer fabrication processes as used for InSight. These results suggest the viability of a sensor fabrication flow based on sputtered gold under a protective oxide and thermocompressive bonding. In parallel, we are undertaking the coupled development of electronics to drive the sensor’s capacitance transducer, with all operations based in the analog domain, and the packaging approach to allow integration of the sensor and its proximity electronics in a robust package.
References: [1] Banerdt W. B. et al. (2020) Nature Geoscience, 13 (3), 183–189. [2] Stahler S. C. et al. (2021) Science, 373 (6553) 443-448. [3] Kremic T. et al., (2020) Planet. Space Sci. 190 (104961). [4] Krishnamoorthy, S., GRL (2022), e2022GL100978. [5] Pike W. T. et al., 2018 IEEE Micro Electro Mechanical Systems (MEMS), Belfast, UK, 2018, 113-116.
How to cite: Pike, W. T., Kremic, T., Funk, N., Adams, C., Krasowski, M., Trunek, A., and Hunter, G.: A Microseismometer for Venus, EPSC-DPS Joint Meeting 2025, Helsinki, Finland, 7–13 Sep 2025, EPSC-DPS2025-2010, https://doi.org/10.5194/epsc-dps2025-2010, 2025.
Please decide on your access
Please use the buttons below to download the supplementary material or to visit the external website where the presentation is linked. Regarding the external link, please note that Copernicus Meetings cannot accept any liability for the content and the website you will visit.
Forward to presentation link
You are going to open an external link to the presentation as indicated by the authors. Copernicus Meetings cannot accept any liability for the content and the website you will visit.
We are sorry, but presentations are only available for users who registered for the conference. Thank you.
Hectometric-scale mound-like features in Terra Sirenum, Mars, have been hypothesized to result from either sedimentary volcanism or small-scale igneous volcanic activity. Discriminating between these processes is essential for understanding the subsurface dynamics, tectonic evolution, and hydrological history of the region. This study provides a comprehensive structural, morphological, and preliminary mineralogical analysis of more than 700 mounds distributed across Terra Sirenum, focusing particularly on the Bernard Crater area, a Noachian-aged impact structure modified by subsequent tectono-magmatic processes. Our work integrates high-resolution orbital datasets (CTX, HiRISE, MOLA, CRISM) into a GIS-based analytical framework, allowing detailed mapping, morphometric analysis, crater size-frequency dating, and mineralogical assessments. The objectives are to characterize the emplacement context of the mounds, identify possible formation mechanisms, and explore the relationship between mound distribution and regional tectonics. The analysis reveals that mound features across Terra Sirenum exhibit significant morphological variability. Morphologies include pitted cones, flat-topped mounds, clustered forms, and aligned mounds along structural trends. In Bernard Crater, mounds frequently occur in association with concentric and radial fracture systems, and their spatial clustering suggests a strong structural control on emplacement. Notably, several features within Bernard Crater display morphologies consistent with collapsed volcanic conduits and dike-fed structures, offering crucial evidence supporting an igneous origin. Crater size-frequency distribution analysis dates the surfaces hosting the mounds to the Noachian epoch (~3.7–4.1 Ga), while some areas within the Terra Sirenum basin suggest resurfacing events during the Hesperian-Amazonian. These results indicate that mound emplacement spanned significant geological timescales, potentially linked to episodic tectonic and magmatic activity associated with the evolution of the Tharsis region. Structural mapping highlights a clear correlation between mound alignments and the regional fault and graben network, particularly those associated with the Sirenum Fossae extensional system. Mounds tend to align parallel to the major graben trends or cluster along secondary fractures, suggesting that tectonic structures acted as preferential pathways for subsurface material ascent. This spatial organization is consistent with mound emplacement mechanisms involving dike intrusions or fault-assisted fluid migration. Preliminary mineralogical analysis using CRISM targeted hydrated and mafic mineral phases indicative of fluid-related processes or igneous activity. Localized detections of alteration minerals, although not definitive, point toward the interaction between subsurface fluids and the surrounding rock matrix during or after mound formation. Comparative analysis with terrestrial analogues strengthens the interpretations. While certain morphological characteristics of the Martian mounds resemble mud volcanoes observed in tectonically active regions such as Azerbaijan and NE China, key differences are apparent and small features from igneous volcanism in Arizona and Iceland. The association of many mounds with fracture corridors, the presence of summit pits suggestive of vent structures, and the absence of widespread mudflows or brecciation argue against a purely sedimentary volcanic origin. Instead, similarities with small igneous cones and dike-induced structures in rift settings, such as those in Iceland, appear more compelling. A central scientific question addressed by this study is whether the observed mound features primarily result from sedimentary extrusion processes (e.g., mud volcanism) or from magmatic activity associated with shallow dike emplacement and small-scale volcanic eruptions. The structural control, morphometric characteristics, and comparative terrestrial analogues collectively favour an interpretation where igneous processes played a major role, particularly within the Bernard Crater area. Nonetheless, given the morphological equifinality between sedimentary and igneous features and the limitations of orbital datasets, a contribution from sedimentary processes cannot be entirely ruled out. Localized episodes of fluid-assisted extrusion, possibly involving groundwater or volatile-rich materials, may have contributed to mound formation in some areas, especially in topographic lows where clustering is observed. In conclusion, the integrated structural, morphological, and preliminary mineralogical evidence suggests that the small mound features in Terra Sirenum, and particularly within Bernard Crater, are more consistent with an igneous volcanic origin than with sedimentary processes. Mound formation appears to have been structurally controlled by extensional tectonics, with subsurface dike propagation likely facilitating localized surface expressions. These findings have significant implications for understanding the tectono-magmatic evolution of Terra Sirenum and the broader highland-lowland transitional region on Mars.
How to cite: Mariani, E., Allemand, P., and Komastu, G.: Hectometric-scale mounds on Mars: insights from Bernard Crater and surrounding terrains in Terra Sirenum, Mars, EPSC-DPS Joint Meeting 2025, Helsinki, Finland, 7–13 Sep 2025, EPSC-DPS2025-474, https://doi.org/10.5194/epsc-dps2025-474, 2025.
Hundreds of sinuous rilles can be found across the maria of the Moon [1]. Nearly all of them were likely formed by lava flows at or near the surface and their morphometry has been used to model constraints on lava viscosity, flow rates, and flow duration [2–5]. Other common landforms on the maria are wrinkle ridges, shortening structures with distinct back-faults formed in the layered mare basalts by compressive stresses [6–9]. Although wrinkle ridges were thought to have formed not too long after maria emplacement during the Imbrian and Eratosthenian [10,11], more recent lines of observations suggest that wrinkle ridge formation might persist into the Copernican era [12–16]. This opens questions about potential hazards into the present day caused by seismic activity [17] which a better understanding of the tectonic evolution of wrinkle ridges could help to constrain. As the intersections of wrinkle ridges and rilles reveal complex stratigraphic relationships that can improve this understanding through the timing of tectonic and volcanic activities, we present a preliminary analysis.
General observations: After a preliminary global survey using wide and near-angle images by the Lunar Reconnaissance Orbiter Camera (LROC) as well as the SLDEM2015 [18,19], we found 64 intersections between rilles and wrinkle ridges (Fig. 1A): 34 in northern and central Oceanus Procellarum, 15 in southern Oceanus Procellarum, 12 in Mare Imbrium, and 3 in Mare Tranquilitatis. Intersections occur on almost the complete range of mare units including both high and low Titanium spectral domains with model ages ranging from 1.3 Ga to 3.7 Ga [19]. While there are two densely spaced clusters north of the Marius Hills volcanic complex and along the southern edge of Oceanus Procellarum, intersections tend to occur where the spatial densities of wrinkle ridges and rilles are the highest [1,11], thus not indicating any statistical anomaly.
Stratigraphy & Conclusions: In 34 cases, a wrinkle ridge clearly uplifted the intersecting rille (Fig.1D), including 3 unambiguous cases of rilles that cut through some scarps of a wrinkle ridge, but another compound scarp uplifted the rille floor. One example is Rima Mairan, which cuts through most of a wrinkle ridge just west of crater Gruithuisen R (Fig.1C). However, close inspection reveals that one compound scarp of the ridge complex uplifts the rille floor, albeit by only ~25 m (Fig.1C, white arrow) while the outside scarp relief is ~50 m. This implies syn-tectonic rille formation, i.e., Rima Mairan, for which model ages of ~1.4 Ga have been derived [20], formed after most of the wrinkle ridge had been uplifted but while one of its compound scarps was still active, potentially with ~25 m of relief forming before and another 25 m of relief after rille formation and therefore within the last ~1.4 Ga.
In 27 cases, a rille unambiguously cuts a wrinkle ridge. This includes 16 cases, where the rille’s path is not deflected by the broader rise (i.e., shallow back-arc) that the wrinkle ridge is located on and does not significantly and/or consistently deepen during its traverse across it (Fig.1E). Although pressurized lava tubes can ascend some obstacles, surface or near-surface lava flows should follow the longer-wavelength topographic gradient as the vast majority of lava tubes and lava channels on Earth, Mars, and the Moon do [1,21,22]. Therefore, this implies that the broader rise formed after the wrinkle ridge and after the rille.
Rilles #40 (~1 km wide) and #43 (~0.5 km wide) as catalogued by [1] at the western margin of the Marius Hills volcanic complex (Fig. 1B) intersect with the same wrinkle ridge, which the former cuts but the latter is uplifted by (Fig. 1B, white arrow). This implies either A) significant effusive activity on the volcanic complex both before and after a large wrinkle ridge was forming, thus potentially indicating crustal shortening occurred alongside voluminous volcanism or B) a localized re-activation of the wrinkle ridge that uplifted rille #40 but not #43, which would indicate uneven wrinkle ridge formation over extended timeframes.
Outlook: While crater size-frequency-based model ages (AMAs) have been presented for select rilles (e.g., Rimae Sharp and Mairan [20]), we are going to derive more AMAs for rilles that provide suitable count areas, i.e., with relatively flat, at least ~0.5 km wide floors (e.g., rilles #40 & #43). This will enable us to bracket wrinkle ridge formation timing and estimate relief growth rates.
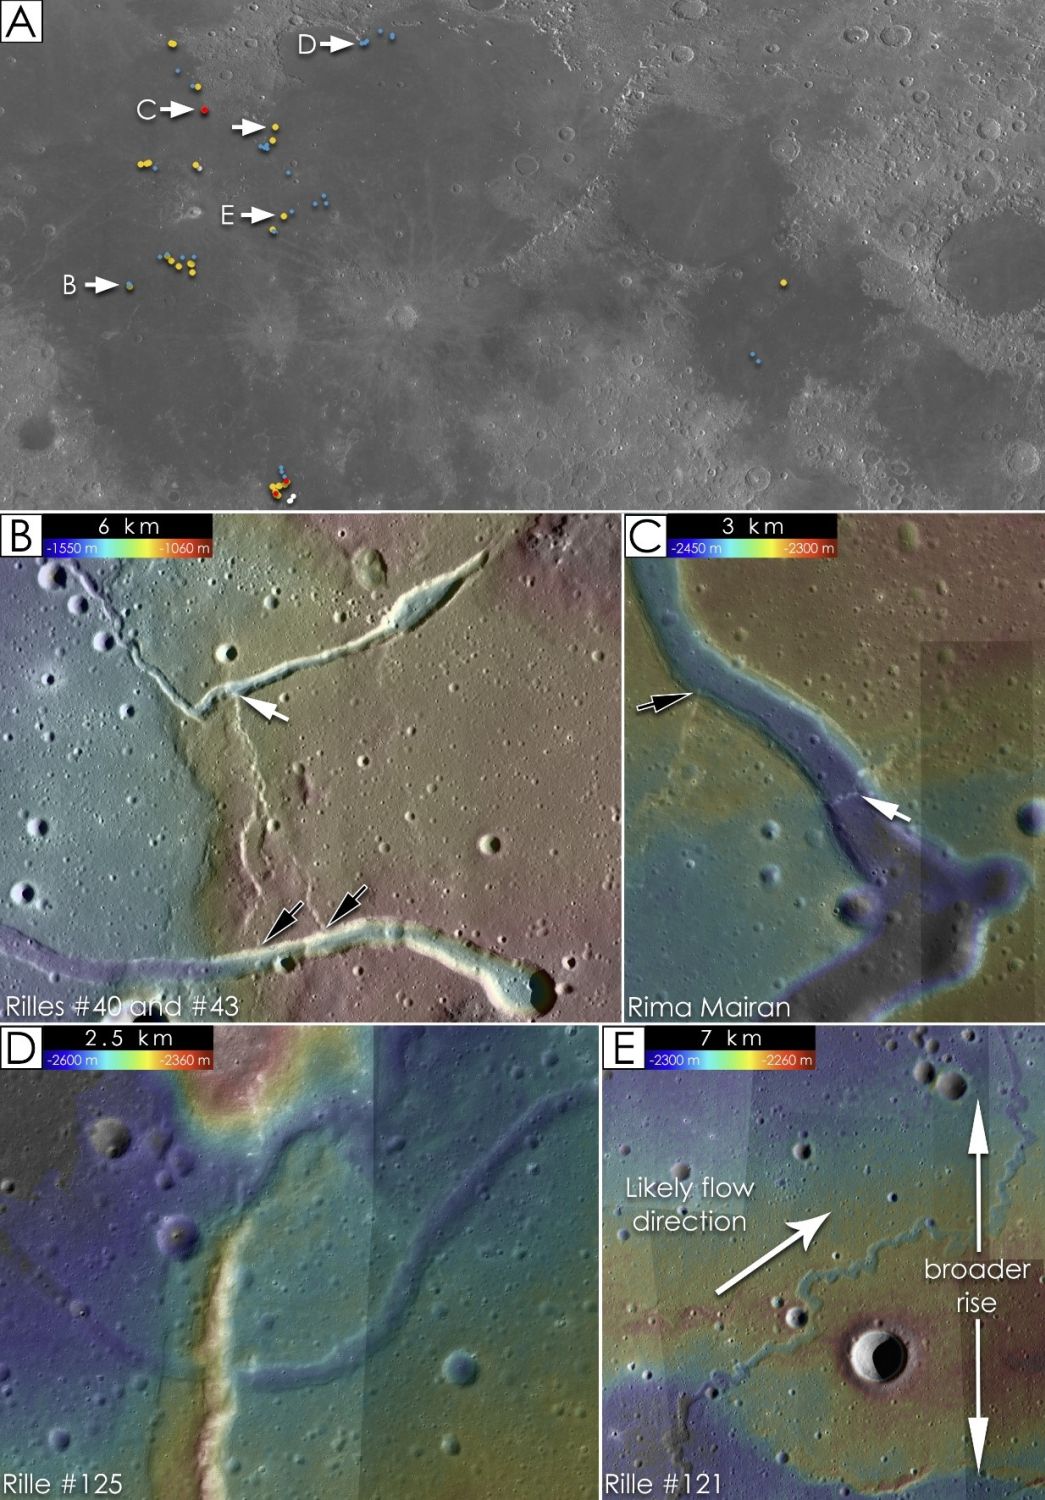
Figure 1: A) Map of part of the lunar nearside showing all catalogued intersections of lunar rilles and wrinkle ridges. Red dots are clearly syn-tectonic rilles, yellow dots are rilles clearly cutting a wrinkle ridge, blue dots are wrinkle ridges clearly uplifting a rille floor, and white dots are ambiguous cases. B) Rilles #40 (bottom) and #43 (top) as numbered by [1]. The white arrow marks where a wrinkle ridge compound scarp uplifted the floor of rille #43, while rille #40 completely cuts the same wrinkle ridge (black arrows). C) Rima Mairan cuts most of a wrinkle ridge (black arrow), but its floor is slightly uplifted by one of its compound scarps (white arrow). D) Rille #125 as numbered by [1] being uplifted by a narrow wrinkle ridge. E) Rille #121 as numbered by [1]. It cuts a wrinkle ridge, but the path of the rille is not visibly affected by the broader rise around the ridge.
References: [1] Hurwitz et al., Planet.Space Sci. 79–80 (2013) [2] Wilson, Head, Planet.Sci. J. 4 (2023). [3] Cataldo et al., (2019). [4] Carr, Icarus (1974). [5] Sehlke, Whittington (2015). [6] Plescia, Golombek, Geol.Soc.Am.Bull. (1986). [7] Schultz, J.Geophys.Res. (2000). [8] Golombek et al., J.Geophys.Res. (2001). [9] Karagoz et al., EarthPlanet.Sci.Lett. (2022). [10] Watters, J.Geophys.Res.SolidEarth 93 (1988) 10236–10254. [11] Yue et al., EarthPlanet.Sci.Lett. 477 (2017). [12] Nypaver et al., Planet.Sci.J. (2025) [13] Nypaver et al., LunarPlanet.Sci.Conf., 2025, 1450. [14] Nypaver et al.,Planet.Sci.J. (2024). [15] Clark et al., LunarPlanet.Sci.Conf., 2024. [16] Frueh et al., J.Geophys.Res.Planets (2023). [17] Watters et al., Planet.Sci.J. (2024). [18] Barker et al., Planet.SpaceSci. (2020). [19] Robinson et al., SpaceSci.Rev. 150 (2010). [20] Xu, Qiao, Astron.Astrophys. 657 (2022). [21] Sauro et al., Earth-Sci.Rev.(2020). [22] Kempe, in: Encycl.Caves., AcademicPress, 2019.
How to cite: Bernhardt, H. and Clark, J. D.: Long-Term Tectonic Activity On The Moon: Multiple Episodes Of Uplift Along Lunar Wrinkle Ridges Implied By Intersections With Sinuous Rilles, EPSC-DPS Joint Meeting 2025, Helsinki, Finland, 7–13 Sep 2025, EPSC-DPS2025-2110, https://doi.org/10.5194/epsc-dps2025-2110, 2025.
Introduction: The temporal trends of the geographic, morphometric, and structural parameters of shortening structures on Mercury are key to better understanding the planet’s history of contraction, tidal despinning, and lithologic/rheologic variation in its current crust [1-4]. Employing the best resolution image mosaics (166 m/px), as well as a novel, global stereo-DTM with three times the resolution of currently available global DTMs [5,6], we are producing a new global map and parameter catalog of shortening structures on Mercury [20].
To assess the temporal trends of scarp parameters and to better understand global/regional stress, we will determine both relative and absolute ages for the shortening structures. Our database will enable us to discern any spatial as well as temporal trends within any of our gathered values. Here, we present our derived ages for the shortening structures on Mercury,
Data and Methods: The gathering of relative and absolute ages is carried out on high- and low-incidence angle, ~166 m/pixel mosaics of images by MESSENGER’s Mercury Dual Imaging System [5]. A relative age bracket will be assigned to all our mapped shortening structures that intersect at least one impact crater (or ejecta) with a diameter >1 km. These structures lend themselves to a stratigraphic classification via the degradation state of the superposing/superposed crater(s)/ejecta [7 22] and assigning a chronographic system as defined by [8] (pre-Tolstojan, Tolstojan, Calorian, Mansurian, Kuiperian). This technique has been previously applied to ~400 large scarps (> 100 km in length) [4] and ~6000 scarps in the northern smooth plains [2].
As degradation states of craters and erosional processes have been suggested to regionally vary on Mercury [9], we will further narrow down the stratigraphy-based age brackets for the shortening structures with absolute model ages (AMAs) [10]. These AMAs will be derived via crater size-frequency distribution (CSFD) measurements [10] on the floors and/or ejecta blankets of sufficiently large craters. Recently used by [11] on five mercurian thrust systems, we will employ the method on a subset of scarps where CSFDs on the floor of a crater cross-cut by the fault would derive a maximum age limit, while CSFDs on the floor of a superposing, unfaulted crater or on the ejecta superposing the fault scarp would give us a minimum age limit. We will use the production model by [12] to determine AMAs, but will also offer AMAs derived with the Neukum production model [13] for comparison. For the Le Feuvre and Wieczorek functions [12], both non-porous and porous scaling laws for target materials will be considered [14]. This will incorporate the effects of a porous megaregolith and non-porous hard rock targets. Reporting AMAs using each production and chronology function allows the best representative age to be reported.
Figure 1: Simple cylindrical view of the H-11 Discovery quadrangle of Mercury with 166 m/pix MDIS high-incidence angle mosaic. Line work shows those shortening landforms we have mapped that lend themselves to relative age dating. Tolstojan (red), Calorian (orange), and Mansurian (yellow) relative ages have been given to shortening structures in the H-11 quadrangle.
Although another method to date linear landforms, buffered crater counting (BCC), has been used on Mercury for very large thrust systems [11, 15-17], the technique requires a sufficient crater population that is superposed on the linear feature [18]. For scarps that are not part of Mercury’s largest thrust systems, there might not be enough or no craters to determine a robust AMA, and therefore, the BCC method will not be used in this global study. Utilizing a stratigraphic model [4], with traditional CSFD measurements in large craters crosscut by the faults [11, 15] will permit comparative ages to be determined, where possible.
Initial Observations: Based on the subset of shortening structures in the H-11 Discovery and H-7 Beethoven quadrangles (n = 239), the majority have a Calorian relative age (52%), with Mansurian being the next largest age subset (39%). Approximately 8% of the structures were labeled as Tolstojan, and only two landforms were labeled as Kuiperian. Those structures that are concentric around the Andal-Coleridge ancient basin in the H-11 quad are mostly Mansurian and Calorian in age.
CSFD measurements were used for a crater cross-cut by a shortening structure in H-11 and produced ages ranging from ~220 Ma to ~3.8 Ga, depending on which production and chronology function was used. We find that the non-porous PF and CF of [12] produce significantly younger ages. The porous function of [12] and [13] produces similar ages. Preliminary AMAs point towards shortening stucture formation starting in early Calorian.
References: [1] P. K. Byrne et al. Nat. Geo. 1 (2014). [2] K. T. Crane & C. Klimczak, Icarus 317, 66 (2019). [3] M. E. Banks et al. JGR. Planets 122, 1010 (2017). [4] M. E. Banks et al. JGR Planets 120, 1751 (2015). [5] S. E. Hawkins et al. SSR, 131, 247-338 (2007) [6] F. Preusker et al., Planet. Space Sci. 142, 26 (2017). [7 22] Trask, N.J. (1975) Proc. Int. Colloq. Planet. Geol., 15, 471-476. [8] Spudis and Guest, in Mercury, pp.118-164 (1988). [9] M. J. Kinczyk et al., In Mercury – Innermost Planet, vol. 2018, 6123. [10] G. Neukum, , Habil. Thesis, Univ. Munich (1983). [11] L. Giacomini et al., Geosci. Frontiers, 18, 15187 (2020). [12] Le Feuvre, M. & Wieczorek, M.A., Icarus, 214, 1-20 (2001). [13] Neukum, G., Ivanov, B.A., & Hartmann, W.K. (2001). SSR, 96 (1-4), 55-86. [14] K. A. Holsapple and K. R. Housen, Icarus, 187, 345-356 (2007). [15] L. Giacomini et al., In Geol. Soc. London, 401, 291-331 (2015). [16] V. Galluzzi et al., LPSC (2016). [17] V. Galluzzi et al., JGR: Planets, 124 (2019). [18] van der Bogert et al., Icarus, 306, 225-242 (2018). [19] K. T. Crane & C. Klimczak, GRL, 44, 3082-3089 (2017). [20] Bernhardt et al., LPSC, Abstract 1406 (2025).
How to cite: Clark, J. D., Bernhardt, H., Preusker, F., Klimczak, C., Banks, M. E., Williams, D. A., Nelson, D., and Watters, T. R.: The Mercury Catalog of Shortening Structures (MerCatSS): Constraining the Ages of Shortening Landforms on Mercury, EPSC-DPS Joint Meeting 2025, Helsinki, Finland, 7–13 Sep 2025, EPSC-DPS2025-2102, https://doi.org/10.5194/epsc-dps2025-2102, 2025.
Introduction
Mercury is a contracting planet that has undergone a global contraction of about 7 km [1]. This contraction has produced ubiquitous compressional landforms—including lobate scarps, high-relief ridges, and wrinkle ridges—that have been active since the Early Calorian period [2] and possibly into the present day [3].
Mercurian faults, like their terrestrial counterparts, likely initiate as small segments that later coalesce into longer, more continuous structures [e.g., 4]. Terrestrial faults typically exhibit bell-shaped displacement profiles, with peak displacement at the center and tapering toward the tips [e.g., 5]. However, observations on Mercury reveal anomalies in this trend, especially near intersections with impact craters, where displacement first drops at the crater rim and then slightly peaks at the crater floor. These deviations suggest syn-tectonic crater formation.
This study investigates such anomalies in three key fault systems—segments of the Victoria System, Discovery Rupes, and Enterprise System—to reconstruct their original displacement profiles and constrain the relative chronology of fault evolution and crater formation.
Data and Methods
Our analysis integrates the MESSENGER/MDIS BDR global basemap (166 m/px), the global DEM [6], and the global structural map [7]. We focus on four fault–crater intersections: the Victoria System at Geddes and Donne craters, the Enterprise System at Karsh crater, and Discovery Rupes at Rameau crater.
Displacement profiles were extracted along multiple cross-fault transects both within and outside the craters. Scarp heights measured along these profiles were plotted against fault length, derived from cumulative transect spacing. Peaks in these plots indicate discrete fault segments. To reconstruct the original (pre-crater) displacement profiles, we linearly interpolated the segment flanks and used their intersection points to estimate the expected maximum displacement. The average y-values of these intersections provided a rough displacement estimation.
By combining the reconstructed profiles with published chronologies [8–11], we derived average slip rates and estimated crater ages based on the modelled displacement accumulation.
Results and Interpretation
Victoria System (Geddes crater): The fault segment cutting Geddes crater displays slight asymmetry between its two major segments. Despite some erosion likely caused by the impact, both segments suggest comparable original displacement. Tectonic activity spanned 3.8–2.4 Ga [8], with 2.43 km of total displacement, yielding a slip rate of ~170 cm/Myr. The observed 1.15 km of displacement within the crater accumulated over ~0.68 Gyr, suggesting a crater age of ~3.1 Ga (Mid Calorian).
Victoria System (Donne crater): The Donne segment features a nearly symmetrical profile adjacent to the crater, indicating undisturbed fault growth. With 1.09 km of total displacement and a slip rate of 78 cm/Myr, the central 0.9 km peak implies 1.15 Gyr of growth. This places Donne Crater’s formation at ~3.55 Ga (Early Calorian), during the fault’s early activity.
Enterprise System (Karsh crater): The Enterprise System is one of the longest fault systems on Mercury, extending over 900 km. With tectonic activity spanning 3.8–0.95 Ga [8] and a maximum displacement of 3.7 km, it yields an average slip rate of 130 cm/Myr. The 0.9 km displacement within Karsh Crater likely developed ~710 Myr before the end of the fault’s tectonic activity, suggesting a crater age of ~1.66 Ga (Late Calorian).
Discovery Rupes (Rameau crater): Absolute dating for Discovery Rupes is unavailable, but it is estimated to have remained active into the Mansurian period (1.7–0.3 Ga) [9]. Assuming faulting began in the Early Calorian (3.85 Ga) [2], the total 1.34 km displacement implies a slip rate of 38 cm/Myr. The 0.6 km displacement within Rameau likely accrued over 1.58 Gyr, suggesting a crater age of ~1.88 Ga (Late Calorian).
Conclusions and Future Work
Our results highlight the diagnostic potential of displacement profiles in reconstructing fault evolution and offer insights into the timing and dynamics of tectonic activity when faults intersect syn-tectonic craters.
Our age estimates for Geddes, Donne, and Karsh craters are consistent with published morphological dating [10], supporting the robustness of our modelling. While the approach is promising, uncertainties remain—especially where long tectonic histories blur temporal resolution (as in the case of Discovery Rupes and Rameau Crater). Ongoing work will systematically date all fault–crater intersections on Mercury, enabling a more comprehensive reconstruction of the planet’s global contraction history.
References: [1] Byrne et al. (2014). Nature Geoscience, 7, 301–307. [2] Crane & Klimczak (2017). Geophysical Research Letters, 44(7), 3082-3089. [3] Tosi et al. (2013). JGR: Planets, 118(12), 2474-2487. [4] Klimczak et al. (2013). JGR: Planets, 118, 2030-2044. [5] Kim & Sanderson (2005). Earth-Sci. Rev., 68(3-4), 317-334. [6] Becker et al. (2016). LPSC Contrib., 1903. [7] Man et al. (2023). Nature Geoscience, 16, 856–862. [8] Galluzzi et al. (2019). JGR: Planets, 124, 2543-2562. [9] Giacomini et al. (2020). Geoscience Frontiers, 18, 15187. [10] Clark et al. (2024). LPSC Contrib. No. 3040. [11] Kinczyk et al. (2020). Icarus, 341, 113637.
Acknowledgements: We gratefully acknowledge funding from the Italian Space Agency (ASI) under ASI-INAF agreement 2024-18-HH.0.
This research is also supported by INAF through RSN3 Mini-Grant “Investigation of Mercury’s Tectonics (iMeT)”
How to cite: Sepe, A., Ferranti, L., Galluzzi, V., Schmidt, G. W., Buoninfante, S., and Palumbo, P.: Reconstructing Displacement Histories at Fault–Crater Intersections on Mercury., EPSC-DPS Joint Meeting 2025, Helsinki, Finland, 7–13 Sep 2025, EPSC-DPS2025-1726, https://doi.org/10.5194/epsc-dps2025-1726, 2025.
Introduction
Fault scaling relationships are essential for understanding tectonic deformation [1] and seismic potential [2], particularly on planetary bodies where direct geophysical data are scarce. Following the InSight mission’s detection of marsquakes at Cerberus Fossae [3], a regional set of extensional fractures, interest in Martian tectonics has grown. Memnonia Fossae, a region with similar structural characteristics but much older tectonic history, provides a valuable opportunity to explore the long-term evolution of fault systems on Mars. A thorough analysis of fault geometry can reveal important information about how fault systems develop over time and how they respond to mechanical forces [4,5]. However, fault scaling studies on Mars are still limited due to the challenges of obtaining high-resolution topographic data [6]. To overcome this, we use the Reykjanes Peninsula in Iceland as a terrestrial analogue, where active tectonic processes in basaltic terrains mirror those believed to occur on Mars. Studying fault scaling in Reykjanes enhances our understanding of fault dynamics that can be applied to planetary systems.
Methods
In a previous study, we analyzed fault scaling in Memnonia Fossae using remote sensing data from 100 normal faults, obtaining a maximum displacement-to-length (Dmax/L) ratio of 0.007. For the present study, we focused on the Reykjanes Peninsula as an Earth analogue. During fieldwork, we collected structural measurements from 74 faults and fractures across 180 locations, recording parameters such as strike, dip, opening, throw, shear, and extension vectors. In addition, the Arctic DEM and drone imagery were employed to enhance the resolution of topographic data. This combination of field measurements, remote sensing, and drone data allowed for a detailed characterization of fault geometries and displacement.
Results
Analysis of the Icelandic data yielded a Dmax/L ratio of 0.006, which is very close to the values previously derived for Memnonia Fossae and aligns with reported fault scaling results for basaltic terrains on Earth. The integration of drone-derived topography was crucial in refining displacement estimates and allowed for a stronger comparison between Martian and terrestrial fault systems.
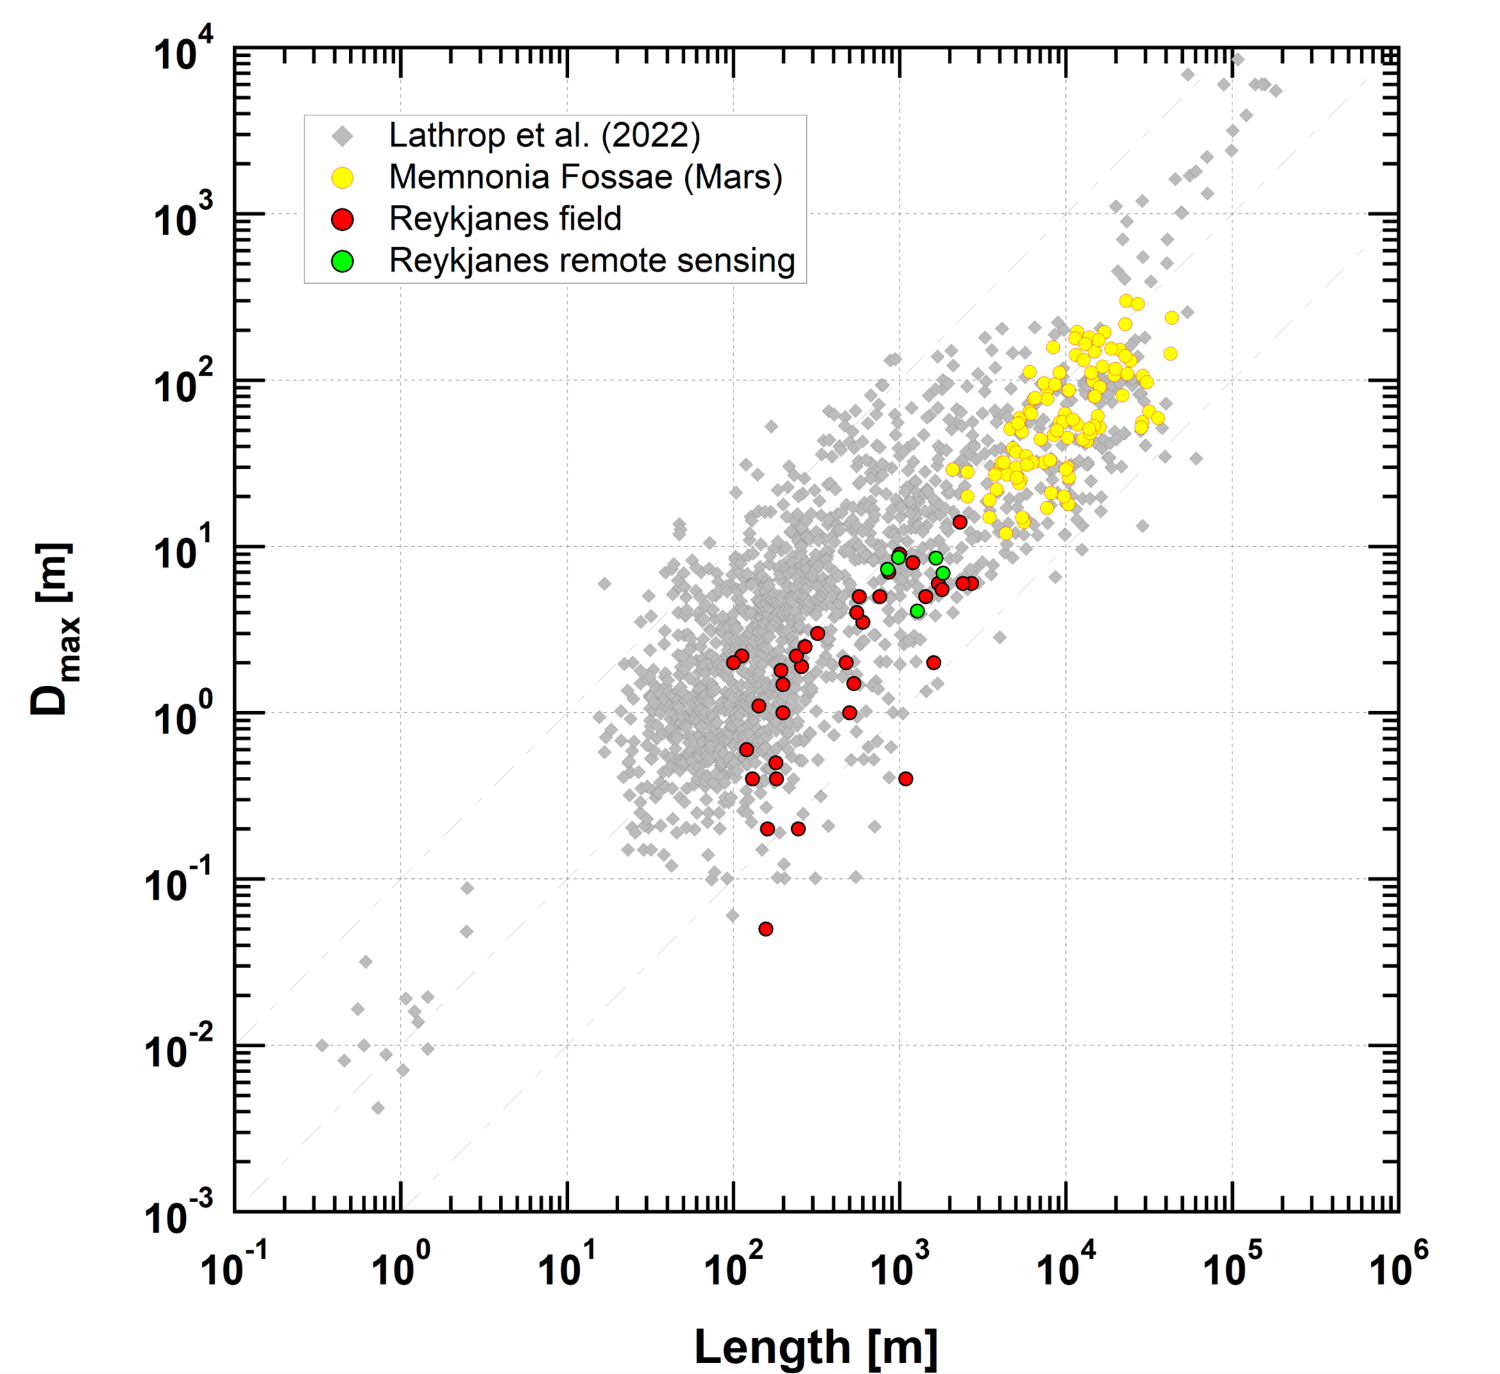
Figure 1: Dmax/L ratio comparisons of Memnonia Fossae, Reykjanes, and volcanic rocks on Earth [7].
Conclusion
This study demonstrates the value of combining field measurements, remote sensing, and drone data to improve the understanding of fault scaling on both Earth and Mars. The similarities observed between faults in Reykjanes and Memnonia Fossae suggest that similar fault growth mechanisms may operate in both regions, despite their different origin and ages. The geologically recent Reykjanes faults are associated to a rift zone along the plate boundary on Earth, whereas the Memnonia faults are formed in the ancient crust of a one-plate planet. By examining older fault systems like Memnonia Fossae alongside more active regions such as Cerberus Fossae, we gain valuable insights into the tectonic evolution of Mars. The findings highlight the importance of multi-source Earth-based datasets in advancing planetary fault research, particularly in the absence of direct geophysical data from Mars.
Acknowledgment
This work was supported by Europlanet Transnational Access Iceland funding.
References
[1] Schultz, R.A. et al. (2010) J. Struct. Geol., 32, 855-875. [2] Wells, D.L. and Coppersmith, K.J. (1994) Bull. Seismol. Soc. Amer., 84, 974-1002. [3] [11] Drilleau, M., et al., (2021) EGU General Assembly. Conf. 14998. [4] Cartwright, J. A., et al., (1995) J. Struct. Geol. 17, 1319-1326. [5] Cowie, P.A. and Scholz, C.H., (1992) J. Struct. Geol. 14, 1133-1148. [6] Gwinner, K. et al., (2010) Earth Planet. Sci. Lett. 294, 506-519. [7] Lathrop, B. A., et al., (2022) Frontiers in Earth Science, 10, 907543.
How to cite: Yazıcı, I. S., Kenkmann, T., Sturm, S., Karagoz, O., Hauber, E., and Tirsch, D.: Fault Scaling and Tectonic Insights from Reykjanes Peninsula: An Earth Analogue for Martian Extensional Faults, EPSC-DPS Joint Meeting 2025, Helsinki, Finland, 7–13 Sep 2025, EPSC-DPS2025-1778, https://doi.org/10.5194/epsc-dps2025-1778, 2025.
Please decide on your access
Please use the buttons below to download the supplementary material or to visit the external website where the presentation is linked. Regarding the external link, please note that Copernicus Meetings cannot accept any liability for the content and the website you will visit.
Forward to presentation link
You are going to open an external link to the presentation as indicated by the authors. Copernicus Meetings cannot accept any liability for the content and the website you will visit.
We are sorry, but presentations are only available for users who registered for the conference. Thank you.
Please decide on your access
Please use the buttons below to download the supplementary material or to visit the external website where the presentation is linked. Regarding the external link, please note that Copernicus Meetings cannot accept any liability for the content and the website you will visit.
Forward to session asset
You are going to open an external link to the asset as indicated by the session. Copernicus Meetings cannot accept any liability for the content and the website you will visit.
We are sorry, but presentations are only available for users who registered for the conference. Thank you.