
 1,2,2,
- 1Northern Arizona University, Flagstaff, Arizona, United States of America (shemmelgarn@lowell.edu)
- 2Lowell Observatory, Flagstaff, Arizona, United States of America (shemmelgarn@lowell.edu, nmosko@lowell.edu)
- 3University of Western Ontarion, London, Ontario, Canada (denis.vida@lowell.edu)
Introduction
Classifying meteoroids based on their physical properties is important for understanding their origins, how they evolve, and what parent bodies they may be linked to. Current classification methods typically rely on simplified physical models like single-body ablation theory or use only a small number of observable characteristics. A commonly used approach is the Kb parameter, which estimates a meteoroid’s material strength based on how it penetrates the atmosphere. But using Kb requires several derived quantities and depends on assumptions about the meteoroid’s structure and behavior. This limits how broadly and objectively the method can be applied, especially when dealing with the large datasets produced by modern automated meteor camera networks.
More advanced fragmentation models can provide better insights, but they’re computationally intensive and have only been applied to relatively small datasets, typically just a few dozen meteors at a time. As these networks continue to grow, we need more scalable and objective methods that rely only on what we can directly observe.
Here, we’re developing a machine learning approach to classify meteoroids based purely on observed characteristics. We use 13 features that can be consistently measured from low-light video cameras, such as energy received before ablation, atmospheric density, and trail length. These inputs are analyzed using dimensionality reduction and clustering to find natural groupings in the data. The goal is to create a reliable, scalable way to classify meteoroids that can keep up with the size and complexity of current and future meteor datasets.
Methods
This project uses data collected in 2023 from two low-light meteor camera networks: the Croatian Meteor Network (CMN) and the Lowell Observatory Cameras for All-sky Meteor Surveillance (LOCAMS). The CMN network features cameras with 16mm lenses, allowing for fainter meteor detections and better orbit fits. LOCAMS operates across the state of Arizona and records high-resolution trajectory data for hundreds of meteors per night. Both networks contribute their observations to the Global Meteor Network (GMN), which publishes publicly accessible datasets that include physically meaningful features.
We focused on directly observable parameters to ensure that our analysis is interpretable, scalable, and transferable across datasets. These include trail length, energy received, deceleration, peak brightness height, atmospheric density at multiple trajectory points (beginning, peak, end), mass and velocity in logarithmic form.
Before applying machine learning methods, the dataset was standardized using Python-based scikit-learn’s StandardScaler to ensure equal weighting across all features. This step is necessary for algorithms that rely on
To reduce dimensionality and highlight key patterns in the data, we applied Principal Component Analysis (PCA) to the normalized feature set. PCA identifies the principal axes along which the data varies most and projects the dataset onto these axes. The first two principal components capture approximately 95% of the total variance.
The PCA matrix indicates that the first principal component (PC-1) is driven primarily by energy received (0.773) and negatively by trail length (−0.608), with smaller contributions from mass and atmospheric density. This axis appears to reflect a combination of total energy and material penetration behavior. The second principal component (PC-2) is shaped by atmospheric density at the beginning, peak, and end of the trajectory (all 0.446), along with trail length (0.350) and mass (0.249), suggesting a link to fragmentation behavior and how a meteoroid interacts with varying atmospheric conditions during entry.
After dimensionality reduction, we applied a Median Absolute Deviation (MAD) filter to further identify and remove features that contribute minimal variability to the overall dataset. For each feature, MAD was calculated as the median of the absolute deviations from that feature's median value. Features with MAD values less than 50% of the median of all MAD values were excluded. This step refined the input to include only those features contributing the most physical diversity to the dataset, leaving eight features: energy received, deceleration, beginning, peak, and end atmospheric densities, trail length, peak magnitude, and mass in kg.
To identify potential groupings within the meteor population, we applied the scikit-learn’s K-Means clustering algorithm to the PCA-transformed dataset. The elbow method was used to determine the ideal number of clusters by plotting the within-cluster sum of squares against the number of clusters and identifying the point where additional clusters no longer significantly reduce variance. Based on this analysis, three clusters were identified.
Results
Unsupervised clustering applied to the PCA-transformed dataset revealed three groups of meteoroids, which we interpret as representing carbonaceous, asteroidal, and cometary materials. The first principal component is most strongly influenced by energy received and trail length, suggesting a relationship with material strength and penetration depth. The second component highlights variation in atmospheric density and mass, which likely reflects differences in deceleration and fragmentation behavior. These clusters appear well-separated in principal component space (Figure 1), indicating physically meaningful differences in meteoroid behavior.
The carbonaceous-type cluster shows intermediate values across most features. The asteroidal cluster includes high-energy meteors with low deceleration and deep atmospheric penetration, traits consistent with dense, rocky material. A subset of events within this cluster may represent iron-rich meteoroids, given their unusually high energy and deep penetration. The cometary cluster contains low-mass meteors with high deceleration and higher entry altitudes, aligning with expectations for fragile, porous cometary sources. These interpretations are supported by differences in initial velocity and begin height (Figure 2), with cometary meteors tending to enter faster and at higher altitudes. Figure 3 separates the clusters into individual subplots, illustrating how the density distributions vary across each classification.
Unlike traditional methods that rely on derived quantities and model assumptions, this classification is based entirely on directly observed features. Future work will focus on linking these clusters to known meteor showers to further compare to this model.
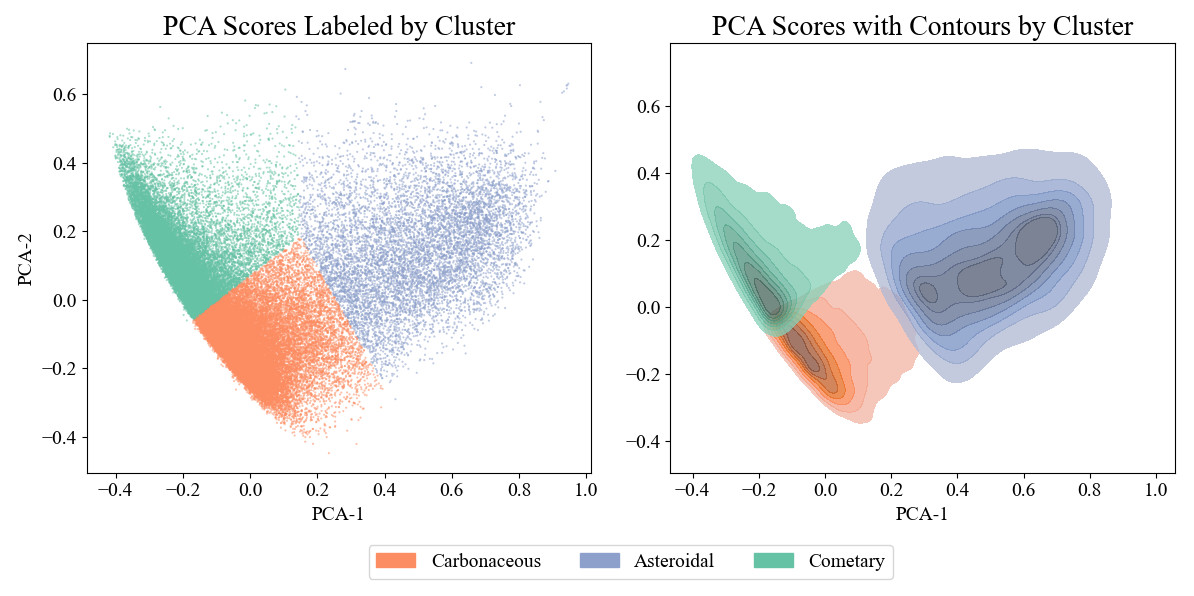
Figure 1: PCA scores plotted as a scatter plot and color coded by physical interpretation on the left. The same scatter plot transformed into a contour plot using kernel density estimation (KDE) on the right.
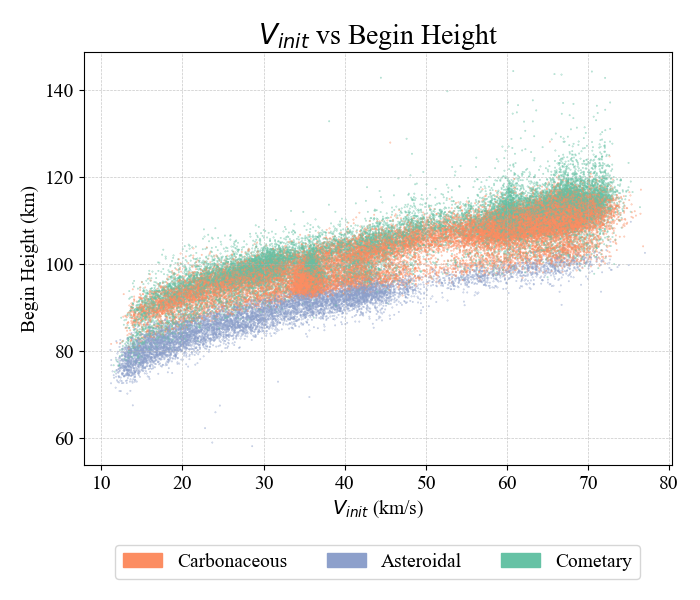
Figure 2: Initial velocity vs. beginning height color coded by their physical interpretation.
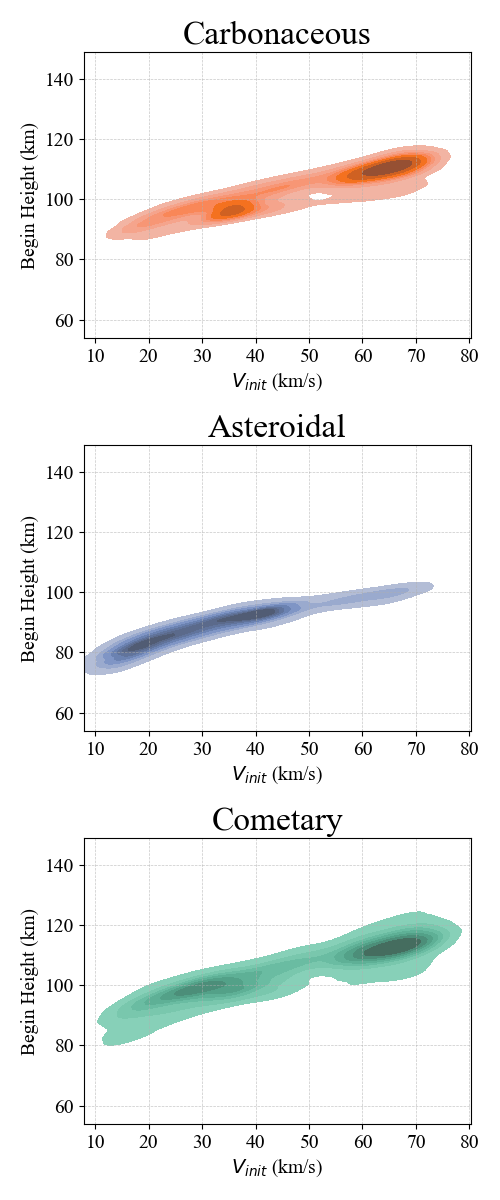
Figure 3: Figure 2 transformed into individual contour plots using KDE and titled by physical interpretation.
How to cite: Hemmelgarn, S., Moskovitz, N., and Vida, D.: A Machine Learning Application to Meteor Classification, EPSC-DPS Joint Meeting 2025, Helsinki, Finland, 7–12 Sep 2025, EPSC-DPS2025-442, https://doi.org/10.5194/epsc-dps2025-442, 2025.