
 1,1
1,1- 1Technical University of Munich, Lunar and Planetary Exploration, Lise-Meitner-Str. 9, 85521 Ottobrunn, Germany
- 2Southwest Research Institute, 6220 Culebra Rd., San Antonio, TX 78238, USA
Introduction.
Traditionally, models of surface-bounded exospheres assumed a perfectly spherical planetary surface. Neglecting the surface roughness and topography simplifies the surface-exosphere interaction and reduces the computational complexity and effort. One of the consequences of this simplification can be seen in the surface temperatures, which are often included as a simple analytical formula based solely on the subsolar location, or as a look-up function based on remote sensing data (e.g., Butler, 1997; Crider an Vondrak, 2002; Killen et al., 2019). These approaches do not account for the surface variability and local shadowing, which causes colder surfaces and hotter slopes tilted towards the Sun.
Recent studies have begun to address surface roughness in exosphere modelling: Prem et al. (2018) introduced small‐scale shadows through Gaussian roughness in water‐exosphere simulations, finding enhanced water retention; Grava (2023) used altitudes from LOLA and temperature snapshots from Diviner to find that topography and its resulting change in surface temperatures plays an important role for the exosphere; Laferriere et al. (2025) investigated sloped temperature distributions for OH/H₂O, reporting locally colder surfaces and higher adsorbed concentrations. Though, their low particle counts highlighted a need for more numerically efficient approaches. In this work, we present a new and efficient approach to including relevant surface slopes in a lunar exosphere Monte Carlo simulation to model noble-gas particle density distributions and investigate the effects of slopes. This study aims to quantify how realistic slope distributions based on the LOLA dataset influence noble gas distributions in the lunar exosphere.
Methods.
High‐resolution LOLA topography (512 px/°) was processed into cumulative density functions (CDFs) of slopes for 1°x360° latitude strips, depicted in Figure 1. Each line in this plot represents the CDF of a single strip, showing that topographic slope distributions on meter scales across the entire Moon’s surface are relatively similar, with only some exceptions close to the poles. In our model, a new slope is drawn from the CDF at the corresponding latitudinal position at every surface interaction, including topography purely probabilistically and, thus, more efficiently.
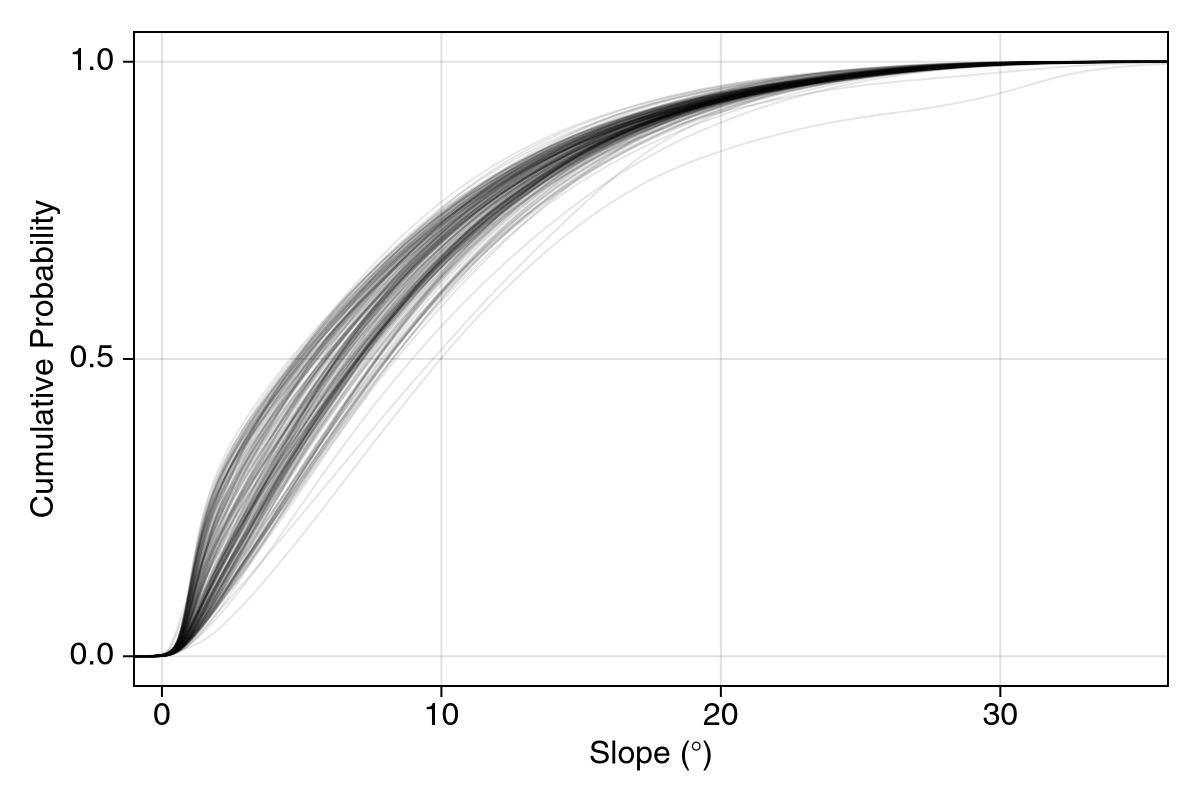
Figure 1. Cumulative distribution functions of surface slopes from 1°x360° latitude strips on the Moon, based on the LOLA dataset. Each line represents one strip, with more than 90 % of slopes falling below 20°. The maximum observed slope approaches 80°.
Surface temperatures were computed using the model of Butler (1997), as adapted by Crider & Vondrak (2002) and Killen et al. (2019), with the local solar incidence angle adjusted for slope magnitude and azimuth, based on Duffie and Beckman (2013). This resulted in a distribution of surface temperatures at every subsolar location linked directly to the slope distribution. Since the mean temperatures of these distributions are lower than their reference, the no-slope temperature of the analytical model at the same location, an additional temperature offset (-20K to +60K) was included in the simulation to keep the global thermal environment as similar as possible. Figure 2 shows this temperature offset at each solar incidence angle (black markers) and its fitting (orange line), done with a 20-step multilinear, exponentially spaced model.
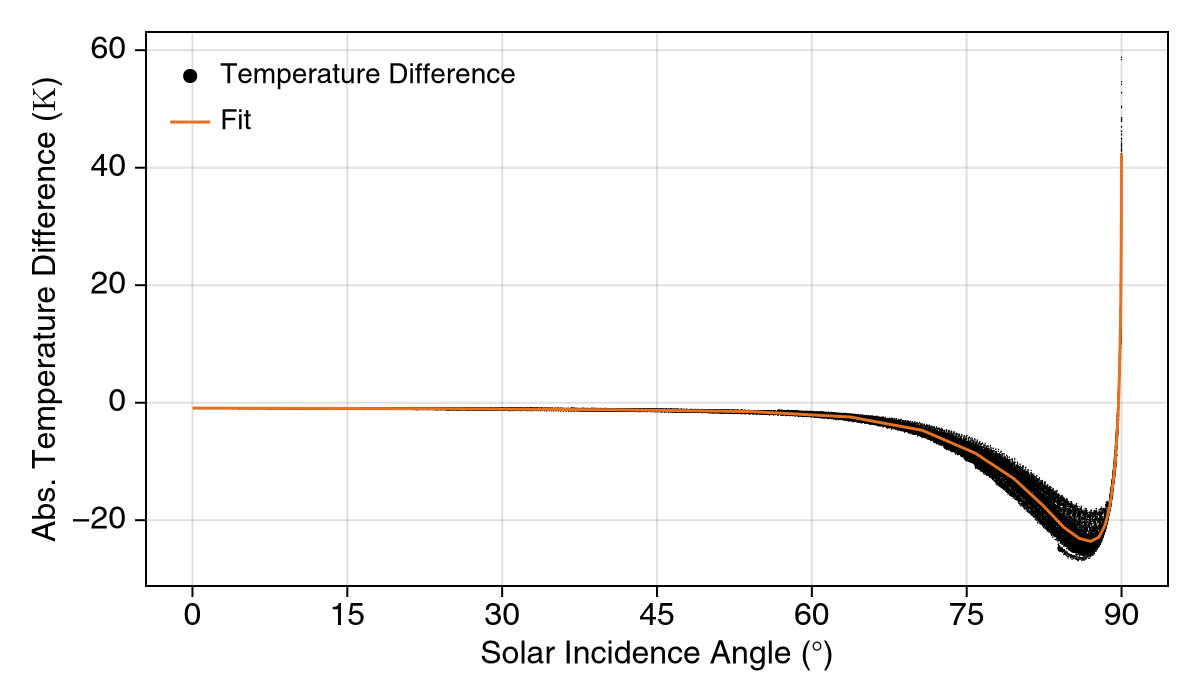
Figure 2. Difference between sloped‐surface and flat‐surface temperatures as a function of solar incidence angle, and the 20‐step multilinear offset fit.
This topography and surface temperature model was included in our particle-tracking code, extending on previous work described by Smolka et al. (2023) for three-dimensional exospheres. Release velocities were also rotated according to the slope and its azimuth, introducing two main changes: the geometrical, and the thermal influence of slopes on exosphere densities and dynamics.
Preliminary and Expected Results.
The first results show that the probabilistic approach of surface topography can be included in a Monte Carlo simulation without any major drawbacks regarding numerical efficiency. Surface number densities of Helium, see Figure 3, show increases up to ~25% along the terminator regions. This is strongly connected to the temperature model, which has the biggest spread close to solar incidence angles of 90°, see Figure 2. Preliminary studies of Neon showed similar effects, though, with lower density increases, consistent with cooler temperatures and more surface‐hugging trajectories. The effects on the Argon densities are expected to be stronger, compared to both Helium and Neon, due to adsorption on cold surfaces using the presented topography model.
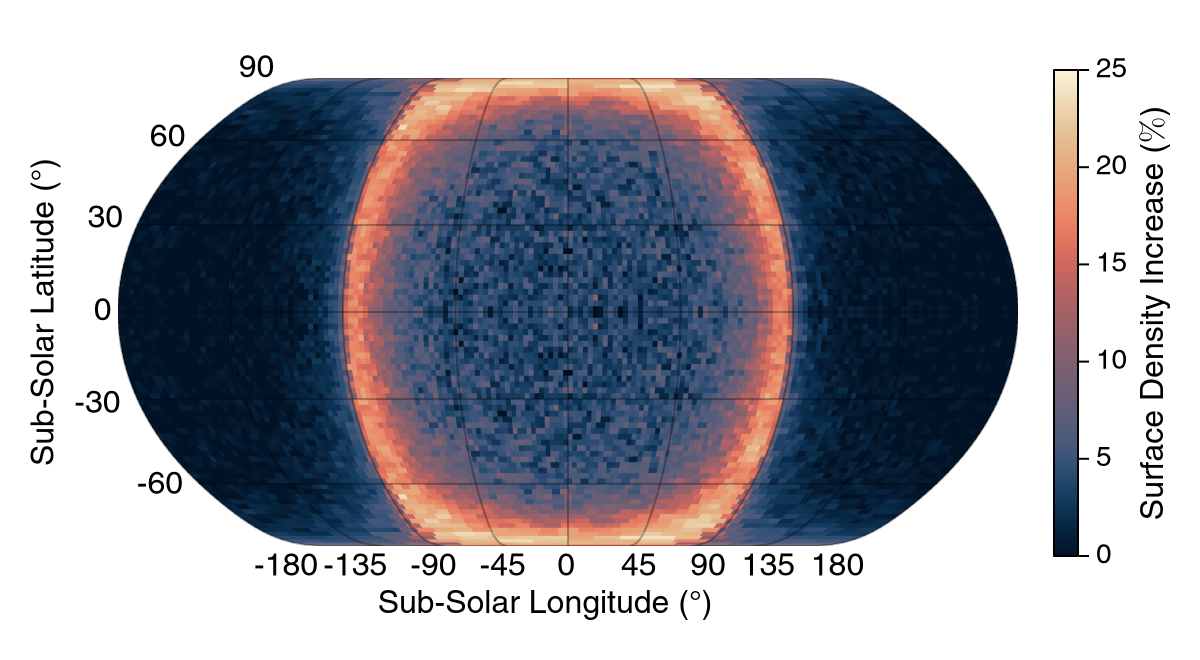
Figure 3. Heatmap of the percentage increase in steady‐state Helium surface density when including slopes, relative to a flat‐surface simulation.
Conclusion and Future Work.
The planned validation against LADEE and LAMP exospheric density measurements will assess implications for satellite data interpretation. We will extend the refined temperature model to hydrogen‐based species to quantify topography effects on the lunar water cycle. In the long term, the incorporation of advanced surface temperature models (e.g., Hurley et al., 2015) and Diviner data will bridge the gap to more realistic simulations.
This research demonstrates not only that including realistic data-based topography in exosphere simulations is computationally feasible but also highlights its necessity for capturing lunar exospheric dynamics.
References.
Butler (1997). Journal of Geophysical Research, 102(E8), 19283–19291.
Crider and Vondrak (2002). Advances in Space Research, 30(8), 1869–1874.
Duffie and Beckman (2013). Solar Engineering of Thermal Processes (4th ed.). John Wiley.
Hurley et al. (2015). Icarus, 255, 159–163.
Killen et al. (2019). Icarus, 329, 246–250.
Prem et al. (2018). Icarus, 299, 31–45.
Grava (2023). Dust, Atmosphere, and Plasma Environment of the Moon and Small Bodies (DAP-2023).
Smolka et al. (2023). Icarus, 397, 115508.
Laferriere et al. (2025). Journal of Geophysical Research: Planets, 130(4).
How to cite: Peschel, A., Grava, C., Breternitz, J., and Reiss, P.: Probabilistic Modelling of Lunar Topography for Improved Exosphere Simulations, EPSC-DPS Joint Meeting 2025, Helsinki, Finland, 7–12 Sep 2025, EPSC-DPS2025-451, https://doi.org/10.5194/epsc-dps2025-451, 2025.