
 12
12- 1German Aerospace Center (DLR), Department of Planetary Physics, Berlin, Germany (adrien.broquet@dlr.de)
- 2Lunar and Planetary Laboratory, University of Arizona, USA
Mercury’s geodynamic evolution has been characterized by a long history of global contraction in response to interior cooling and inner core growth [1]. A record of this history is preserved in the form of a global population of compressional landforms, including lobate scarps, high-relief ridges, and wrinkle ridges [2,3]. Different interpretations of Mercury’s tectonic record led to distinct contraction estimates of <2 km [2] or up to 7 km [3]. Proponents of the large contraction interpretation consider all tectonic landforms, including wrinkle ridges, as lithosphere-scale faults activated by global planetary contraction, while other interpret wrinkle ridges as thin-skinned structures that do not reflect global contraction. In addition, studies commonly use displacement-length ratios to estimate global contraction. However, it is unclear whether such approach can adequately infer global contraction from tectonic databases that are subject to ridge segmentation and where the shortening associated with individual faults might be overestimated with the mapping of secondary ridges [2]. A further key outstanding question is to what extent strain from deformation of the lithosphere contributes to the tectonic record.
Here, we revisit Mercury’s tectonic record using a global tectonic database [4] together with machine learning to evaluate tectonic strain. We then invert observed gravity and topography to estimate how lithospheric deformation contribute to the tectonic record.
Methods:
Ridge database. We extract 1-km-spaced elevation profiles from a global DEM [5] at each of the 18,500 individual ridge segments mapped by [4] (Fig. 1A). The profiles are outlier-corrected, detrended, shifted and aligned to construct a representative average profile for each segment.
Primary ridges. In some previous work, an independent fault was attributed to each tectonic landform, including small scarps on the shoulder of a larger ridge, which can lead to instances of double counting of strain [2,3]. To avoid this issue and map primary structures, we created a 100-km-wide rectangular box along each ridge segment. A ridge is considered as primary if it is not intersecting any other box, or if it is intersecting other boxes including parallel ridges over >20% of the rectangular box area, but is the longest of all. This approach removes small secondary ridges that are parallel and in close vicinity to a longer ridge, and assumes that the removed ridges are related to the primary fault that formed the longest regional ridge in that specific direction.
Tectonic strain. We constructed a Keras neural network [5] to map ridge endpoints in profiles orthogonal to the ridge strike. The network was trained on 100 visually inspected profiles for which we provided ridge endpoints. Ridge height is estimated as the elevation difference between ridge crest and endpoints. Comparison to previous mapping indicates the network adequately estimates ridge height. Tectonic shortening is estimated assuming a 30° dip and contraction is mapped considering ridge orientation, location, and height.
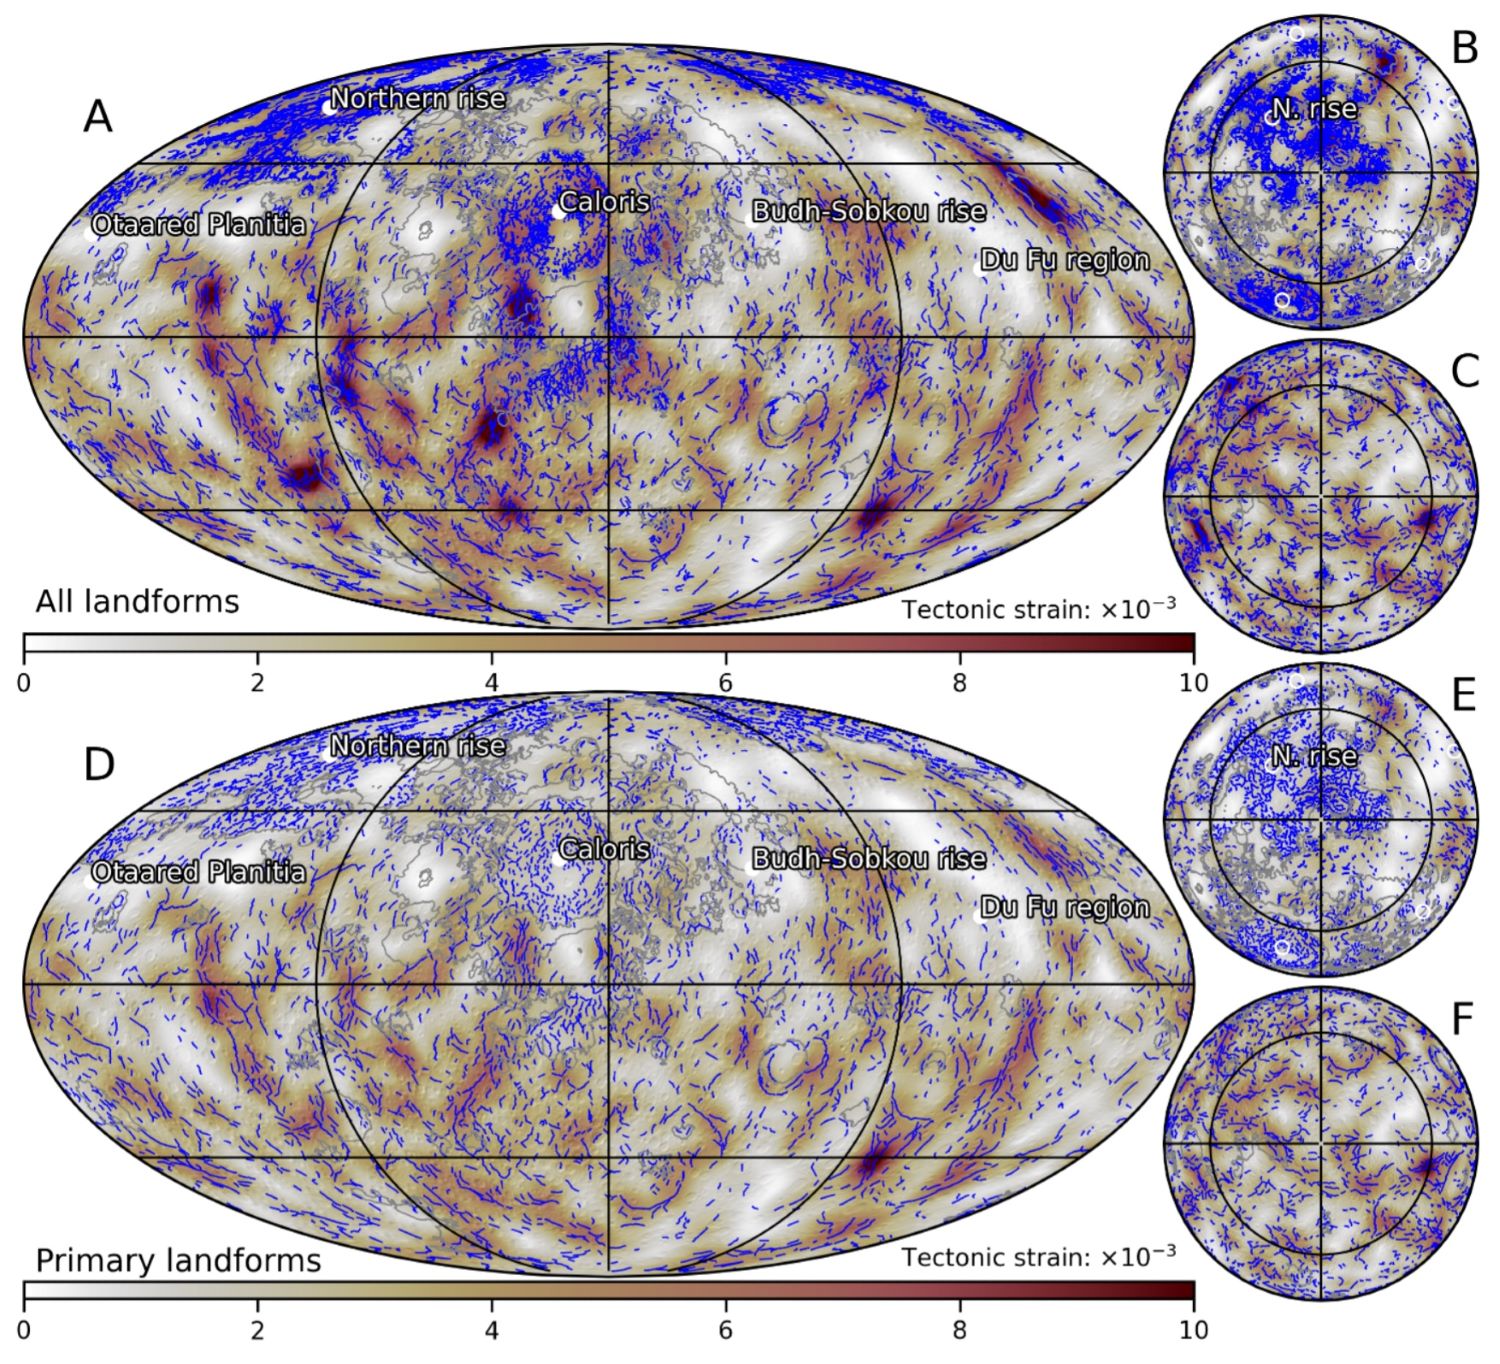
Fig. 1: Tectonic strain considering all (top) and primary (bottom) landforms. The leftmost maps are in Mollweide projection (A, D) and others are in north (B, E) and south (C, F) polar projections. Tectonic landforms are shown in blue and smooth plains are in grey.
Membrane-flexural strain. In one inversion, crustal loading and lithospheric flexure are used to infer membrane-flexural strain, with crustal top/bottom loads being constrained from gravity and topography [6]. In a second inversion, we use a combination of crustal and mantle loading, together with lithospheric flexure. Long-wavelength gravity and topography are assumed to result from an isostatic crust with crustal top/bottom loads in the isostatic ratio, combined with support from a variable density mantle. Shorter wavelengths are attributed to crustal loading and the transition between both regimes is defined by a cosine taper with a 10-degree bandwidth and half amplitude at degree 15 [6]. We assume average elastic and crustal thicknesses of 40 and 30 km, respectively.
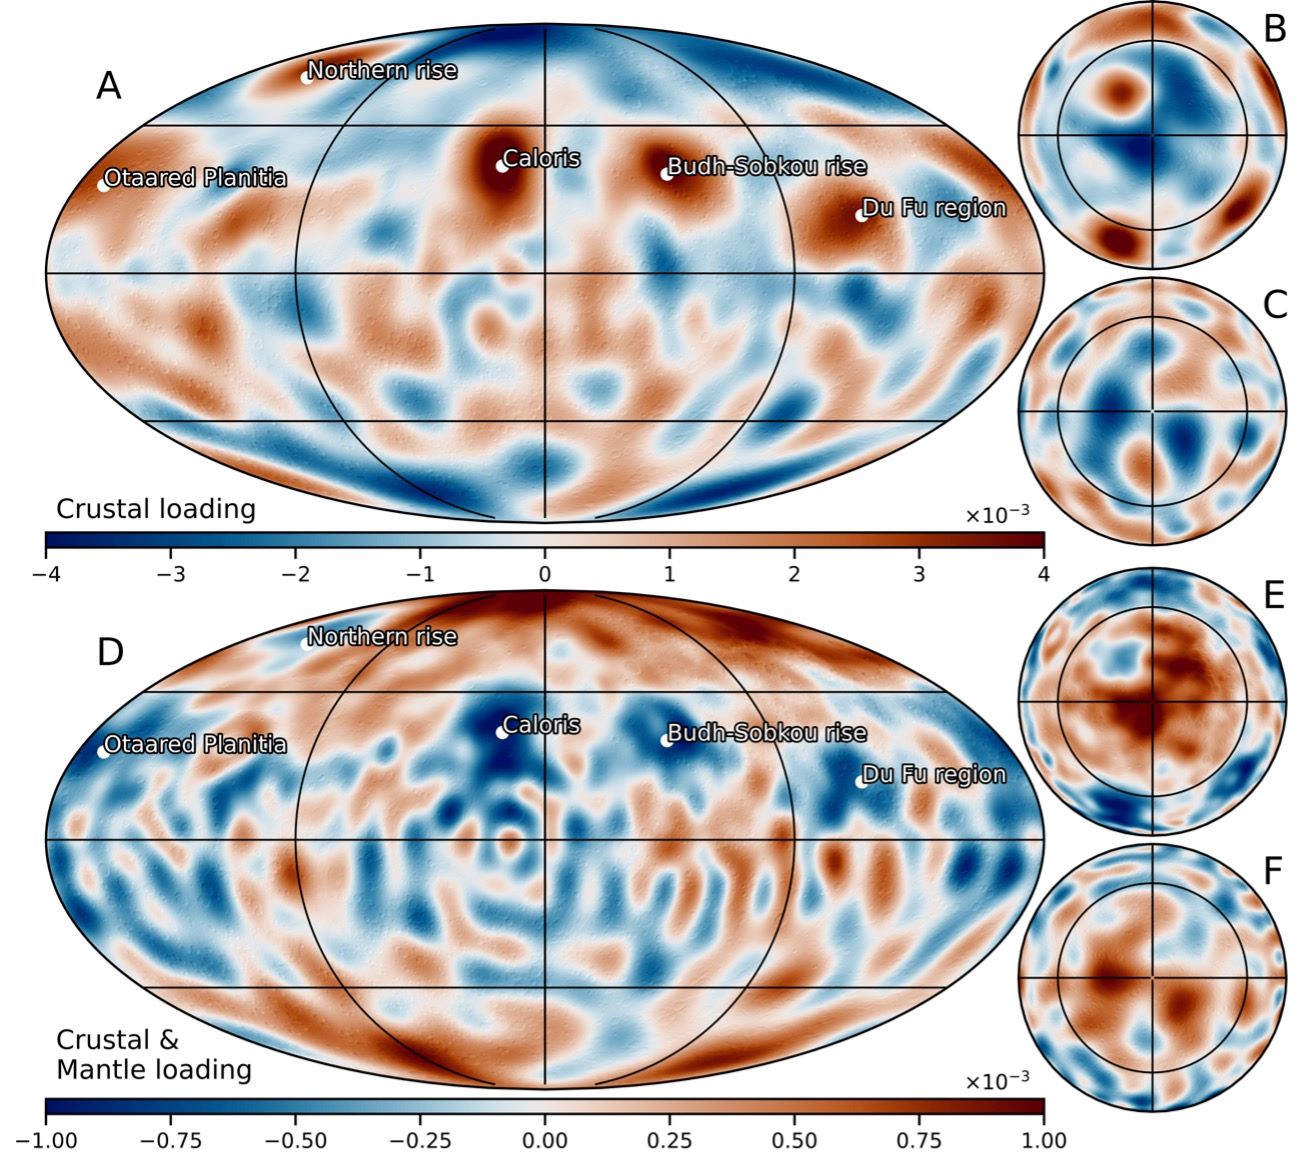
Fig. 2: Membrane-flexural strains considering crustal loading (top) or a combination of crustal and mantle loading (bottom).
Results & conclusions:
Considering that all compressional landforms are associated with an individual fault whose displacement is represented by the relief of the overlying ridge, we obtain an average global strain of 3.4±1.8×10⁻³ and contraction of 8.3±4.3 km, consistent with previous work (Fig. 1A, [3]). For our preferred approach using primary landforms, strain and contraction are decreased to 2.6±1.3×10⁻³ and 6.3±3.2 km (Fig. 1C). Even in this conservative case, the global contraction recorded in the cratered terrain of 6.6 km is markedly higher than ~1.2 km estimated when neglecting wrinkle ridges [2].
Tectonic strain exhibits prominent lateral variation, with regions experiencing near-zero strain, while others recorded strains >10×10-3. There is a general lack of significant compressional tectonics in the northern and Budh-Sobkou rises as well as the Caloris, Otaared, and Du Fu regions. Long-wavelength mantle support predicts uplift and extension in these regions, thereby providing an explanation for the local tectonic strain deficit (Fig. 2D). A substantial fraction of the flexural uplift at these locals must either pre-date or have occurred concurrently to global contraction, early in Mercury’s geologic history. Tilted crater floors is some of these regions imply uplift and global contraction at <4.1 Ga [7]. The uplift preservation suggests long-standing thermal/compositional mantle anomalies supporting topography or crustal underplating.
Other regions with a tectonic strain excess/deficit can also be partly explained by local deformation of the lithosphere, and this indicates that membrane-flexural strain can counteract contraction as well as add to it. In the northern smooth plains, the mantle support model predicts prominent membrane-flexural compression (Fig. 2). Although such compression would partially contribute to the overconcentration of wrinkle ridges and the associated regional strain, completely neglecting the compressional tectonics in this region would underestimate the contractional strain. Thus, future work must consider membrane-flexural strains and mantle support as an important contribution to Mercury’s tectonic record.
[1] Hauck S.A. et al. (2004) EPSL, 222. [2] Watters T.R. (2021) Nat. Com., 2. [3] Byrne P.K. et al. (2014) Nat. Geo., 7. [4] Klimczak, C. et al. (2025) EPSL, 658. [5] Abadi M. et al. (2016) 12th USENIX Conference. [6] James P.B. et al. (2015) JGR:Planets, 120. [7] Zuber M.T. et al. (2012) Science 336.
How to cite: Broquet, A. and Andrews-Hanna, J. C.: Mercury's geodynamic and tectonic history, EPSC-DPS Joint Meeting 2025, Helsinki, Finland, 7–13 Sep 2025, EPSC-DPS2025-489, https://doi.org/10.5194/epsc-dps2025-489, 2025.