

- Planetary Environmental and Astrobiological Research Laboratory (PEARL), School of Atmospheric Sciences, Sun Yat-sen University, Zhuhai, China. (qingzhang.mars@gmail.com)
Introduction
Exposed to the harsh space environment, the surface of dwarf planet Ceres is gradually altered due to space weathering. Dawn mission’s investigation reveals that the geologically young impact craters on Ceres exhibit spectrally blue-sloped materials, while the old terrains are spectrally red-sloped, suggesting a possible reddening effect by space weathering [1, 2]. However, the mechanism for the slope variation remains a subject of discussions [3, 4]. Here, we present the evidence of optical effects of space weathering on Ceres based on the spectral observations from Dawn mission.
Data and Methods
The Dawn spacecraft mapped the surface composition of Ceres with its Framing Camera (FC), Visual and Infrared Spectrometer (VIR), and Gamma Ray and Neutron Detector (GRaND) [5]. Here, we calculated the 965/438 nm value to characterize the visible/near-infrared (VNIR) slope variation with the FC data. To identify the weak spectral variations of the widespread ~2.7 μm absorption feature in the VIR data, we performed Gaussian fit to improve the sensitivity.
Results and discussion
The 2.7 μm absorption center shift due to space weathering: the narrow ~2.7 μm absorption band is attributed to the stretching vibration of O-H [6], centered at 2.728-2.730 μm for most of Ceres’ surfaces. However, some regions have the band center at 2.723-725 μm, shifted shortward by ~5 nm compared to the nearby regions (Fig 1b and 1e). The spectral ratio confirms the variation in the 2.7 μm absorption center (Fig 1c and 1f). These “blue shifted” regions are mainly distributed on the walls of some young and/or small craters, some of which were interpreted as being associated with slumping materials, such as in Haulani crater [2].
The observed 2.7 μm band center variations could be linked to the differences in phase angle [7], surface composition [8], and space weathering [9, 10]. The observational geometry variations were eliminated with photometric correction for VIR data. Previous studies show that the OH stretching band center varies with the Mg/(Mg+Fe): the substitution of Mg by Fe in phyllosilicates causes the band center to shift towards longer wavelengths [8]. If the observed band center variations are attributed to the heterogeneous composition between surface and subsurface materials, the similar wavelength shift should also occur in the crater floor and ejecta regions, which is not noticed. Therefore, the most likely explanation for the observed wavelength shift is space weathering. Several laboratory studies showed that space weathering could induce the 2.7 μm band center shift towards longer wavelengths [9, 10], and such a shift is compatible with what we observed on Ceres. In addition, the “blue shifted” regions always correlate with the relatively steep regions, which favors mass wasting to expose the less weathered materials underneath.
Implication for the spectral slope variation: for those regions with 2.7 μm absorption centered at relatively short wavelengths, presumably representing relatively fresh materials, the band center shows a correlation with the spectral slope (Fig 2). This suggests that the freshest Ceres’ materials may exhibit a relatively red slope in VINR, and initially, gradually become bluer due to space weathering. Afterwards, the shift of 2.7 μm band center stops at ~2.728-2.730 μm, while the VNIR slope continues to evolve from blue to red with surface exposure age, consistent with previous observations [1, 2]. These observations suggest that the effect of space weathering on the spectral slope of Ceres’ surface materials may be not monotonically from blue to red. Instead, freshly exposed surfaces initially become bluer at a short time scale, then the bluish materials are weathered into reddish materials. Further investigations will constrain other potential factors that may affect the VNIR slope, and make comparisons with laboratory and/or orbital observations of other objects to reveal the mechanisms of space weathering on Ceres.
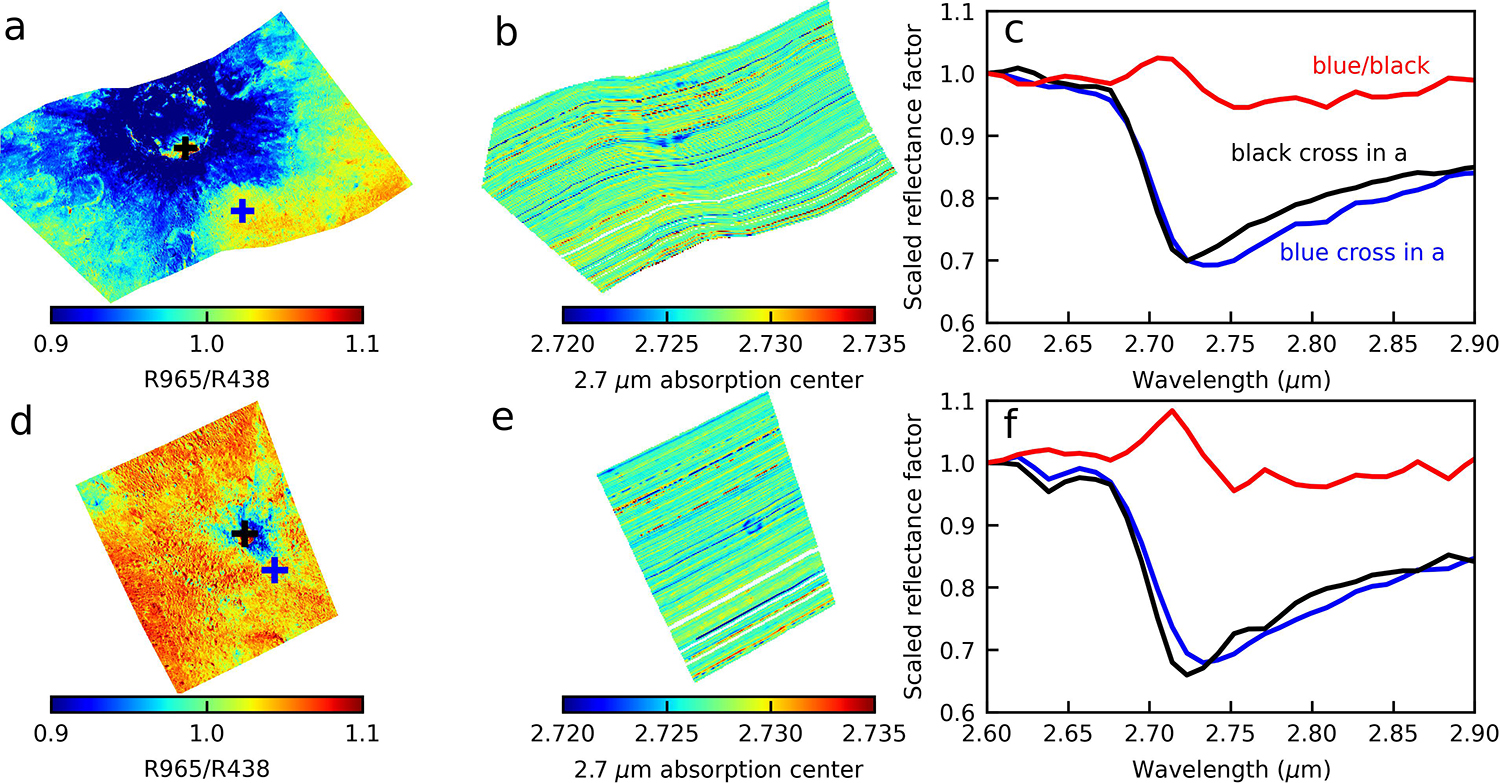
Fig.1 (a) and (b) are visible/near-infrared slope and 2.7 μm absorption center maps of Haulani crater, respectively. (c) Example spectra of absorption center at a shorter wavelength (black) and at a longer wavelength (blue) and their ratio (red). (d), (e) and (f) are another example in Braciaca crater region.
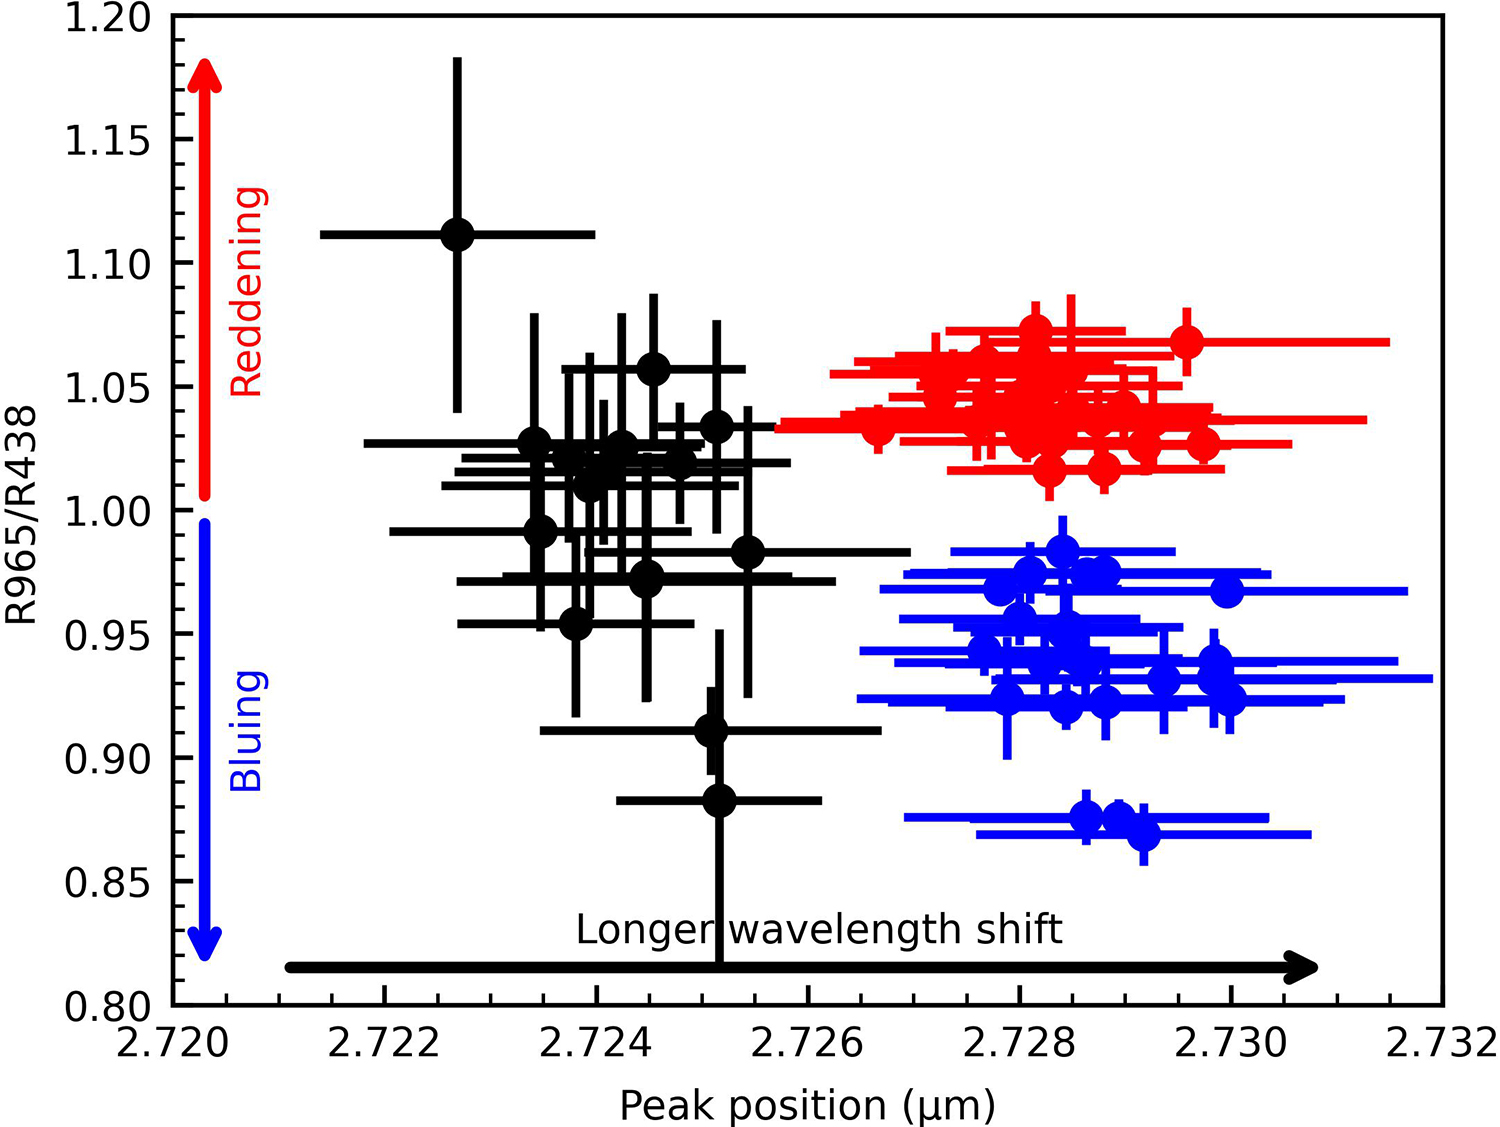
Fig.2 Measured absorption center of 2.7 μm band versus VNIR slope. The black scattered symbols mark the regions with 2.7 μm absorption center at shorter wavelengths. The blue symbols mark those with the 2.7 μm absorption centered at longer wavelengths and the 965/438 nm ratio less than 1. The red symbols mark those with the 2.7 μm absorption centered at longer wavelengths and the 965/438 nm ratio greater than 1.
References. [1] Nathues, A., et al. (2016). PSS, 134, 122-127. [2] Schmedemann, et al. (2016). GRL, 43(23), 11-987. [3] Stephan, K., et al. (2017). GRL, 44(4), 1660-1668. [4] Schröder, S. E., et al. (2021). Nature Communications, 12(1), 274. [5] Russell, C.T., and Raymond, C.A. (2011). Space Sci Rev, 163, 3–23. [6] Ammannito, E., et al. (2016). Science, 353(6303), aaf4279. [7] Rubino, S., et al. (2022). Icarus, 376, 114887. [8] Bishop, J. L., et al. (2008). Clay minerals, 43(1), 35-54. [9] Lantz, C., et al. (2015). Astronomy & Astrophysics, 577, A41. [10] Le Pivert-Jolivet, et al. (2023). Nature Astronomy, 7(12), 1445-1453.
How to cite: Zhang, Q. and Li, J.-Y.: Space weathering on Ceres: insight from Dawn’s spectral analysis, EPSC-DPS Joint Meeting 2025, Helsinki, Finland, 7–12 Sep 2025, EPSC-DPS2025-570, https://doi.org/10.5194/epsc-dps2025-570, 2025.