

- School of Earth and Space Sciences, University of Science and Technology of China, Hefei, China
Introduction
Mars does not have a global dipole magnetic field as is the case for Earth, but it possesses localized remanent magnetic fields originating in the Martian lithosphere, which are universally accepted to have been generated by an ancient core dynamo. Satellite measurements over the past few decades have provided the necessary data for modeling these crustal fields. The most widely used crustal magnetic field models include the Equivalent Source Dipole (ESD) model and the Spherical Harmonic (SH) model.
Data Sets and Data Selection
Mars Global Surveyor (MGS) operated in Martian orbit from 1997 to 2006, providing magnetic field measurements during two distinct mission phases: the aerobraking and science phase orbit (AB/SPO, 1997-1999) with elliptical orbits, and the mapping phase orbit (MPO, 1999-2006) with near-circular orbits at approximately 400 km altitude. MAVEN (2014–present) and Tianwen-1 (2021–present) continue to operate in elliptical orbits, conducting magnetic field measurements at lower altitudes.
A key challenge in crustal field modeling is minimizing external field interference associated with solar wind interactions with Mars. Langlais et al. (2019) selected MPO datasets with minimal deviation from the mean to construct a preliminary model, and excluded MAVEN datasets with correlation coefficients below 0.4 when compared to the extrapolated field of the preliminary model. Gao et al. (2021) selected MAVEN datasets based on upstream solar wind conditions, retaining orbits when the mean interplanetary magnetic field (IMF) magnitude is below 2.6 nT. Since mean-based criteria for near-circular orbits are physically less reliable than upstream solar wind criteria for elliptical orbits, we decided to use only elliptical orbit data, refine the quiet-period identification method, and incorporate updated MAVEN and Tianwen-1 observations to develop a new crustal field model.
We utilized datasets from MGS during AB/SPO phase (1997-1999), MAVEN (2014-2024), and Tianwen-1 (2021-2023), with the following selection criteria applied to constrain the datasets:
- The bow shock crossings of MAVEN from 2014 to 2022 were identified using the dataset provided by Wedlund et al. (2022), while those for other orbits were manually determined by examining magnetometer measurements. Quiet orbits were selected based on specific criteria: solar wind duration exceeding 0.5 hours, IMF strength below 3 nT, IMF fluctuation rate under 0.3 nT/s, electron density below 0.3 cm⁻³, and solar wind dynamic pressure below 6 nPa. For MGS and Tianwen-1, which lack electron density and dynamic pressure measurements, only the IMF criteria were applied. Only periapsis data from these quiet orbits were retained. Since the operational periods of MAVEN and Tianwen-1 overlap, if one spacecraft detected quiet solar wind conditions within a two-hour window, the periapsis data from the other spacecraft were also retained.
- Due to greater solar wind interference on the dayside, we exclusively utilized data acquired below 350 km altitude on the dayside and below 500 km on the nightside.
- A 60-second moving average was applied to suppress high-frequency noise.
- Following the method described in Langlais et al. (2019) Appendix B, we performed data selection along orbits with increased sampling density in regions exhibiting strong magnetic field gradients or at lower altitudes.
Finally we obtained 0.38 million data points of the field vector, 10% for model assessment and 90% for model construction.
Model Results
In this study, we employ the ESD modeling approach, which imposes less stringent requirements on the spatial uniformity of datasets. Then we used the ESD-derived spatially uniform magnetic field data to construct an SH model, enabling extrapolation to the surface. The calculated field distributions are shown in Figure 1.
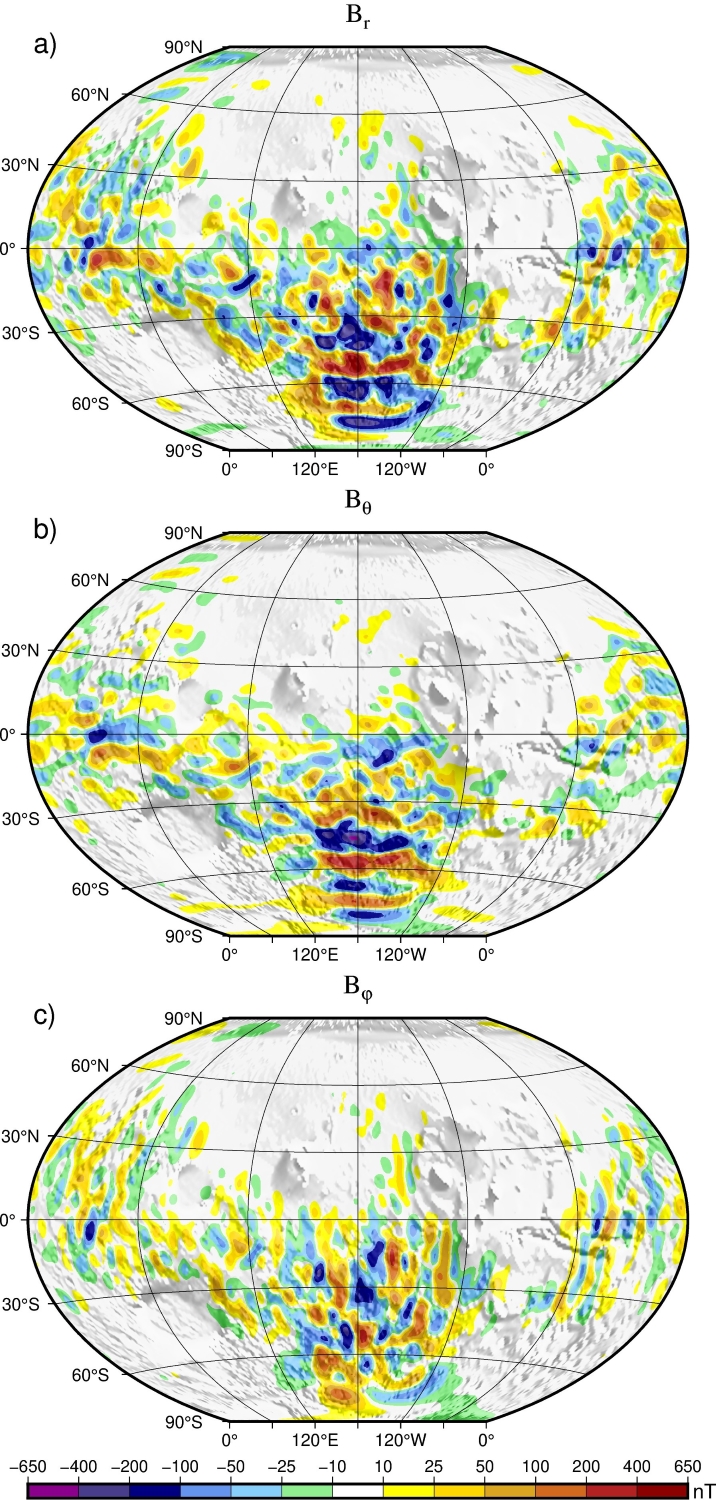
Figure 1. Maps of the Martian magnetic field calculated by our SH model at an altitude of 200 km. (a) Br, (b) Bθ , (c) Bφ .
The model performance was evaluated using residuals between the assessment dataset and model predictions. As shown in Figure 2, our model demonstrates superior fitting performance compared to previous studies, indicating that the methodological improvements have enhanced model quality.
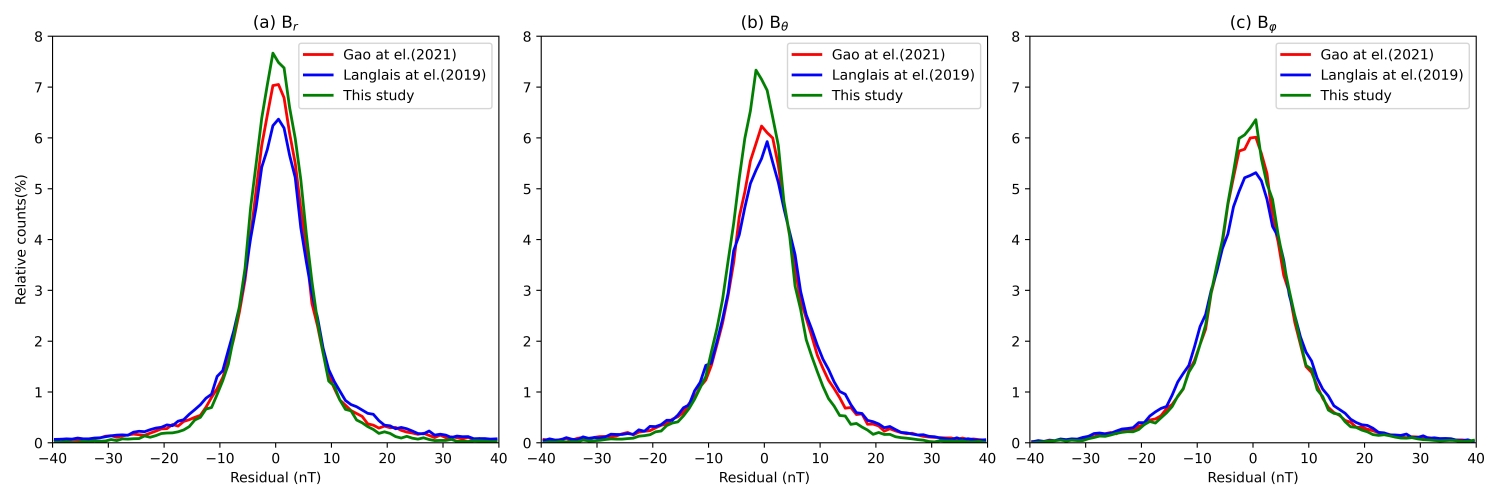
Figure 2. Residual distribution of the Langlais et al. (2019) model, the Gao et al. (2021) model, and this model for the assessment datasets.(a) Br, (b) Bθ , (c) Bφ .
Subsequent research will further refine the solar wind selection parameters to enhance model performance, and will consider incorporating relevant studies on the Martian ionospheric current system to optimize the quiet data selection method.
How to cite: Wanqiu, F., Long, C., and Yuming, W.: Modeling the Martian Crustal Magnetic Field Using Data from MGS, MAVEN, and Tianwen-1, EPSC-DPS Joint Meeting 2025, Helsinki, Finland, 7–12 Sep 2025, EPSC-DPS2025-572, https://doi.org/10.5194/epsc-dps2025-572, 2025.