
 1,1,2,1,1,1
- 1Basque Country University (UPV-EHU), Analytical Chemistry, Spain (fernando.alberquilla@ehu.eus)
- 2Ikerbasque, Basque Foundation for Science, Bilbao, Spain.
The growing availability of hyperspectral data from planetary missions ranging from CubeSats to flagship programs has led to many studies aiming to infer surface mineralogy through remote sensing techniques. The Moon Mineralogical Mapper (M³) aboard Chandrayaan-1 provides visible and near-infrared data (430–3000nm) at 140 m/pixel resolution and has been widely used to infer lunar surface composition [1]. A common strategy involves applying unmixing models, often Non-Negative Matrix Factorization (NNMF), to M³ images with varying reflectance and compositional properties, using laboratory reference spectra from the RELAB database for comparison [2,3]. These spectra from standard materials represent typical lunar minerals such as olivine, pyroxenes, plagioclase, iron-titanium oxides, and volcanic glasses.
This study first focuses on reproducing previous efforts to estimate the lunar mineralogy, applied to the Apollo 17 landing site (Figure 1). Then it shifts toward highlighting the methodological uncertainties involved in interpreting hyperspectral imagery using unmixing models in remote sensing applications.
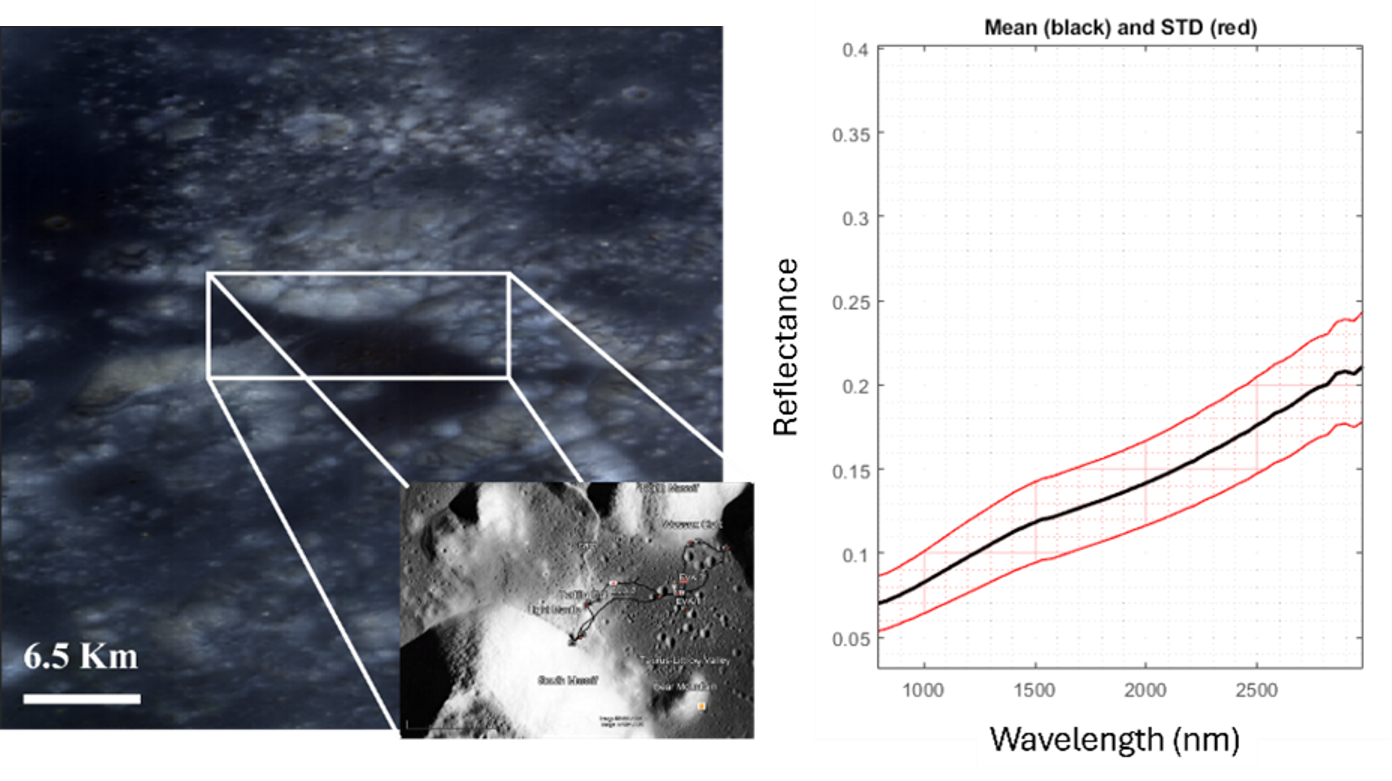
Figure. 1 (Top)Taurus-Littrow Valley. (Bottom) Mean (dark) reflectance spectrum and standard deviation (red) of the Taurus-Littrow Valley hyperspectral image.
In the initial stage, a spatial binning with 8X8 window was applied to reduce the signal-to-noise ratio of the image. Principal Component Analysis (PCA) was then used to reduce data dimensionality and highlight surface variations. Initially applied on the binned image, PCA revealed that the first component explained 98% of the variance, mainly reflecting topography and illumination differences. To minimize these effects and enhance chemical information, the first derivative of the spectral data was applied (same preprocessing was applied to reference spectra, Figure.2). A second PCA was then performed to determine the chemical rank of the matrix, which suggested that NNMF should be carried out with 3–4 principal components.
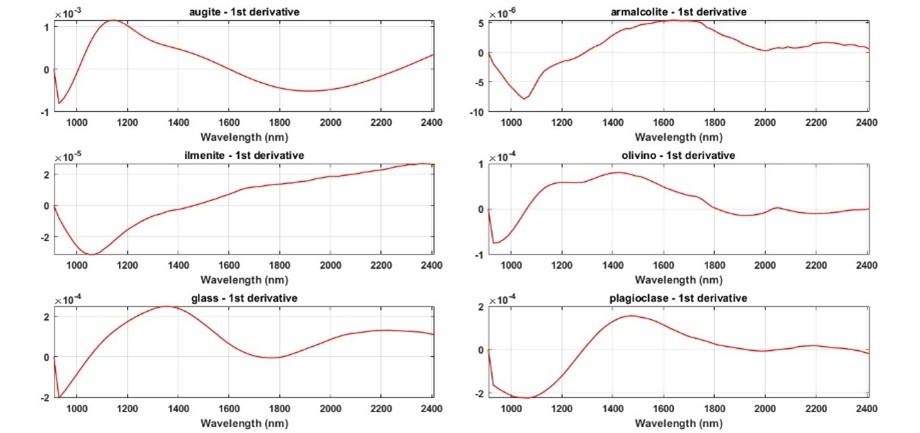
Figure. 2 First derivative of reference spectra from RELAB.
NNMF was performed to unmix and extract surface components, possibly revealing features that may correspond to geochemical variations. In this final stage, it was assumed that three principal components could be present within the image. Figure. 3 shows the spatial distribution of the combination of these three components (top), along with the corresponding “pure” spectra (bottom) extracted by the model after applying NNMF using endmember initialization and non-negativity constraints [4] applied to the contributions. Commonly, when these results were compared with preprocessed spectra from RELAB, compounds such as pyroxenes, olivine, volcanic-glass, may be identified (Figure. 3), with acceptable lack of fit and a total variance explanation exceeding 99%.
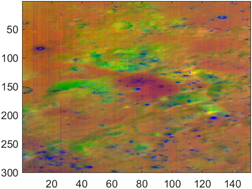
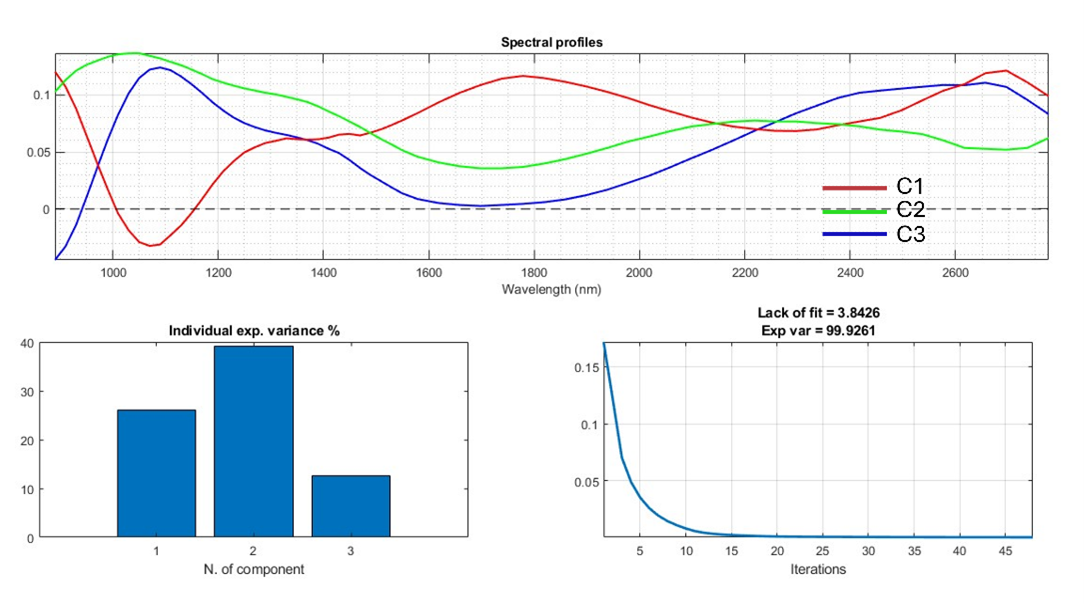
Figure. 3 False RGB showing the concentrations of the three main components after applying NNMF model using endmember initialization and non-negativity constraints.
However, while spectral unmixing models have been widely applied in remote sensing for decades, limited attention has been paid to the intrinsic ambiguities they involve. Although simpler ambiguities (such as those related to scale or sign) can often be addressed using basic constraints like non-negativity, rotational ambiguity remains a significant and underexplored source of uncertainty. For these reasons, it is important to highlight that solutions derived from NNMF (commonly referred to as Multivariate Curve Resolution with non-negativity constraints) depend considerably on the degrees of freedom allowed by the optimization algorithm (e.g., Alternating Least Squares, ALS). To visualize and quantify this issue, feasibility plots were employed through MCRbands and FACpack (Figure. 4), which map the set of all admissible solutions within the NNMF framework [5-7].
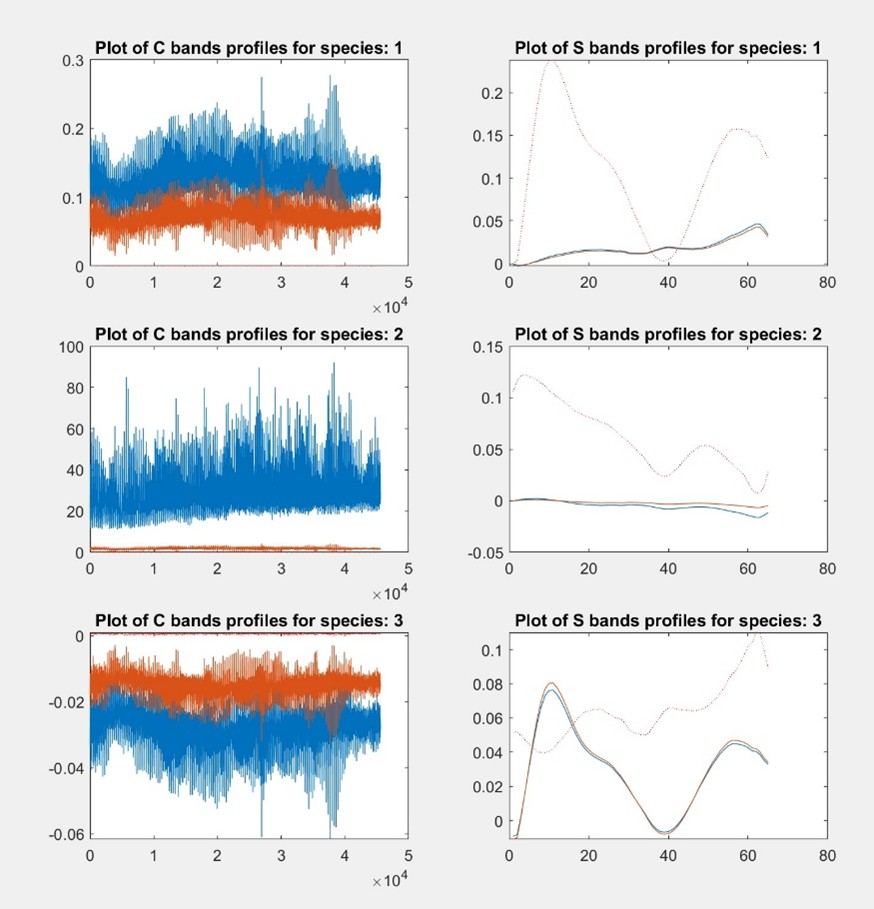
Figure. 4 Feasibility plots for the three components calculated. Right, the contributions and left, the spectral profiles obtained. Contributions: Blue and red represents the solution obtained and the plausible solution that could also be considered as optimal.
Figure 4 shows that any space covered between those solutions could be considered feasible. On the left, the spectra calculated and the feasible spectra both indicate a strong lack of specificity and uniqueness in the solutions, clearly stating that the model is not stable enough to be deemed an optimal solution. The extent of solution variability reveals that differences between the acceptable solution and real solutions for the considered species are considerable due to rotational freedom. In conclusion, we emphasize the importance of a more rigorous consideration of ambiguity in remote sensing applications. Additionally, the presence of regolith and volcanic rocks on the lunar surface makes it unlikely that a 140 m/pixel represents a pure mineral spectrum [8].
Keywords: Remote sensing, Chemometrics, Unmixing models, Near Infrared.
Acknowledgements: Work supported through the PAMMAT project: “Alteration processes in Mars and Moon Meteorites, and Terrestrial Analogues at different environments: Mars2020, Rosalind Franklin and Returned Samples from Mars and Moon” (Grant No. PID2022-142750OB-I00), funded by the Spanish Agency for Research (through the Spanish Ministry of Science and Innovation, MCIN, and the European Regional Development Fund, FEDER).
References:
[1] R. O. Green, C. Pieters, P. Mouroulis,et al. (2011). Journal of Geophysical Research: Planets, 116 (E10) (E00G19).
[2] Adams, J. B., & McCord, T. B.(1971). Optical properties of mineral separates, glass, and anorthositic fragments from Apollo mare samples. In Proceedings of the Lunar Science Conference, vol. 2, p. 2183.
[3] Reflectance Experiment Laboratory (RELAB), 2008. Brown University, Providence
[4] De Juan, A., & Tauler, R.(2006). Multivariate curve resolution (MCR) from 2000: progress in concepts and applications. Critical reviews in analytical chemistry, 36(3-4), 163-176.
[5] Jaumot, J., & Tauler, R.(2010). MCR-BANDS: A user friendly MATLAB program for the evaluation of rotation ambiguities in Multivariate Curve Resolution. Chemometrics and Intelligent Laboratory Systems, 103(2), 96-107.
[6] Jaumot, J., Gargallo, R., De Juan, A., & Tauler, R.(2005). A graphical user-friendly interface for MCR-ALS: a new tool for multivariate curve resolution in MATLAB. Chemometrics and intelligent laboratory systems, 76(1), 101-110.
[7] Sawall, M., Kubis, C., Selent, D., Börner, A., & Neymeyr, K.(2013). A fast polygon inflation algorithm to compute the area of feasible solutions for three‐component systems. I: concepts and applications. Journal of Chemometrics, 27(5), 106-116.
[8] Cavalli, R. M. (2023). Spatial validation of spectral unmixing results: A systematic review. Remote Sensing, 15(11), 2822.
How to cite: Alberquilla, F., Gorla, G., Amigo, J. M., Aramendia, J., Martínez Arkarazo, I., Vazquez de la Fuente, I., Población, I., Coloma, L., Arana, G., Castro, K., and Madariaga, J. M.: Understanding the boundaries of “Spectral Unmixing”: Considerations for reliable mineralogical interpretation in remote sensing and space missions., EPSC-DPS Joint Meeting 2025, Helsinki, Finland, 7–12 Sep 2025, EPSC-DPS2025-705, https://doi.org/10.5194/epsc-dps2025-705, 2025.