
 1,3,
1,3,- 1University of Michigan, United States of America (hsingwel@umich.edu)
- 2University of Auckland, New Zealand
- 3Case Western Reserve University, Cleveland, OH, USA
Motivation:
The James Webb Space Telescope (JWST) has observed numerous outer solar system minor planets, including Trans-Neptunian Objects (TNOs), Centaurs, and Neptunian Trojans (NTs). One significant result is that most of their spectra can be classified into three primary categories (Pinilla-Alonso N., et al., 2025):
-
Bowl-type surfaces dominated by water ice features,
-
Double-dip surfaces with strong CO₂ absorption, and
- Cliff-type surfaces characterized by very strong absorption beyond 3 µm.
However, these observations are limited to the brightest members of these populations. Many objects remain too faint for similar spectral observations with current facilities, raising the possibility that some outliers may not be true anomalies but instead belong to smaller, under-sampled groups.
This study explores whether the spectral types of these objects, particularly NTs, can be inferred using multi-band photometry. This approach requires shorter exposure times on less competitive facilities or could be achieved through large-scale multi-color sky surveys.
Method:
We employed Principal Component Analysis (PCA) to condense the full JWST/NIRSpec spectral range (0.7–5 µm) into a single value, PC1, for each TNO and NT. As the first principal component, PC1 retains most of the spectral information and serves as a proxy for the full spectrum.
Additionally, we derived the optical spectral slope (S′) and the near-IR slope (SIR1). Optical slopes can be measured with standard photometric systems (e.g., SDSS gri or Johnson-Cousins BVR filters), while SIR1 values (derived from the 0.7–1.2 µm range) can also be obtained from multi-band photometry, such as SDSS r, i, and z filters. Figure 1 demonstrates that r, i, and z photometry reliably follows the near-IR spectral slope.
Result:
We plotted PC1 against S′ and SIR1, as shown in Figure 2. Our findings indicate the following:
-
PC1 alone is sufficient to classify objects into the three main spectral categories.
- PC1 correlates strongly with S′, enabling the classification of objects based on S′ using the following thresholds:
-
S′ ≤ 17%/1000 Å: Bowl-type,
-
17%/1000 Å ≤ S′ ≤ 24%/1000 Å: Double-dip type,
-
S′ ≥ 24%/1000 Å: Cliff-type.
-
While SIR1 is less effective in distinguishing Bowl and Double-dip types, it can differentiate Cliff-types and reveals that “Bowl” objects may be further divided into steep and shallow near-IR subgroups based on SIR1 = 3.5%/1000 Å. Most NTs exhibit steep near-IR slopes, with 2006 RJ103 being an exception.
Figure 2c illustrates the relationship between S′ and SIR1, analogous to color-color diagrams (e.g., g-r vs. r-J in Fraser et al. 2023, or g-r vs. r-z in Bernardinelli et al. 2025). This schema maps optical/near-IR colors to spectral groups, aligning with the near-IR bright (NIRB) and near-IR faint (NIRF) categories in previous studies. We predict that Bowl-types correspond to NIRBs, Cliff-types to NIRFs, and Double-dips represent the bluer subset of NIRFs.
Conclusion:
This study presents a practical schema for classifying spectral types of TNOs and NTs using multi-band photometry. This method provides a viable approach for characterizing faint outer solar system objects in ongoing and future surveys.
[1] Pinilla-Alonso N., et al., 2025, NatAs, 9, 230. doi:10.1038/s41550-024-02433-2
[2] Bernardinelli, P. H., et al. 2025, arXiv e-prints, arXiv:2501.01551,788
[3] Fraser, W. C., et al. 2023, PSJ, 4, 80,826 doi: 10.3847/PSJ/acc844827
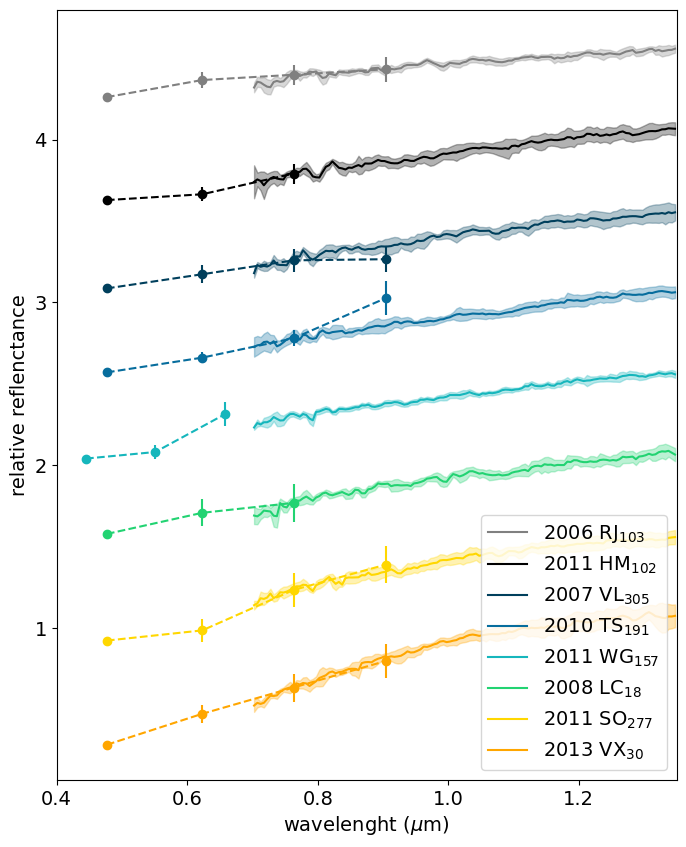
Figure 1: Joint optical photometry and NIRSpec spectra of eight Neptunian Trojans (NTs). Each color represents a different NT, with circular markers indicating the central wavelengths of various optical bands (from shorter to longer wavelengths: g, r, i, z, or B, V, R for 2011 WG157). Error bars show 1-sigma uncertainties for the optical photometry, while shaded regions indicate 1-sigma uncertainties for the NIR spectra.
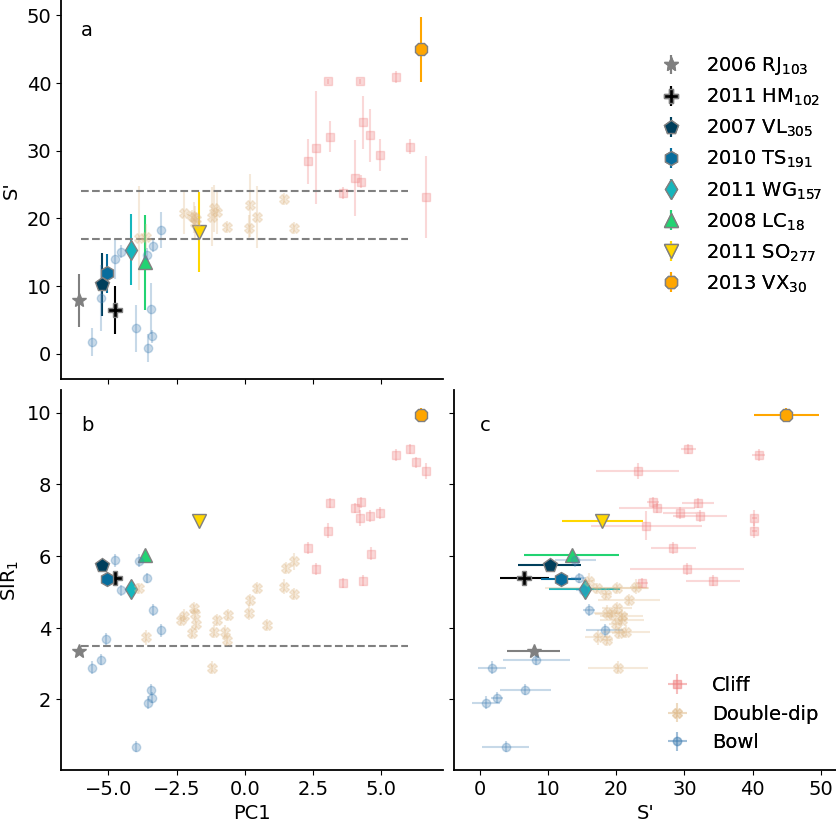
Figure 2: PC1 versus optical slope (S′) and near-IR slope (SIR1) for Neptunian Trojans (NTs) and TNOs, with each NT represented by a unique colored marker. In the upper left panel (a), dashed lines at S′ = 17 and 24 %/1000 Å indicate the proposed boundaries separating the three primary spectral groups. In the bottom left panel (b), a dashed line at SIR1 = 3.5 %/1000 Å marks the proposed division between shallow and steep near-IR slope subtypes within the Bowl-type objects.
How to cite: Lin, H.-W., Markwardt, L., Gerdes, D., and Adams, F.: Mapping Multi-Band Photometry to the Spectral Taxonomy of Outer Solar System Minor Planets, EPSC-DPS Joint Meeting 2025, Helsinki, Finland, 7–12 Sep 2025, EPSC-DPS2025-771, https://doi.org/10.5194/epsc-dps2025-771, 2025.