
 1,2,2,2,2,3,2,2,4,4,3
- 1Center of Studies and Activities for Space, CISAS, G. Colombo, University of Padova, via Venezia 15, 35131 Padova, Italy
- 2Istituto Nazionale di Astrofisica (INAF) – Osservatorio Astronomico di Padova (OAPd), Vicolo dell’Osservatorio n.5, Padova, Italy
- 3Istituto Nazionale di Astrofisica (INAF) - Osservatorio Astronomico di Arcetri, largo E. Fermi n.5, I-50125 Firenze, Italy
- 4LIRA, Université Paris Cité, Observatoire de Paris, Université PSL, Sorbonne Université, CNRS, CY Cergy Paris Université, F-92190 MEUDON, France
Introduction. The origin of the Martian moons remains a debated topic within the scientific community. Two leading scenarios are commonly considered: the capture of an asteroidal object [1-2] and a giant impact between proto-Mars and a large body [3-5]. The debate arises from the red-sloped spectra, and the primitive and dark appearance of Phobos [6-15], resembling a D-, P- or T-type asteroid [16]. This is contradicted by the orbital parameters [17], the MIR/TIR spectra [18-20] and a possible presence of a 1 µm absorption [6], all suggesting an impact origin. Another debated topic is Phobos’ color dichotomy that characterizes the satellite surface, first described by [6]. The blue unit is associated to the eastern rim of Stickney crater (9 km across), while the red unit characterizes the rest of the surface. The blue unit has a higher reflectance in the VIS [21]. Since the latter is prominent near the impact site, it is hypothesized to consist of ejected material from Stickney. In contrast, the red unit is an older, space weathered material.
In this work we have analyzed three MeX/OMEGA (Observatoire pour la Minéralogie, l’Eau, les Glaces et l’Activité, [22]) datacubes in the spectral range 0.4 µm - 2.5 µm. The aim is to perform detailed spectroscopic analysis to understand composition and mineralogy of Phobos.
Methods and Results. The data underwent a geometric and photometric correction. For the latter, we used the Lommel-Seeliger Function, a simplified photometric law from the Hapke Theory [23] which performs very well for surfaces dominated by single scattering (i.e. dark surfaces) [11,13].
Regions of Interest (ROIs) were identified across the three datacubes, to analyze the blue and red unit spectral properties as well as to describe the transition between them.
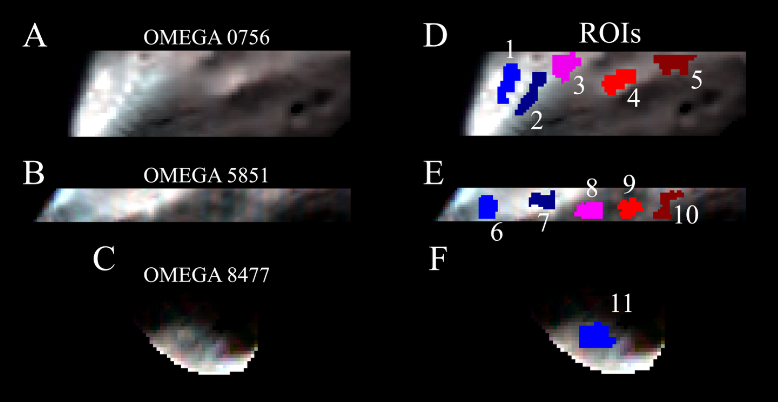
Figure 1: Set of ROIs identified across the three datacubes.
In Fig.1D-E-F the locations of all identified ROIs are shown. As illustrated FIG.1A, the cube 0756 captured a portion of the inner region of the Stickney crater where we identified the ROI 1 and the blue unit close to the rim of Stickney, where ROI 2 was selected. The remaining area is occupied by the red unit. ROI 3-4-5 were identified progressively farther from the blue unit to examine spectral transitions.
As seen in Fig.1B, cube 5851 captures a larger portion of Stickney interior, where ROI 6-7 have been identified, while ROI 8-9-10 have been selected with the same approach adopted for the ROI 3-4-5.
Finally, for orbit 8477 (Fig.1C) a single large ROI has been selected due to the considerable noise of this dataset.
In Fig.2 the mean extracted and normalized spectra are presented: it is possible to notice the gradual transition in slope from the blue unit spectra to the redder regions. The error bars account for both standard deviation and instrumental errors, while the gray bands are wavelength ranges where bad bands are present. The gradual spectral transition of Phobos suggests an increase degree of mixing between the blue and the red unit as we approach to the blue unit. In addition, one may notice the absence of strong absorption features, which makes difficult to diagnostic the mineralogy.
The only subtle absorption that we identified appears in ROI 2, near 1 µm. If confirmed, it would trace presence of olivine and pyroxene. However, this remains a tentative suggestion due to the instrumental decrease in sensitiveness at this wavelength range.
In Fig.3 we present the best match with asteroid spectra. While the blue unit seem to be consistent with the T-/P- type of asteroid, the transition/red unit is best fitted with the D-type asteroid.
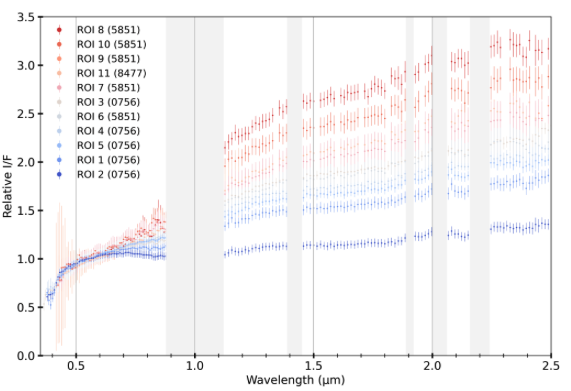
Figure 2: Set of mean spectra extracted.
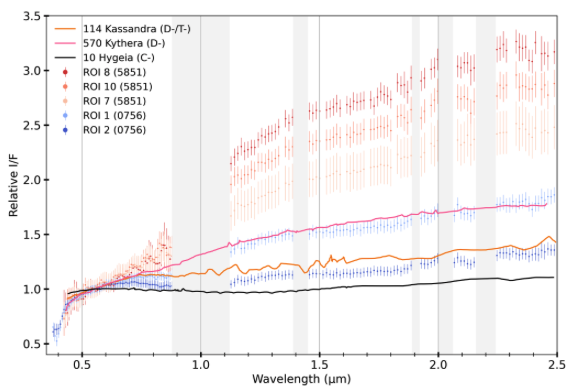
Figure 3: Comparison with mean Tholen spectra [26].
The meteorite comparison supports the asteroid comparison’s results (see Fig.4). Indeed, the Tagish Lake (TL) meteorite, a D-type asteroid analog [25], matches the Phobos transition/red unit. For the blue unit, the best analog found include Kaidun, a Phobos analog by [27], the Murchison fusion crust, also proposed by [9] as a Phobos analog, and cold Bokkeveld. Such meteorites consist of carbonaceous chondrites, i.e. primitive material.
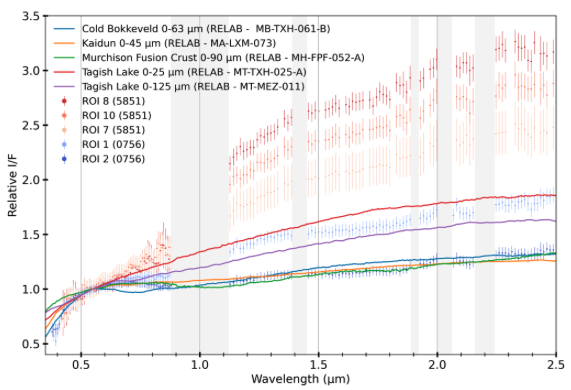
Figure 4: Comparison with meteorites spectra.
Finally, we present the comparison with results present in the literature (see Fig.5). While the red unit of [6] and [11] are consistent with our dataset, the blue unit of [11] seems to match the transitional unit. This indicates that the ROI 2 mean spectra may be one of the bluest spectra of Phobos ever obtained.
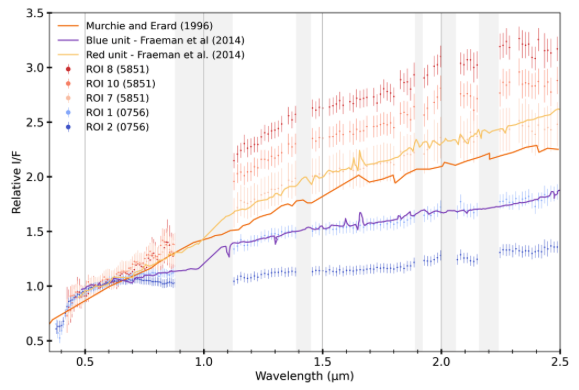
Figure 5: Comparison with relevant literature spectra.
References. [1] Singer, 2003, 6th Int. Conf. on Mars, page 3063; [2] Hansen, 2018 MNRAS, 475(2):2452–2466; [3] Craddock et al. (2011), Icarus, 211, 1150–1160; [4] Rosenblatt and Charnoz (2012), Icarus, 221, 806–815; [5] Hyodo et al. (2017), ApJ, 845, 125–132; [6] Murchie and Erad (1996), Icarus, 123, 63–86; [7]Rivkin, A et al. (2002), Icarus, 156, 64; [8] Pajola et al. (2012), MNRAS, 427, 3230; [9] Fraeman et al. (2012), J. Geophys. Res. Planets, 117; [10] Fraeman et al. (2014), Icarus, 229, 196; [11] Pajola et al. (2018), Planet. Space Sci., 154, 63; [12] Takir et al. (2022), Icarus, 371, 114691; [13] Fornasier et al. (2024), Astron. Astrophys., 686, A203; [14] Poggiali et al. (2022), MNRAS, 516, 465; [15] Wargnier et al. (2023), MNRAS, 524, 3809; [16] Bus, S. J. & Binzel, R. P. 2002, Icarus, 158, 146; [17] Jacobson et al. (2014), Planet. Space Sci., 102, 35; [18] Roush et al. (2000), Lunar Planet. Sci. Conf., 1598; [19] Giuranna et al. (2011), Planet. Space Sci., 59, 1308; [20] Glotch et al. (2018), J. Geophys. Res. Planets, 123, 2467; [21] Thomas et al. (2011), Planet. Space Sci., 59, 1281; [22] Bibring et al. (2004), Earth Space Planets, 1240, 37–49; [23]Hapke, 2012, Theory of Reflectance and Emittance Spectroscopy, Cambridge Univ. Press; [24] Acton et al. (1996), Planet. Space Sci., 44, 65; [25] Hiroi et al. (2001), Science, 293, 2234; [26] Tholen, D. J. 1984, PhD thesis, University of Arizona, USA; [27] Ivanov et al. (2004), Solar System Res., 38.2, 97–107;
How to cite: Beccarelli, J., Pajola, M., Munaretto, G., Lucchetti, A., Poggiali, G., Simioni, E., Tusberti, F., Rossi, C., Fornasier, S., Barucci, M. A., and Brucato, J. R.: Phobos 0.4 – 2.5 μm spectral analysis of the red and blue units through the MarsExpress/OMEGA dataset., EPSC-DPS Joint Meeting 2025, Helsinki, Finland, 7–12 Sep 2025, EPSC-DPS2025-787, https://doi.org/10.5194/epsc-dps2025-787, 2025.