Multiple terms: term1 term2
red apples
returns results with all terms like:
Fructose levels in red and green apples
Precise match in quotes: "term1 term2"
"red apples"
returns results matching exactly like:
Anthocyanin biosynthesis in red apples
Exclude a term with -: term1 -term2
apples -red
returns results containing apples but not red:
Malic acid in green apples
hits for "" in
Network problems
Server timeout
Invalid search term
Too many requests
Empty search term
SB12

We particularly encourage presentations on scientific results using data from past and present missions as well as abstract addressing the future exploration of Phobos and Deimos, including mission and instrument concepts and developments, and preparation studies for the upcoming JAXA’s Martian Moon eXploration (MMX) mission.
Session assets
The goal of the MMX mission is to determine the origin and the formation process of the two Martian moons (Kuramoto et al. 2022). Three years remote sensing observation of Phobos and Deimos (Nakamura et al .2021) will provide us mineralogical and compositional signatures of whole sphere of the moons and thus we will obtain strong constraints on the origin. Subsequent laboratory analysis of the returned samples from Phobos will terminate the long-standing problem of the origin of Martian moons.
In some cases, we can determine the origin based on only remote sensing observation. If Phobos has a high abundance of hydrous minerals, a high hydrogen concentration, a chondritic global chemical composition, and a reflectance spectrum similar to hydrous carbonaceous meteorites, then Phobos is made of primitive C or D-type asteroidal material. In this case, Phobos could be a captured asteroid coming from beyond Mars, or if it was formed by an asteroid impacting Mars, the impact would have been weak to maintain chondiritic composition.
The important scientific data to determine the origin of Phobos and Deimos are: global and local elemental abundances of Phobos (Laurence et al. 2019) with enough precision to distinguish chondritic or non-chondritic composition (including Martian components or not), the high resolution map of visible and near-infrared reflectance spectrra to explore the presence or absence of hydrated silicates on Phobos and Deimos (Barucci et al. 2021), and chemical, mineralogical and isotope composition of the returned samples to determine to determine whether Phobos is primordial solar system material or high-temperature heated processed material (Fujiya et al. 2021). If we succeed the remote sensing observations and return sample analyses, the origin and formation process of the Martian moons will be clarified within a few years from the sample return to the Earth expected in 2031.
References :
Barucci M.A. et al. (2021) Earth, Plan. and Space, 73, 211.
Fujiya W. et al. (2021) Earth, Plan. and Space, 73, 1.
Kuramoto K. et al. (2022) Earth, Plan. and Space, 74, 12.
Lawrence et al. (2019) Earth Space Science, 6, 2605.
Nakamura et al. (2021) Earth, Plan. and Space, 73, 227.
How to cite: Nakamura, T., Ikeda, H., Takeo, Y., Usui, T., Kuramoto, K., Working team, M. O., and Board, S.: MMX mission update and long-term operation plan in the whole mission period, EPSC-DPS Joint Meeting 2025, Helsinki, Finland, 7–13 Sep 2025, EPSC-DPS2025-22, https://doi.org/10.5194/epsc-dps2025-22, 2025.
The JAXA MMX (Martian Moon eXploration) mission will be launched in October 2026 to the Martian system to carry out three years observations of the Martian moons, and to bring back to Earth at least 10 g samples from Phobos. The primary goal [1] of the mission is to understand the origin of the Martian moons: Phobos and Deimos, for which two major hypothesis are still debated. Are the two satellites captured asteroids after the Mars formation ? Or are they results of a giant impact with Mars ? Laboratory analysis of returned samples will be key to answer these fundamental questions. The mission objectives in studying Martian moons are also to enlarge our knowledge of the Martian system and to constrain the processes of planet formation.
The onboard instruments [1] will allow the right selection of the two Phobos sampling site selection. The cameras (OROCHI, TENGOO and Cam-T) [2] will allow the safe selection for the landing sites, while the imaging spectrometer MIRS (MMX InfraRed Spectrometer) [3,4] and MEGANE (Mars-moon Exploration with Gamma rays and Neutrons) instrument [5] will be the key instruments for the compositional characterization, global chemical and mineralogical mapping, and to support the landing site selection.
At the arrival of the spacecraft into Mars system in 2027, MMX will observe Deimos by several fly-bys, and then it will be injected into Phobos co-orbit like a Martian Moon in orbit around Mars, in the so-called quasi-satellite orbits (QSOs). To obtain global mapping at different spatial resolutions with the cameras and MIRS, and to characterize the selected landing sites, the QSOs will be settled in the equatorial plane of Phobos with several decreasing altitude (High, Medium and Low), from 100km to 7km. The mapping at different resolutions by MIRS will be essential for a global characterization and evaluate the properties and geologic context of different materials to select the best landing sites. Observations at specific local times and phase angles will be also performed to study the surface temperature and its spatial and temporal variations. From these measurements, the surface thermal inertia of Phobos will be derived at the instrument spatial resolution. The multiple flybys of Deimos will allow to compare its surface composition to that of Phobos with observations at similar resolution.
The MIRS spectrometer [3,4], designed to accomplish the MMX’s scientific objectives, is a push-broom imaging spectrometer working in the spectral range 0.9 -3.6 µm. The measured spectral resolution is 21 nm up to 3.2 µm with SNR ≥ 100 in the region up to 3.2 µm. The instantaneous Field of View (iFoV) is 0.325-0.350 mrad, and the field of View (FoV) is +/-1.65°.
MIRS will characterize spectroscopically the global surface material distribution of Phobos at spatial resolutions better than 20 m, up to few meters at low altitude for the preselected landing sites and up to few cm for the two selected sampling sites. MIRS is expected to detect all possible present signatures (up to band depths of 3%) on the obtained spectra like anhydrous or hydrous silicate minerals, characterize the presence of water (ice) and to detect the presence of organic materials. The MIRS performances will allow to investigate on the composition like their aliphatic or aromatic nature, whether they are nitrogen-bearing or pure carbonate. MIRS will be able to measure the spectral radiance of the surface within the instrument footprint. Grain sizes and porosity will be constrained by thermal Inertia. Space weathering processes will be also investigated thanks to resolved spectral observations of small fresh craters and their ejecta. MIRS data associated with the on-board cameras and MEGANE instrument will give new insights on the surface characterization of these two moons. The unprecedent spatial resolution of MIRS will allow to search for heterogeneities that could be linked to Mars surface composition and it will allow to detect exogeneous material if present on the surface of Phobos. This will provide constrains on the transport mechanisms between Mars and the two moons and the eventually dichotomy between the sub and anti-martian hemispheres of Phobos.
MIRS will be used to support the selection of the two landing sites based on their grain size and composition, and will be able to observe during its descent phase down to an altitude of 400m. MIRS will be able to determine the surface composition of both Phobos and Deimos. This will allow us to decipher the origins of the two moons given that: i) the detection of phyllosilicates as well as of organics on their surface would imply that the origin of Phobos and Deimos is by a capture process, while ii) the detection of anhydrous silicates or spinels may suggest a high-temperature origin by impact, leading to a depletion of volatile elements and incorporation of Martian rocks (crust and mantle). In the assumption that Phobos formed in a giant impact, simulations [6] show that the impact could be much less energetic than the Moon-forming impact, with temperatures of the order of 2000 K. This temperature remains sufficiently high to produce a depletion in water, phyllosilicates and organic. Consequently a detection of presence of these materials (even in small quantities) by spectroscopy on the surface of Phobos will confirm the capture hypothesis.
High-accuracy laboratory analysis of volatile elements and isotopic ratios of returned samples from the two regions will give the final answer on the origin of Phobos.
Acknowledgements: MIRS is built at Paris Observatory in collaboration with CNES, four other French laboratories (LATMOS, LAB, OMP, IRAP), and close collaboration with JAXA and MELCO. MMX is developed and built by JAXA, with contributions from CNES, DLR, ESA and NASA.
References :
[1] Kuramoto K. et al. (2022) Earth, Plan. and Space, 74, 12.
[2] Kameda et al. (2021) Earth, Plan. and Space, 73, 218.
[3] Barucci M.A. et al. (2021) Earth, Plan. and Space, 73, 211.
[4] Barucci M.A. et al. (2025) Progress in Earth and Planetary Science, in press
[5] Lawrence et al. (2019) Earth Space Science, 6, 2605.
[6] Charnoz S. et al. (2025) Icarus, 434, 116462
How to cite: Barucci, M. A., Nakamura, T., Fornasier, S., Merlin, F., Beck, P., Doressoundiram, A., Gautier, T., Iwata, T., Poggiali, G., Sultana, R., Wargnier, A., and Yumoto, K.: To constrains the origin of Phobos and Deimos by MIRS/MMX imaging spectrometer , EPSC-DPS Joint Meeting 2025, Helsinki, Finland, 7–13 Sep 2025, EPSC-DPS2025-268, https://doi.org/10.5194/epsc-dps2025-268, 2025.
Introduction
The Martian Moon eXploration (MMX) mission by the Japan Aerospace Exploration Agency, JAXA,
is going to explore the martian moons Phobos and Deimos. Both moons will be investigated remotely from the mother spacecraft, that will also collect samples from the surface of Phobos. There will also be a small rover, IDEFIX, which will be delivered to Phobos´ surface and make in-situ investigations.
The Rover carries a scientific payload of four instruments: RAX, a Raman spectrometer, NavCam, a stereo pair of cameras looking ahead to image the terrain and also support navigation, miniRAD, a radiometer, and two WheelCams looking at the wheel-surface interface, and thus investigating the properties and dynamics of the regolith. The camera pairs will serve for both, technological and scientific needs [1,2].
The Rover is a contribution by the Centre National d’Etudes Spatiales (CNES) and the German
Aerospace Center (DLR) with additional contributions from INTA and Univ. Valladolid (Spain) and Univ. Tokyo and JAXA.
IDEFIX design and payload
The rover with an allocated mass of 29.1 kg, (including the mechanical support system (MECSS) and communications system, which will stay on the main spacecraft) is based on a carbon fiber structure, a locomotion system with four individually controlled wheels and a power system with a solar generator and re-chargeable batteries.
The ground segments are established at CNES in Toulouse as well as at DLR in Cologne, Germany. All communications between the rover ground segment and the flight segment are linked via the MMX spacecraft and the JAXA ground segment and ground stations.
IDEFIX is accommodating four scientific instruments:
Navigation cameras NavCams, looking in front of the rover with a resolution of ~1 mm at 1 m distance. Besides of the scientific use, they are key for navigation and analysis of the rover location, attitude and locomotion.
Two WheelCams placed on the underside of the rover each aim at a different rover wheel. The WheelCam images of the surface will be used to characterize the regolith particles (e.g., size distribution, morphological characteristics).
The Raman spectrometer RAX is able to analyse the mineralogy on a spot about 8 cm underneath the rover chassis. Heterogeneity of surface grains can be determined and the mineralogy of the material, measured in-situ will complement orbital spectroscopic data and will be important for putting in context the samples which will be returned to Earth.
The radiometer miniRAD will investigate the surface temperature and surface thermo-physical properties of Phobos by measuring the radiative flux emitted in the thermal infrared wavelength range. The measurements will also constrain porosity, surface roughness, and emissivity of the surface material.
Figure 1 shows the rover design, fully deployed in the on-Phobos configuration. Figure 2 shows the Flight model before integration to the main spacecraft.

Fig. 1. IDEFIX in on-Phobos configuration with deployed solar generator (image: CNES)

Fig. 2. IDEFIX Flight model shortly before integration to the main spacecraft
IDEFIX project status, one year before launch
The IDEFIX rover was delivered to JAXA in February 2024, after undergoing its environmental test program in Europe. It is now attached to the main spacecraft, where tests of the complete MMX system are performed at MELCO in Kamakura. Thermal Vacuum tests have been finalized in spring 2025. The overall test program for IDEFIX is performed both, with the flight model, attached to the MMX spacecraft, but also for operational and planning preparation with a representative “flat rover” at CNES in Toulouse.
The launch of MMX is now foreseen for October 2026, arrival at the martian system in 2027 and landing of the rover in late 2028 or early in 2029, after a landing site selection exercise.IDEFIX will be released from an altitude of about 40 m, fall to the surface, upright itself and drive and carry out scientific investigations for about 100 days.
References: [1] Michel, P. et al., Earth, Planets and Space, 74:2, 2022; [2] Ulamec, S. et al., Acta Astron., Vol. 210, pp. 95-101, 2023
How to cite: Ulamec, S., Michel, P., Grott, M., Schröder, S., Hübers, H.-W., Cho, Y., Prieto-Ballesteros, O., Murdoch, N., Vernazza, P., Biele, J., Tardivel, S., Krause, C., Grundmann, J.-T., Baroukh, J., Grebenstein, M., and Miyamoto, H.: IDEFIX - The MMX Phobos Rover: One year before launch, EPSC-DPS Joint Meeting 2025, Helsinki, Finland, 7–13 Sep 2025, EPSC-DPS2025-584, https://doi.org/10.5194/epsc-dps2025-584, 2025.
Introduction: The Mars-moon Exploration with GAmma rays and NEutrons (MEGANE) investigation will use both a Gamma-Ray Spectrometer (GRS) and Neutron Spectrometer (NS) to measure the elemental composition of Mars’ moon Phobos [1]. The MEGANE investigation is funded by NASA to participate in the Martian Moons eXploration (MMX) mission led by the Japanese Aerospace Exploration Agency (JAXA). MEGANE has three primary science goals, which are: 1) Determine whether Phobos is a captured asteroid or the result of a giant impact; 2) Study surface processes on airless bodies in Mars’ orbit; 3) Support MMX sample return by informing landing site selection and documenting the context of the MMX returned samples. Specifically, MEGANE will use gamma-ray and neutron spectroscopy to measure the concentrations of the following elements at Phobos’ surface: H, O, Mg, Si, K, Ca, Fe, and Th. MEGANE flight hardware has been delivered to the MMX spacecraft contractor, Mitsubishi Electric Corporation (MELCO), has been installed on the MMX spacecraft exploration module, and has completed its first full functional test on the spacecraft. Here, we present the status of the MEGANE investigation as the MMX mission proceeds towards launch in the fall of 2026.
MEGANE Instrumentation: MEGANE has three hardware components (Figure 1): the GRS, NS, and the Data Processing Unit (DPU). The GRS consists of a high-purity Ge (HPGe) gamma-ray sensor surrounded by a borated plastic scintillator that serves as an active anticoincidence shield (ACS) and fast neutron detector. The NS consists of two 3He sensors that measure thermal (neutron energy En < 0.4 eV) and epithermal neutrons (En > 0.4 eV). The DPU provides power, commanding, signal processing and data throughput functions. The MEGANE flight model (FM) hardware was delivered to JAXA and MELCO in December 2023. After a series of post-delivery tests to show that the hardware met requirements (Figures 2–4), the three components were handed over to JAXA and installed on the MMX exploration module in the spring of 2024.
MEGANE Post-delivery Activities: After the installation of the MEGANE components on the MMX exploration module, a series of increasingly complex tests were carried out to exercise various parts of the MMX (and MEGANE) hardware. These tests culminated with an initial electrical test that exercised the full functionality of MEGANE while installed on the MMX spacecraft with the other MMX instruments operating. With this test, we demonstrated full instrument functionality that meets performance requirements. This performance includes a demonstration of all commanding capabilities, operation of all sensors, and exercising the complete data pipeline flow that goes from the spacecraft to JAXA to the MEGANE Science Operations Center at Johns Hopkins Applied Physics Laboratory. During this test, the HPGe sensor had higher than expected leakage current, and we are working various mitigations to reduce this leakage current and its impact to GRS performance.
The MEGANE hardware is currently participating in various spacecraft environmental tests, including a recently completed thermal-vacuum test, as well as system level vibration and electromagnetic interference tests planned for later in 2025. Final post-environmental MEGANE testing is planned to take place at the Tanegashima launch site prior to launch in the fall of 2026.
In addition to spacecraft testing, the MEGANE team is working closely with JAXA colleagues to carry out planning for spaceflight operations of the MEGANE instrumentation [3]. MEGANE composition measurements will be conducted during two separate low-altitude operations phases – one phase prior to landing and one after landing. The primary composition measurements will be obtained when the MMX spacecraft is at an altitude of less than one Phobos radius. Other MEGANE operations include background measurements when the spacecraft is at high altitudes above Phobos, charged particle environment monitoring with the ACS and NS sensors, and an initial hardware checkout during the Earth-to-Mars cruise phase.
Summary: MEGANE flight model hardware has been delivered to and installed on the MMX spacecraft, and has demonstrated its full operation. Final operations planning and system testing is ongoing prior to the fall 2026 launch of MMX.
References: [1] Lawrence et al., Earth and Space Science, 6, 10.1029/2019EA000811, 2019; [2] Peplowski et al., NIM A, 10.1016/j.nima.2025.170542; [3] Kuramoto et al., Japan Geosci. Union Meeting 2025, PPS09-01, 2025.
How to cite: Lawrence, D. and the MMX MEGANE Team: The Mars-moon Exploration with GAmma rays and NEutrons (MEGANE) Investigation for the Martian Moon eXploration (MMX) Mission: Progress Towards Launch, EPSC-DPS Joint Meeting 2025, Helsinki, Finland, 7–13 Sep 2025, EPSC-DPS2025-1071, https://doi.org/10.5194/epsc-dps2025-1071, 2025.
The Martian Moons eXploration (MMX, JAXA) mission aims to perform the first sample return from Phobos and deploy a rover (IDEFIX, CNES/DLR) to explore the surface. The main objective of MMX is to decipher the origin of Phobos. Consequently, selecting the optimal sampling site in order to maximize the likelihood of retrieving material representative of Phobos’ composition and deploying IDEFIX in a dynamically safe environment are both critical for the success of the mission. In this context, understanding the surface dynamics of Phobos is essential for optimizing site selection, guiding rover operations, and interpreting the geological origin of collected samples.
Our work combines a physics-based analysis of Phobos' orbital dynamics with a surface-constrained trajectory model to assess regolith mobility and terrain stability. The core philosophy of our approach is to treat the moon’s surface as a dynamically evolving environment, shaped not only by impacts and thermal cycling but also by continuous external forces (i.e., centrifugal, tidal, and Coriolis) arising from its orbital motion and near-synchronous rotation around Mars.
We begin from the orbital dynamics analysis, which provides the instantaneous acceleration field across Phobos’ surface throughout its eccentric orbit. These accelerations are derived from a dynamical model that incorporates instantaneous tidal interactions with Mars, Phobos’ spin state, and its complex geometry.
From the resulting dynamic slope field, we extract three key indicators for landing site evaluation, integrating both short-term dynamical mobility and long-term surface behavior:
- Maximum dynamic slope: indicates whether a terrain becomes unstable at any point during the orbit.
- Mean dynamic slope: reflects long-term equilibrium and serves as a proxy for the local repose angle.
- Temporal variability of the dynamic slope: highlights regions subject to cyclic changes in surface stability, potentially enhancing regolith mobility even in otherwise stable areas.
Based on these indicators, we have constructed a normalized map to assess the potential mobility of surface regolith across Phobos (see Figure 1). This map integrates the maximum, mean, and temporal variability of the dynamic slope, offering a synthetic view of terrain stability and its susceptibility to material transport. It provides a valuable basis for evaluating both long-term accumulation zones and areas prone to transient motion, supporting the strategic selection of sampling and landing regions.
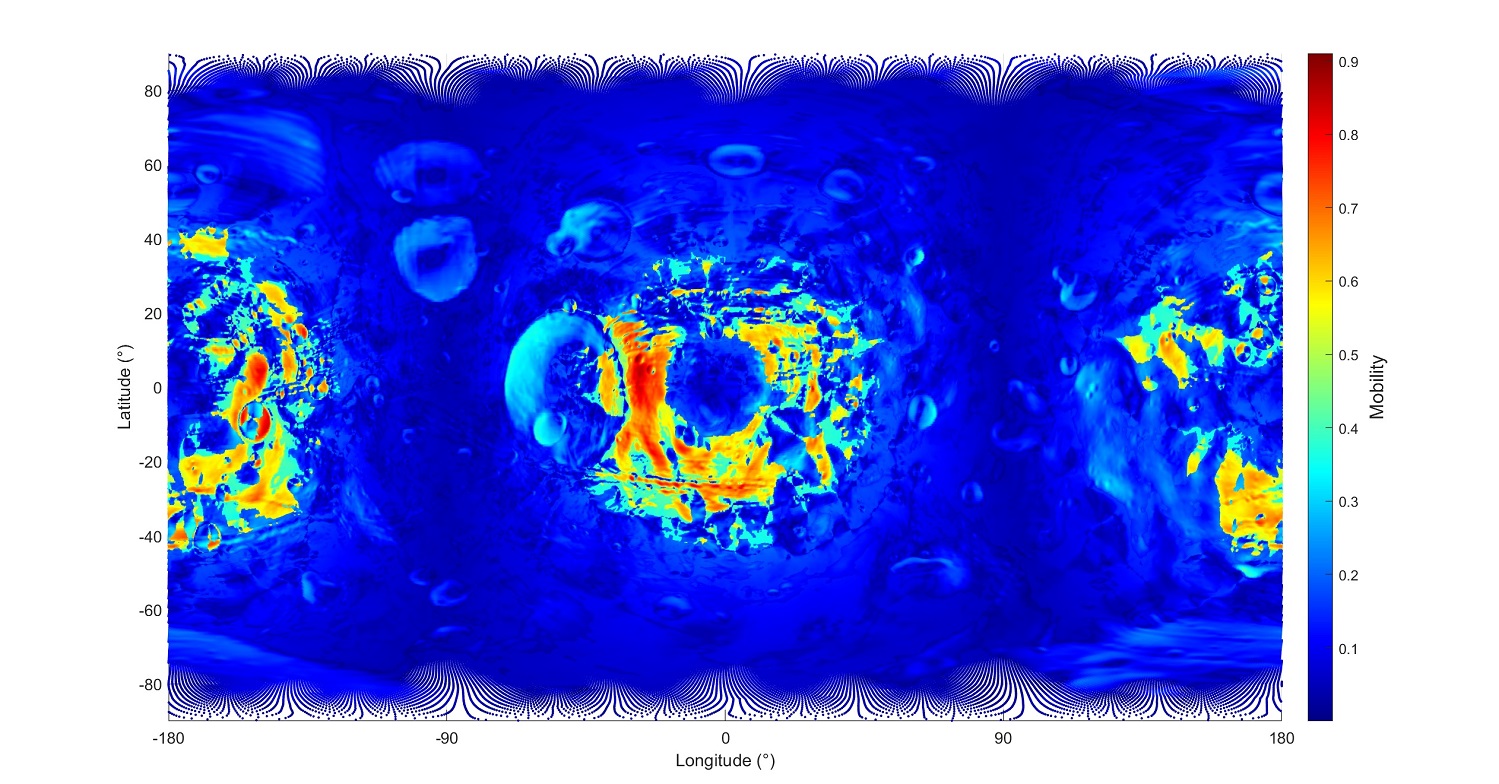
Figure 1. Normalized mobility index across Phobos’ surface, derived from the combination of dynamic slope amplitude, average, and variability along the orbit. The mobility index ranges from 0 (minimum expected material motion) to 1 (maximum susceptibility to regolith displacement).
We then simulate regolith transport across a high-resolution shape model of Phobos (Ernst et al., 2023). These simulations serve two main purposes. First, they allow us to identify low-mobility regions where regolith tends to accumulate, and high-mobility regions where surface material may be periodically transported or lost, and thus less affected by space weathering. This supports the selection of landing zones that are both safe and scientifically valuable. Second, we reverse-integrate trajectories from selected target points (e.g., candidate sampling sites) to identify the potential source areas of deposited material. This source region mapping provides critical context for interpreting in situ analyses by linking samples to their geological and dynamical origin.
Our methodology offers a robust decision-support tool for MMX mission planning, helping to:
- Select landing sites that are both dynamically stable and compositionally representative.
- Guide rover navigation toward accessible, diverse sampling areas.
- Inform post-return analyses by linking samples to their surface origin and transport history.
As of May 2025, the MMX landing site has not yet been finalized. Within the currently proposed candidate zones, some appear better suited to retrieving material representative of the surface regolith, while others may offer access to more pristine, rock-derived samples. For IDEFIX, a subset of these zones combines geological diversity with dynamical safety, offering promising terrain for in situ exploration.
This study demonstrates how physics-based modeling of regolith dynamics can directly support the planning, execution, and interpretation of planetary surface missions. The integration of orbital and surface mechanics offers a predictive framework not only for choosing where to land and sample, but also for uncovering the dynamical history behind the regolith, and identifying those regions most likely to preserve material representative of Phobos’ global composition, crucial for constraining the moon’s origin.
Acknowledgements: SC is supported by the French ANR project Roche, number ANR-23-CE49-0012, and French Space Agency (CNES). IH is supported by grant No. PID2020-116846GB-C22 by the Spanish Ministry of Science and Innovation/State Agency of Research MICIU/AEI/10.13039/501100011033 and by ‘‘ERDF A way of making Europe’’.
How to cite: Herreros, I. and Charnoz, S.: Surface Mobility and Regolith Transport Analysis to Support MMX Landing Site Selection and Sampling Strategies on Phobos, EPSC-DPS Joint Meeting 2025, Helsinki, Finland, 7–13 Sep 2025, EPSC-DPS2025-561, https://doi.org/10.5194/epsc-dps2025-561, 2025.
Please decide on your access
Please use the buttons below to download the supplementary material or to visit the external website where the presentation is linked. Regarding the external link, please note that Copernicus Meetings cannot accept any liability for the content and the website you will visit.
Forward to presentation link
You are going to open an external link to the presentation as indicated by the authors. Copernicus Meetings cannot accept any liability for the content and the website you will visit.
We are sorry, but presentations are only available for users who registered for the conference. Thank you.
Introduction. The origin of the Martian moons remains a debated topic within the scientific community. Two leading scenarios are commonly considered: the capture of an asteroidal object [1-2] and a giant impact between proto-Mars and a large body [3-5]. The debate arises from the red-sloped spectra, and the primitive and dark appearance of Phobos [6-15], resembling a D-, P- or T-type asteroid [16]. This is contradicted by the orbital parameters [17], the MIR/TIR spectra [18-20] and a possible presence of a 1 µm absorption [6], all suggesting an impact origin. Another debated topic is Phobos’ color dichotomy that characterizes the satellite surface, first described by [6]. The blue unit is associated to the eastern rim of Stickney crater (9 km across), while the red unit characterizes the rest of the surface. The blue unit has a higher reflectance in the VIS [21]. Since the latter is prominent near the impact site, it is hypothesized to consist of ejected material from Stickney. In contrast, the red unit is an older, space weathered material.
In this work we have analyzed three MeX/OMEGA (Observatoire pour la Minéralogie, l’Eau, les Glaces et l’Activité, [22]) datacubes in the spectral range 0.4 µm - 2.5 µm. The aim is to perform detailed spectroscopic analysis to understand composition and mineralogy of Phobos.
Methods and Results. The data underwent a geometric and photometric correction. For the latter, we used the Lommel-Seeliger Function, a simplified photometric law from the Hapke Theory [23] which performs very well for surfaces dominated by single scattering (i.e. dark surfaces) [11,13].
Regions of Interest (ROIs) were identified across the three datacubes, to analyze the blue and red unit spectral properties as well as to describe the transition between them.
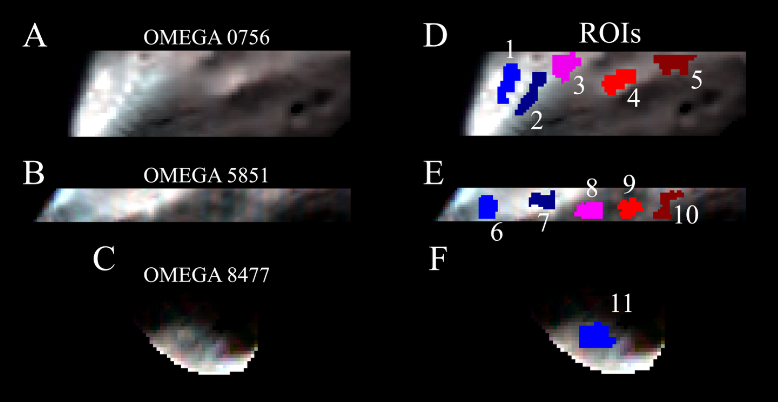
Figure 1: Set of ROIs identified across the three datacubes.
In Fig.1D-E-F the locations of all identified ROIs are shown. As illustrated FIG.1A, the cube 0756 captured a portion of the inner region of the Stickney crater where we identified the ROI 1 and the blue unit close to the rim of Stickney, where ROI 2 was selected. The remaining area is occupied by the red unit. ROI 3-4-5 were identified progressively farther from the blue unit to examine spectral transitions.
As seen in Fig.1B, cube 5851 captures a larger portion of Stickney interior, where ROI 6-7 have been identified, while ROI 8-9-10 have been selected with the same approach adopted for the ROI 3-4-5.
Finally, for orbit 8477 (Fig.1C) a single large ROI has been selected due to the considerable noise of this dataset.
In Fig.2 the mean extracted and normalized spectra are presented: it is possible to notice the gradual transition in slope from the blue unit spectra to the redder regions. The error bars account for both standard deviation and instrumental errors, while the gray bands are wavelength ranges where bad bands are present. The gradual spectral transition of Phobos suggests an increase degree of mixing between the blue and the red unit as we approach to the blue unit. In addition, one may notice the absence of strong absorption features, which makes difficult to diagnostic the mineralogy.
The only subtle absorption that we identified appears in ROI 2, near 1 µm. If confirmed, it would trace presence of olivine and pyroxene. However, this remains a tentative suggestion due to the instrumental decrease in sensitiveness at this wavelength range.
In Fig.3 we present the best match with asteroid spectra. While the blue unit seem to be consistent with the T-/P- type of asteroid, the transition/red unit is best fitted with the D-type asteroid.
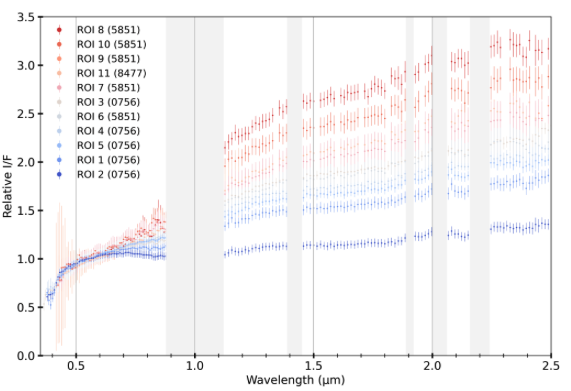
Figure 2: Set of mean spectra extracted.
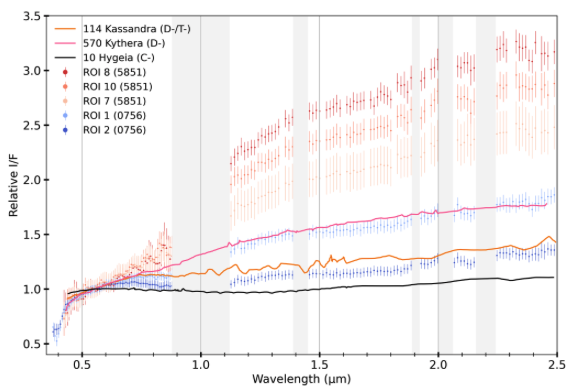
Figure 3: Comparison with mean Tholen spectra [26].
The meteorite comparison supports the asteroid comparison’s results (see Fig.4). Indeed, the Tagish Lake (TL) meteorite, a D-type asteroid analog [25], matches the Phobos transition/red unit. For the blue unit, the best analog found include Kaidun, a Phobos analog by [27], the Murchison fusion crust, also proposed by [9] as a Phobos analog, and cold Bokkeveld. Such meteorites consist of carbonaceous chondrites, i.e. primitive material.
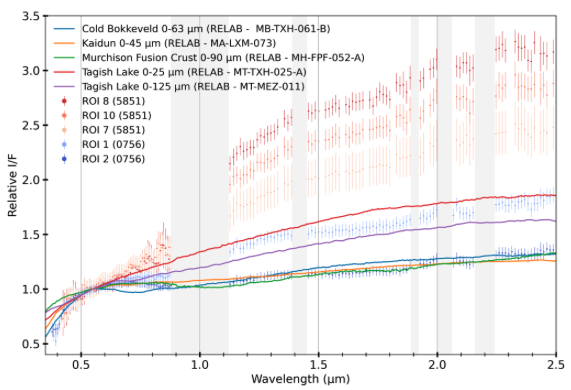
Figure 4: Comparison with meteorites spectra.
Finally, we present the comparison with results present in the literature (see Fig.5). While the red unit of [6] and [11] are consistent with our dataset, the blue unit of [11] seems to match the transitional unit. This indicates that the ROI 2 mean spectra may be one of the bluest spectra of Phobos ever obtained.
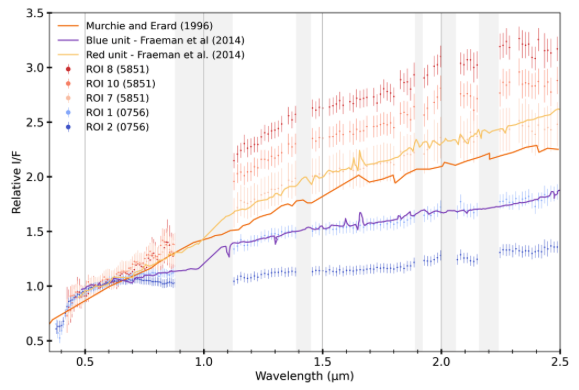
Figure 5: Comparison with relevant literature spectra.
References. [1] Singer, 2003, 6th Int. Conf. on Mars, page 3063; [2] Hansen, 2018 MNRAS, 475(2):2452–2466; [3] Craddock et al. (2011), Icarus, 211, 1150–1160; [4] Rosenblatt and Charnoz (2012), Icarus, 221, 806–815; [5] Hyodo et al. (2017), ApJ, 845, 125–132; [6] Murchie and Erad (1996), Icarus, 123, 63–86; [7]Rivkin, A et al. (2002), Icarus, 156, 64; [8] Pajola et al. (2012), MNRAS, 427, 3230; [9] Fraeman et al. (2012), J. Geophys. Res. Planets, 117; [10] Fraeman et al. (2014), Icarus, 229, 196; [11] Pajola et al. (2018), Planet. Space Sci., 154, 63; [12] Takir et al. (2022), Icarus, 371, 114691; [13] Fornasier et al. (2024), Astron. Astrophys., 686, A203; [14] Poggiali et al. (2022), MNRAS, 516, 465; [15] Wargnier et al. (2023), MNRAS, 524, 3809; [16] Bus, S. J. & Binzel, R. P. 2002, Icarus, 158, 146; [17] Jacobson et al. (2014), Planet. Space Sci., 102, 35; [18] Roush et al. (2000), Lunar Planet. Sci. Conf., 1598; [19] Giuranna et al. (2011), Planet. Space Sci., 59, 1308; [20] Glotch et al. (2018), J. Geophys. Res. Planets, 123, 2467; [21] Thomas et al. (2011), Planet. Space Sci., 59, 1281; [22] Bibring et al. (2004), Earth Space Planets, 1240, 37–49; [23]Hapke, 2012, Theory of Reflectance and Emittance Spectroscopy, Cambridge Univ. Press; [24] Acton et al. (1996), Planet. Space Sci., 44, 65; [25] Hiroi et al. (2001), Science, 293, 2234; [26] Tholen, D. J. 1984, PhD thesis, University of Arizona, USA; [27] Ivanov et al. (2004), Solar System Res., 38.2, 97–107;
How to cite: Beccarelli, J., Pajola, M., Munaretto, G., Lucchetti, A., Poggiali, G., Simioni, E., Tusberti, F., Rossi, C., Fornasier, S., Barucci, M. A., and Brucato, J. R.: Phobos 0.4 – 2.5 μm spectral analysis of the red and blue units through the MarsExpress/OMEGA dataset., EPSC-DPS Joint Meeting 2025, Helsinki, Finland, 7–13 Sep 2025, EPSC-DPS2025-787, https://doi.org/10.5194/epsc-dps2025-787, 2025.
Introduction
Phobos and Deimos are the two moons of Mars. Despite decades of observations, their origin is still debated, with hypotheses proposing either capture scenarios involving primitive asteroid-like bodies [1,2] or in-situ formation from impact-generated debris around Mars [3-5]. Previous studies revealed that Phobos has a spectrally heterogeneous surface consisting primarily of a "Red" unit and a spectrally distinct "Blue" unit near the Stickney crater [6-9]. Initially, the Blue unit was considered Stickney’s ejecta, but an exogenous (external) origin cannot be ruled out [10,11]. Deimos, on the other hand, appears spectrally uniform and closely resembles Phobos’s red unit [8]. Photometric analyses of the Martian moons are largely focused on Phobos ([2] and references therein), while Deimos is less studied [12]. One photometric properties of particular interest is phase reddening, i.e. the increase in spectral slope with phase angle attributed to multiple scattering, surface roughness at the sub-micron level, and space-weathering [13-15]. Its investigation helps to constrain the physical properties, in terms of particle size and roughness, of the martian moons surfaces. The Colour and Stereo Surface Imaging System (CaSSIS) is a stereo-camera on board the ExoMars/TGO satellite [16]. It provides images of the Martian surface in 4 filters centered at 499.9 nm (BLU), 675.0 nm (PAN), 836.2 nm (RED) and 936.7 nm (NIR). We present the analysis of the CaSSIS observations of the Martian Moons, the first characterisation of the spatial distribution of phase reddening on Phobos and its variability among specific geological units. In addition, we provide the first estimate of the Deimos global phase reddening and perform a comparative analysis with Phobos.
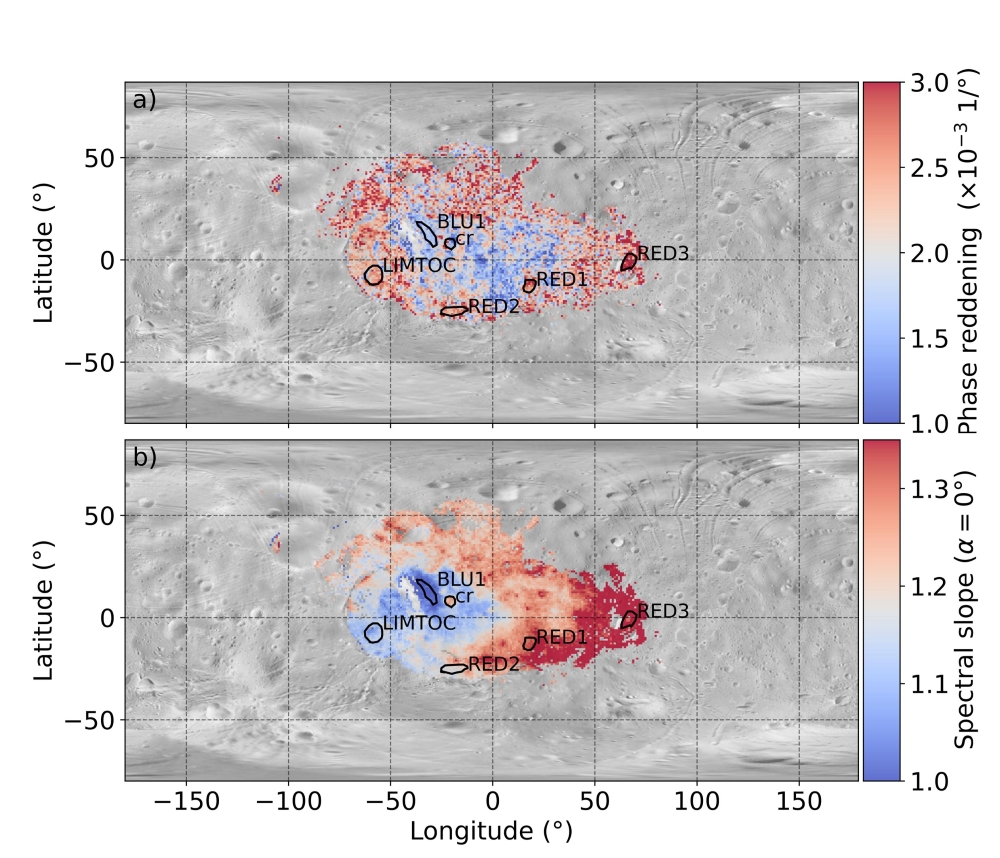
Fig. 1. a) Phase reddening and b) zero phase angle NIR/BLU spectral slope spatial distribution overlain on the Phobos Viking global mosaic. Black polygons labels indicate the name and position of the ROIs
Data & Methods
We analyse 35 CaSSIS 4 band observations of Phobos and 4 of Deimos, spanning phase angles of 0.8° − 83.0° and 14.2° − 49.5° and spatial resolution of ≈ 60-120 m/px and ≈ 200-300 m/px, respectively. Since Deimos has very small spectral variability we opted for a very simple and straightforward approach and collected the global average NIR/BLU filter ratio (as a proxy for spectral slope) and phase angle for all 4 observations and fitted this dataset with a linear model, which parameters allowed to estimate the global Deimos zero-phase angle spectral slope (model intercept) and the global Deimos phase reddening coefficient (model linear term). Instead, since for Phobos we have much more observations, we also analysed the spatial distribution of phase reddening and spectral slopes. This requires a different approach. We defined a 1°x1° resolution latitude-longitude grid with extent −90◦ + 90◦ and −180°+ 180°. For each grid point, we collected data (i.e., NIR/BLU and phase angle) from all the observations covering that location and fitted this dataset with a linear model, to obtain maps of phase reddening and zero phase spectral slope (Fig. 1). To analyse specific locations of Phobos with higher accuracy, we defined regions of interest (ROIs, Fig. 2) and repeated the fit with all data from such ROIs. In particular, we choose ROIs to represent different stages of regolith maturity, based on the high-resolution images and geologic map presented [10]. The "RED1" to "RED3" ROIs are picked on the Red Unit and represent the oldest and most mature surface of Phobos. "LIMTOC" and "BLU2" are relatively fresher and sample the Limtoc crater and the blue unit. The "cr" and “BLU1" ROI are the freshest units and post-date the Blue unit.
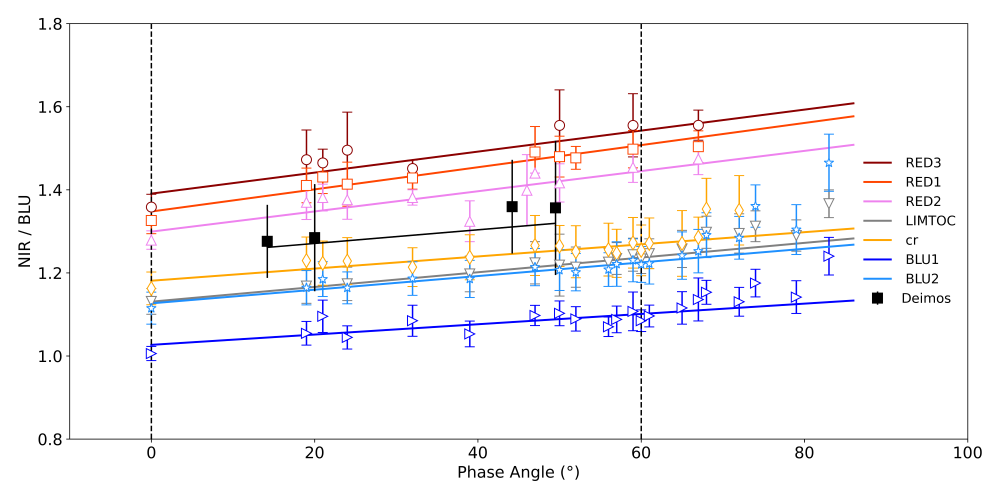
Fig. 2. Phase reddening model fits to the Phobos ROIs and Deimos. Vertical dashed lines indicate the range of phase angles used for the fit.
Results and Conclusions
Our spatially resolved phase reddening and spectral slope maps of Phobos and their comparison with the Deimos phase reddening highlight that:
- A broad region on Phobos, that includes the blue unit, is characterised by lower phase reddening surrounded by a higher phase reddening surface.
-Deimos and older Phobos units (“RED1” to “RED3“ ROIs) have the highest phase reddening. Younger units (“cr” and “BLU1” ROIs) have the lowest phase reddening. Intermediate age units, such as Limtoc, have intermediate phase reddening. This is consistent with phase reddening on Phobos originating from sub-micron roughness added by npFe0 particles added by space-weathering, as occurs at the Moon.
-We exclude either a Deimos or Stickney ejecta origin for the Blue unit. Instead, an exogenous nature is consistent with our results.
- We provide the first estimate of Deimos phase reddening, which is comparable to the Phobos Red unit.
Acknowledgements
CaSSIS is a project of the University of Bern and funded 240 through the Swiss Space Office via ESA’s PRODEX programme. The instrument hardware development was also supported by the Italian Space Agency (ASI) (ASI-INAF agreement no.2020-17-HH.0), INAF/Astronomical Observatory of Padova, and the Space Research Center (CBK) in Warsaw. Support from SGF (Budapest), the University of Arizona (Lunar and Planetary Lab.) and NASA are also gratefully acknowledged. Operations support from the UK Space Agency under grant ST/R003025/1 is also acknowledged. This work has been developed under the ASI-INAF agreement n. 2024-40-HH.0
References
[1] Pajola, M. et al. 2012, MNRAS, 427, 3230
[2] Fornasier, S. et al. 2024, A&A, 686, A203
[3] Rosenblatt, P. 2011, A&A Rev., 19, 44
[4] Craddock, R. A. 2011, Icarus, 211, 1150
[5] Hyodo, R. et al., 2017, ApJ, 845, 125
[6] Murchie, S. & Erard, S. 1996, Icarus, 123, 63
[7]Fraeman, A. A. et al. 2012, JGR:Planets, 117, E00J15
[8]Fraeman, A. A. et al. 2014, Icarus, 229, 196
[9]Pajola, M. et al. 2018, PSS, 154, 63
[10] Basilevsky, A. T. et al. 2014, PSS, 102, 95
[11] Takir, D. et al. 2017, AJ,153, 31
[12] Pang, K. D., et al. 1983, JGR:Planets,88, 2475
[13] Sanchez, J. A., et al. 2012, Icarus, 220, 36 300
[14]Sato, H. et al. 2014, JGR:Planets, 119, 1775
[15]Schröder, S. E. et al. 2014, Icarus, 239, 201
[16] Thomas, N. et al. 2017, SSR, 212, 1897
How to cite: Munaretto, G., Pajola, M., Beccarelli, J., Cremonese, G., Lucchetti, A., Re, C., Tullo, A., Almeida, M., Read, M., Mason-Piercy, K., Thomas, N., Patel, M. R., and Valantinas, A.: Phase reddening of Phobos and Deimos from TGO/CaSSIS observations , EPSC-DPS Joint Meeting 2025, Helsinki, Finland, 7–13 Sep 2025, EPSC-DPS2025-1483, https://doi.org/10.5194/epsc-dps2025-1483, 2025.
For more than 21 years, the Mars Express mission (MEx) has been orbiting the Martian system, acquiring data on Mars' surface and atmosphere, as well as on its two moons, Phobos and Deimos. The origin of the Martian moons remains a matter of debate. Deimos is the smallest of the two moons and orbits Mars at a much greater distance than Phobos. Previous photometric analyses [1] show that the surface of Deimos is smoother and more homogeneous than that of Phobos, but with overall similar photometric properties.
We analyzed images of Deimos taken with both the High Resolution Stereo Camera (HRSC) and the Super Resolution Channel (SRC) instruments. HRSC is a pushbroom camera with nine filters, including five panchromatic and four color filters (blue, green, red, and infrared), while the SRC is a framing camera with one panchromatic filter centered at 650 nm and covering from 400 to 900 nm [2,3]. The HRSC Deimos dataset is relatively limited with only 18 images available in each filter, acquired between January 2018 and January 2025, with a spatial resolution ranging from 390 m/px to 800 m/px. Conversely, the SRC dataset of Deimos contains more than 3500 images covering more than 20 years of observations, from October 2004 to December 2024. The spatial resolution varies from 85 m/px to 300 m/px, while the phase angle ranges from 0.06 to 120°. For the very first time, we have calibrated the absolute response of SRC using images of stars and Jupiter. We performed both disk-integrated and disk-resolved photometry. From the retrieved phase curve, we applied the Hapke IMSA [4] model to characterize the physical properties and the texture of the surface.

Figure 1: Disk-integrated phase curve of Deimos, compared with that of Phobos derived in [5] with the same HRSC filter.
The results obtained in the four HRSC color filters indicate that Deimos is photometrically similar to Phobos, while slightly brighter in the blue and green filters (Fig.1). Looking at the images, a bright region – corresponding to the streamers on the equatorial ridge – is evident (Fig. 2). Except for this feature, the surface of Deimos appears to be relatively homogeneous. In particular, the equatorial ridge, corresponding to higher geopotential height, is about 35% brighter (and up to 58%) than the average surface of Deimos. It is also notable that the craters (e.g., Voltaire (22°N; 3.5°E) and Swift (12.5°N; 358°E) craters) appear to exhibit no discernible increase in reflectance compared to the average surface. This contrasts with Phobos, where the crater rims are significantly brighter (up to 50%) than the average surface, at least in the area dominated by, or close to the blue unit. This suggests that the craters on Deimos are likely relatively old.
The derived Hapke parameters (considering a one-term Henyey-Greenstein function) have very similar values compared to those derived for Phobos in [5]: ω = 0.068 +/- 0.001, g = - 0.27 +/ 0.01, Bsh,0 = 2.14 +/- 0.14, hsh = 0.065 +/- 0.004, and θ = 19.4 +/- 0.1°. From these parameters we derived a porosity for the very first layer (typically few microns) of the surface of about 86%, indicating that the surface of Deimos is likely to be composed of complexly shaped grains and/or fractal aggregates. The parameters also suggest that Deimos has a strong opposition surge, which is mainly due to shadow hiding. We found that the coherent backscattering process is negligible on Deimos.
Based on the HRSC images, we have tentatively identified a blue unit on Deimos. This blue spectral behavior has already been noticed by [6]. Here we have shown that this blue unit is observed at least on the equatorial ridge (streamers). We found a decrease in the spectral slope of about 50% associated with this brighter region, compared to the average surface. The spectroscopic variations between the blue and red units on the two Martian moons are similar. This blue unit may be associated with changes in surface texture, such as grain size and porosity [7].
This work is the first extended study of the photometric properties of Deimos, in particular covering the opposition effect. The results are of significant interest for JAXA’s Martian Moon eXploration (MMX) mission [8], which will be launch in 2026 and return samples from Phobos to determine the origin of the Martian moons.
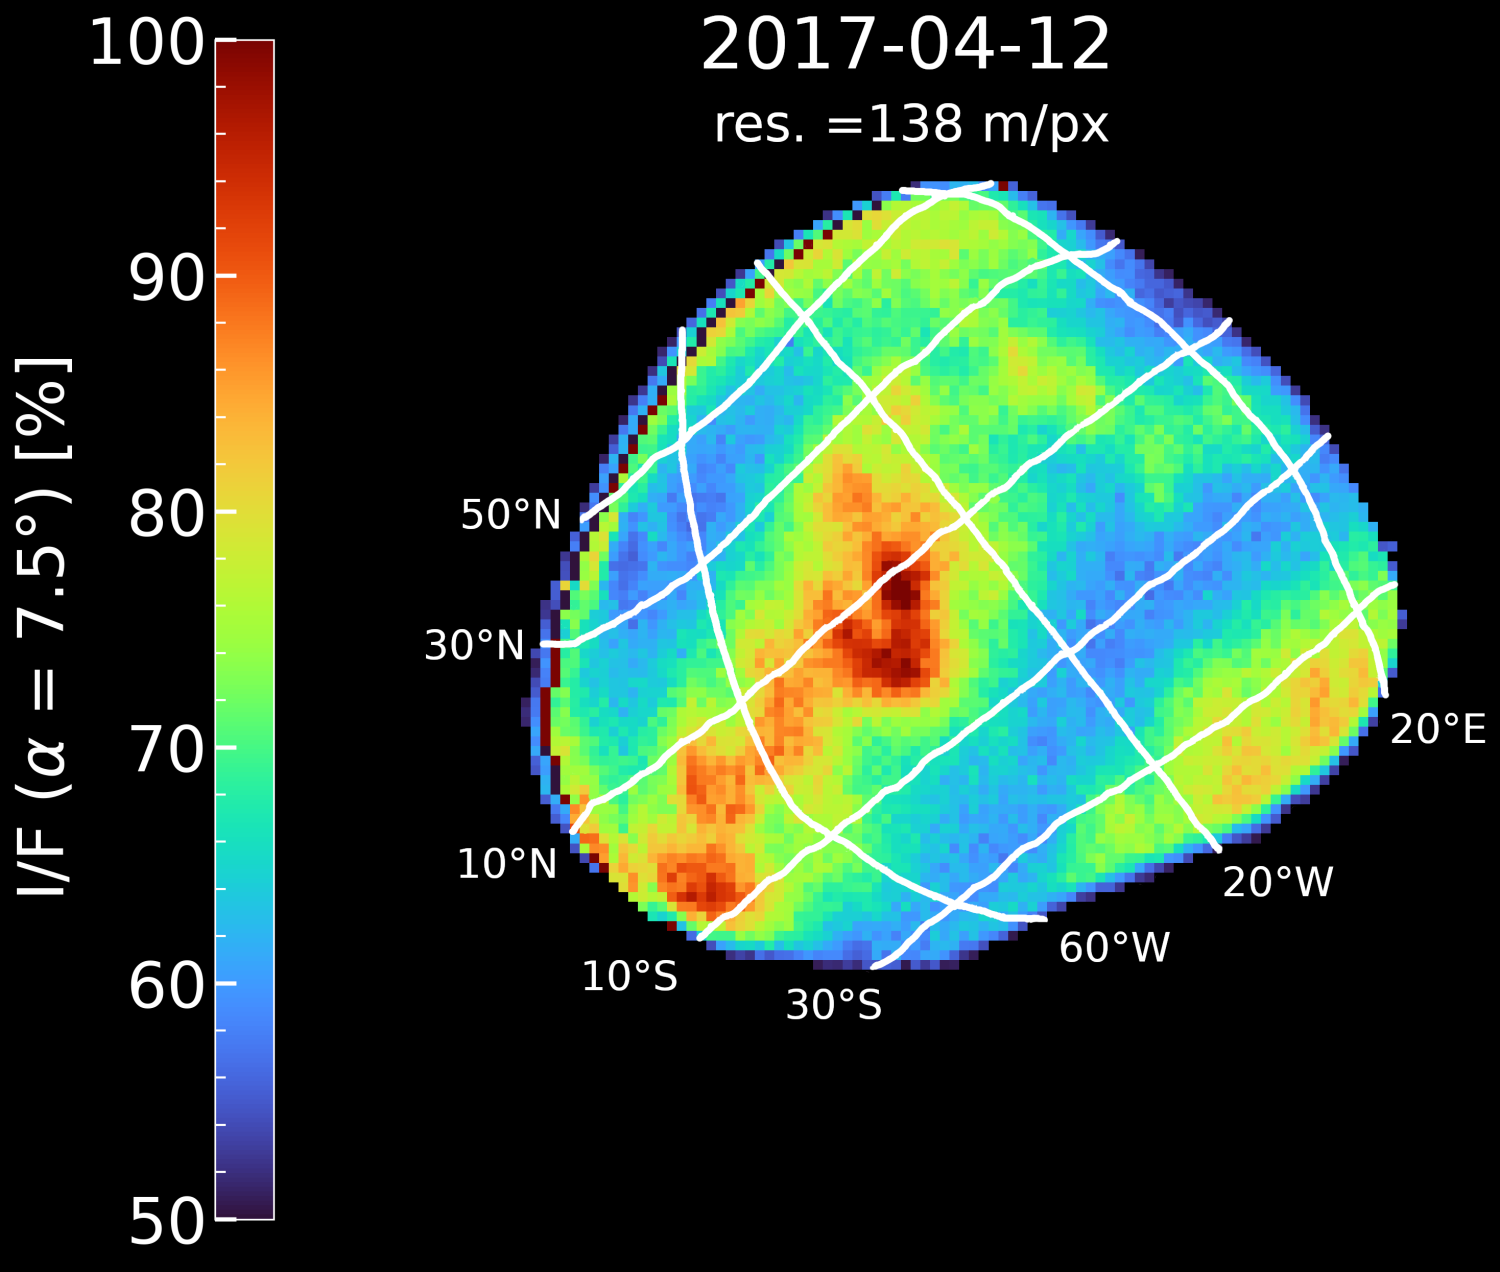
Figure 2: SRC Deimos image corrected by the Lommel-Seeliger disk-function.
Acknowledgements: The authors acknowledge the Centre National d’Etudes Spatiales (CNES) for the continuous support.
References: [1] Thomas et al. (1996),Icarus,123, 536-556 [2] Jaumann et al., PSS, 55, 928-952 [3] Oberst et al. PSS, 56, 473-491 [4] Hapke (2012), Cambridge University Press [5] Fornasier et al. (2024), A&A , 686, A203[6] Thomas et al. (2011), PSS, 59, 1281[7] Wargnier et al. (2025), accepted for publication in Icarus [8] Kuramoto et al. (2022), EPS, 74, 1, 12
How to cite: Wargnier, A., Fornasier, S., Simon, P., El-Bez--Sébastien, N., Tirsch, D., Matz, K.-D., Gautier, T., Doressoundiram, A., and Barucci, A.: Deimos photometric properties from Mars Express HRSC/SRC observations, EPSC-DPS Joint Meeting 2025, Helsinki, Finland, 7–13 Sep 2025, EPSC-DPS2025-276, https://doi.org/10.5194/epsc-dps2025-276, 2025.
Introduction: Phobos and Deimos importance as scientific target is growing up in the latest years due to an increasing interest in the planetary community on the origin and evolution of the two Martian moons. While the debate over whether these are captured asteroids [1] or the result of a catastrophic collision [2] is still ongoing, JAXA is preparing to launch in 2026 the Martian Moons eXploration (MMX) [3] sample return mission to study the two moons in detail and to collect a sample on the larger moon, Phobos, to be brought back to Earth in 2031. Along the spacecraft payload, a pivotal instrument to characterize the surface of the martian moons will be MMX InfraRed Spectrometer (MIRS) [4] giving access to the mineralogical composition of the surface and the possible presence of volatiles. The community's interest on these targets is confirmed by the decision of ESA to allow a fly-by of the moon Deimos with ESA's Hera spacecraft during its journey to the binary asteroid Didymos-Dimorphos. The probe acquired several images of the moon and Mars with its instruments, including the Hyperscout spectrophotometer and the TIRI thermal camera. In this growing interest, it becomes essential to exploit all the data we possess to prepare and support future explorations; in this light, the Mars Express (MEx) mission with its OMEGA and PSF spectrometers and HRSC multifilter camera represents an essential dataset for the study of the two martian moons. The other side of the problem, interpreting the effect of physical properties such as grain size, composition, porosity and space weathering, can only effectively approached with laboratory measurements. Measuring analog material such as meteorites and they primary component, minerals, can open the door to more complex and meaningful interpretation of the remote sensing observations.
Methods: In this contribution we will show how laboratory data are essential to data interpretation. In particular, the effect of grain size and composition, approached as single problem is already a promising way to remote sensing interpretation. But when these two features are studied in combination we have a key factor in understanding the physical processes and characteristics of a surface. In detail, we will show how selected range of grain size (i.e. < 100 µm or 100-200 µm) affects some of the main features of the infrared spectrum (slope, 2.7 µm band and Christiansen features, Reststrahlen bands and Transparency features in the mid-infrared range). Moreover, we will prove how a realistic grain size distribution derived from boulder and regolith size frequency can change the final outcome of the spectrum. These physical properties will also be studied through their link with composition mixing two or more components. Special attention will be focused on how which variable most influences the final spectrum and whether various types of environment (vacuum, temperature, irradiance...) can affect the final result. The presentation will go through the reanalysis of some data from the ESA Planetary Science Archives of the MEx mission, in particular we will show data from OMEGA and HRSC instrument, to fully exploit the potential derived from decades-long observations of moons and the planet Mars. These instruments, along with PFS thermal spectrometer, offer a unique point of view on the Martian moons allow to investigate the mineralogical nature of the surface.
Results and conclusion: We will show results from some recent lab work [5,6] in particular how grain size and dark material abundance can alter the slope or the depth of some fundamental bands like the OH-stretching at 2.7 µm. Moreover, these laboratory data will be used for the interpretation of recently published observations from various missions such as MEx-OMEGA [7] and TGO-NOMAD [8] and others. Moreover, additional MEx mission data from the ESA PSA [9] archive will be shown and compared with previous observations and laboratory data. In particular data from recent years will be exploited ton increase our dataset on different spectral range.
The goal of this work is to show the deep link that exists between remote sensing interpretation and laboratory measurements and how new advances can also be achieved by reanalysis of archival data. In the renewed interest in Martian moons we believe that a step forward on laboratory analogs can be made, leading in a big step forwards a more confident comparison with real surfaces. Therefore, only if the remote sensing data are combined with laboratory experiments on minerals and meteorites we can aspire to obtain an essential base knowledge for any future analysis aiming to interpret the nature of these enigmatic and elusive objects.
Acknowledgments: G.P. work on remote sensing data was supported by ESA Archival Research Visitor Programme. G.P. and J.R.B. acknowledge support from Italian Space Agency ASI-INAF agreement 2022-1-HH.0. M.A.B. and A.W. acknowledge support by Centre National d’Etudes Spatiales (CNES).
References: [1] Hyodo R. et al. (2018). ApJ, 860, 150 [2] Higuchi A. and Ida S. (2017). AJ, 153, 155 [3] Kuramoto K.et al. (2022) Earth Planets Space, 74, 12 [4] [5] Poggiali G. et al. 2023a, Icarus, 394, 115449 [6] Poggiali G. et al. 2024, A&A 685, A14 [7] Pajola M. et al. 2025. A&A, (accepted) [8] Ruiz Lozano L. et al., (2024) EPSC2024-925 [9] Besse S. et al. 2018. PSS, 150, 131-140
How to cite: Poggiali, G., Alberini, A., Wargnier, A., Beccarelli, J., Ruiz Lozano, L., Yumoto, K., Besse, S., Pajola, M., Brucato, J. R., and Barucci, M. A.: The (Infrared) view of Phobos and Deimos, synergy between data from laboratory and remote sensing to understand the enigmatic nature of the Martian moons. , EPSC-DPS Joint Meeting 2025, Helsinki, Finland, 7–13 Sep 2025, EPSC-DPS2025-1606, https://doi.org/10.5194/epsc-dps2025-1606, 2025.
ESA’s Hera mission performed a Mars flyby on March 12, 2025, en route to the binary asteroid system Didymos–Dimorphos, which has been greatly influenced by NASA’s DART spacecraft impact (Michel et al. 2022). This flyby event presented a unique opportunity to observe extended light sources using Hera’s scientific instruments, which is crucial for their calibration. Additionally, the flyby offered a rare chance to observe the anti-Mars hemisphere of Deimos, as Mars orbiters, such as NASA’s Mars Reconnaissance Orbiter and ESA’s Mars Express, can only capture the sub-Mars hemisphere from their orbits.
Thanks to the great efforts of Hera’s flight dynamics team in optimizing the flyby timing to coincide with Deimos approaching Hera’s trajectory, along with precise spacecraft attitude control to track both Deimos and Mars in the field of views of cameras, Hera’s three complementary camera systems, Asteroid Framing Cameras (AFC), the HyperScout-H (HS-H) instrument, and JAXA’s Thermal Infrared Imager (TIRI), were able to observe both Mars and Deimos simultaneously.
The AFC captured over 230 images of Mars and more than 50 of Deimos. Although most Deimos images were small (≤ a few pixels across), they were taken at low solar phase angles (2–4°), which are valuable for constraining the phase function of Deimos’s anti-Mars side. The largest Deimos image (~140 pixels in diameter) was taken from a distance of 917 km. In total, the AFC acquired four images of this size range at phase angles between 13–17°, allowing for the identification of surface features.
The AFC images revealed a number of important geomorphologic features and albedo distribution on anti-Mars hemisphere. Notably, the anti-Mars hemisphere exhibits “streamers”, which are long, high albedo features similar to those seen on the sub-Mars hemisphere (P. Thomas et al. 1996, N. Thomas et al. 2011). The albedo contrast between the streamers and the surrounding terrain is comparable to that observed on the sub-Mars hemisphere, with variations reaching tens of percent. The albedo decreases monotonically from topographic highs to lows over several kilometers.
The albedo histogram of Deimos shows a highly asymmetric profile with a triangular shape: a sharp increase in frequency on the lower albedo side and a gradual decrease on the higher albedo side. This asymmetric histogram is similar to both the space weathering color index histogram (Koga et al. 2018) and the albedo histogram (Nakahara et al. 2023) observed on the S-type asteroid Itokawa. Although further analysis is needed to determine the exact cause, model calculations by Nakahara et al. (2023) suggest that the observation is consistent with a thin layer of regolith over a differently colored substrate. This could indicate space weathering, a mixture of two color components, or a combination of these processes. Regardless, the surface likely undergoes vertical mixing and diffusive mixing driven by the random motion of small regolith particles.
Understanding these surface characteristics will help constrain the nature of Deimos’ surface materials and optimize the observation plans of JAXA’s MMX mission, which will collect samples exclusively from Phobos. Consequently, proximity observations of Deimos will be crucial for comparing the similarities and differences between the two Martian moons (Kuramoto et al. 2022).
References:
Koga, S. et al. 2018. Spectral decomposition of asteroid Itokawa based on principal component analysis, Icarus, 299, 386-395.
Kuramoto, K., et al.., 2022. Martian moons exploration MMX: sample return mission to Phobos elucidating formation processes of habitable planets. Earth, Planets and Space 74, 12.
Michel, P., et al., 2022. The ESA Hera Mission: Detailed Characterization of the DART Impact Outcome and of the Binary Asteroid (65803) Didymos. Planet. Sci. J. 3, 160.
Nakahara, S. et al. 2023. Space weathering distribution and resurfacing on asteroids, JpGU, # MZZ40-02.
Thomas, N. et al. 2011. Spectral heterogeneity on Phobos and Deimos: HiRISE observations and comparisons to Mars Pathfinder results, Planet. Sp. Sci., 59, 1281-1292.
Thomas, P. et al. 1996. The Surface of Deimos: Contribution of Materials and Processes to Its Unique Appearance. Icarus, 123, 536-556.
How to cite: Sugita, S., Nakahara, S., Vincent, J.-B., Michel, P., Kovács, G., Ernst, C., Barnouin, O., Miyamoto, H., Kikuchi, H., and Kueppers, M.: Geomorphology and Albedo distribution on the Anti-Mars hemisphere of Deimos observed with Asteroid Framing Cameras (AFC) on the Hera Spacecraft, EPSC-DPS Joint Meeting 2025, Helsinki, Finland, 7–13 Sep 2025, EPSC-DPS2025-1786, https://doi.org/10.5194/epsc-dps2025-1786, 2025.
On March 12, 2025, the ESA Hera mission performed a flyby of Mars on the way to its target, the binary asteroid system Didymos–Dimorphos. This event provided a unique opportunity to acquire spectral data (within the 0.65–0.96 micron wavelength range) and high-resolution images of the far side of the Martian moon Deimos. The observations were conducted using the HyperScout-H (HS-H) instrument, the hyperspectral imager aboard the Hera spacecraft. Simultaneously, the mission's other two instruments, the Asteroid Framing Cameras (AFC) and the Thermal Infrared Imager (TIRI), also collected data on this small, irregularly shaped natural satellite of Mars.
Fig.1 A false-color image of Mars and Deimos was generated for public outreach using observations acquired by the HS-H instrument. In this visualization, the color channels were shifted: blue corresponds to 0.65 µm, while red represents 0.96 µm. Deimos appears black due to albedo differences compared to Mars surface.
The composition and geomorphology of Deimos have remained unclear despite multiple observations acquired over recent decades. Images obtained by various Mars missions reveal a low-albedo object (~0.08), while spectra acquired from both Earth-based observatories and space missions resemble those of C-, X-, and D-type asteroids (e.g., Fraeman et al. 2014; Takir et al. 2021). Furthermore, Deimos is tidally locked with Mars, orbiting at 6.92 Mars radii on an almost circular orbit (eccentricity 0.00024), inclined at 1.79° (with respect to equatorial plane). These properties are the key point for understanding the origin of this natural satellite. The leading hypotheses are: (1) asteroid capture, suggested by its spectral similarity to carbonaceous asteroids; and (2) formation from a giant impact, supported by the regularity of its orbit (e.g., Kuramoto 2024 and references there in).
The HS-H instrument acquired three images of Deimos. The highest-resolution image (Fig. 1) was obtained when the spacecraft was at a distance of 1024 km from the object, at a phase angle of approximately 15°. Two additional lower-resolution images were captured before, from distances of 8800 km and 6200 km and at phase angles of 2–3°.
The HS-H instrument is based on a 5 × 5 pattern of narrowband filters (defining a macropixel) placed and repeated over the CMOS detector pixels (referred to here as subpixels). This configuration enables the instrument to sample the spectrum of each surface patch between 0.65 and 0.96 microns across 25 spectral channels. As a result, HS-H simultaneously captures both spectral and imaging data. The highest-resolution image achieved a spatial resolution of approximately 134 meters per subpixel and primarily covers the far side of Deimos, an area that had never before been imaged in these wavelengths.
The raw images were processed using the HS-H instrument pipeline. Calibrations included bias and dark current subtraction, flat-field correction, and conversion to radiance factor (RADF). The result for the high-resolution image is shown in Fig. 2. Additionally, photometric corrections were applied to account for varying illumination conditions. Spectra corresponding to each macropixel were retrieved and analyzed in relation to the geomorphological properties of the surface. The spectra were compared with those reported by other instruments for Deimos inner side, such as the Colour and Stereo Surface Imaging System (CaSSIS) aboard the ExoMars Trace Gas Orbiter mission. These results will be presented and discussed with regard to their implications for the history of Deimos.

Fig. 2 Radiance factor for each subpixel (note that subpixels correspond to different wavelength channels arranged in a 5x5 pattern).
References
1. Fraeman A. A., et al. (2014), Icarus, 229, 196–205. https://doi.org/10.1016/j.icarus.2013.11.021
2. Takir D., et al. (2022), Icarus, 371, 114691. https://doi.org/10.1016/j.icarus.2021.114691
3. Kuramoto K. (2024), Annual Review of Earth and Planetary Sciences, 52(1), 495–519. https://doi.org/10.1146/annurev-earth-040522-110615
How to cite: Popescu, M., de León, J., Prodan, G. P., Küppers, M., Kovács, G., Nagy, B. V., Grieger, B., Escalante López, A., Sugita, S., Kohout, T., Korda, D., Tatsumi, E., Lazzarin, M., Farina, A., Poggiali, G., Bickel, V. T., Raducan, S. D., Licandro, J., Palomba, E., and Michel, P.: Spectral Characterization of the Far Side of Deimos Using the HyperScout-H Instrument Aboard the ESA Hera Spacecraft, EPSC-DPS Joint Meeting 2025, Helsinki, Finland, 7–13 Sep 2025, EPSC-DPS2025-1250, https://doi.org/10.5194/epsc-dps2025-1250, 2025.
Background:
Despite extensive study, the Mars system still possesses many mysteries, one of which is the formation of its moons Phobos and Deimos. Several mechanisms have been proposed but weather the moons formed as re-accreted ejecta [1] or as captured asteroids [2]) remains a significant problem. The key to solving this is currently thought to be held in the analysis of Phobosian ejecta, with numerical models having predicted it to contain, on average, 255 ppm of Martian material contaminant [3,4], transported to Phobos via impact processes.
Whilst numerical investigations have provided ranges for the level of detectable Martian material on Phobos [3,4,5,6], laboratory investigations are required into both the level of Martian material predicted on the surface of Phobos and its assumed detectability. Whilst some studies have previously found distinguishing features during spectral analysis of Phobosian surface analogues [7], an experimental investigation utilizing complex geological mixtures is lacking. This study therefore performed an experimental test of the assumed detectability of Martian material through the use of a geologically complex ‘Martian’ projectile impacting a geologically complex Phobos simulant target.
Method:
The work presented here assumes the case of a captured asteroid origin for Phobos. It presents the results from a shot series aiming to quantify the level of projectile material detectable during post-shot analysis. Six shots were carried out using the one and two stage light-gas gun at the University of Kent[10,11] over the speed range of 650 m/s to 1600 m/s covering the lower end of speeds predicted for material impacting the surface of Phobos [5]. The projectiles were designed to maximize the quantity of projectile material reaching the target and were formed of a custom designed 3D-printed UV-cured resin shell (Figure 1) containing an Eu-doped MGS-1 (Martian simulant) [8] mixture.
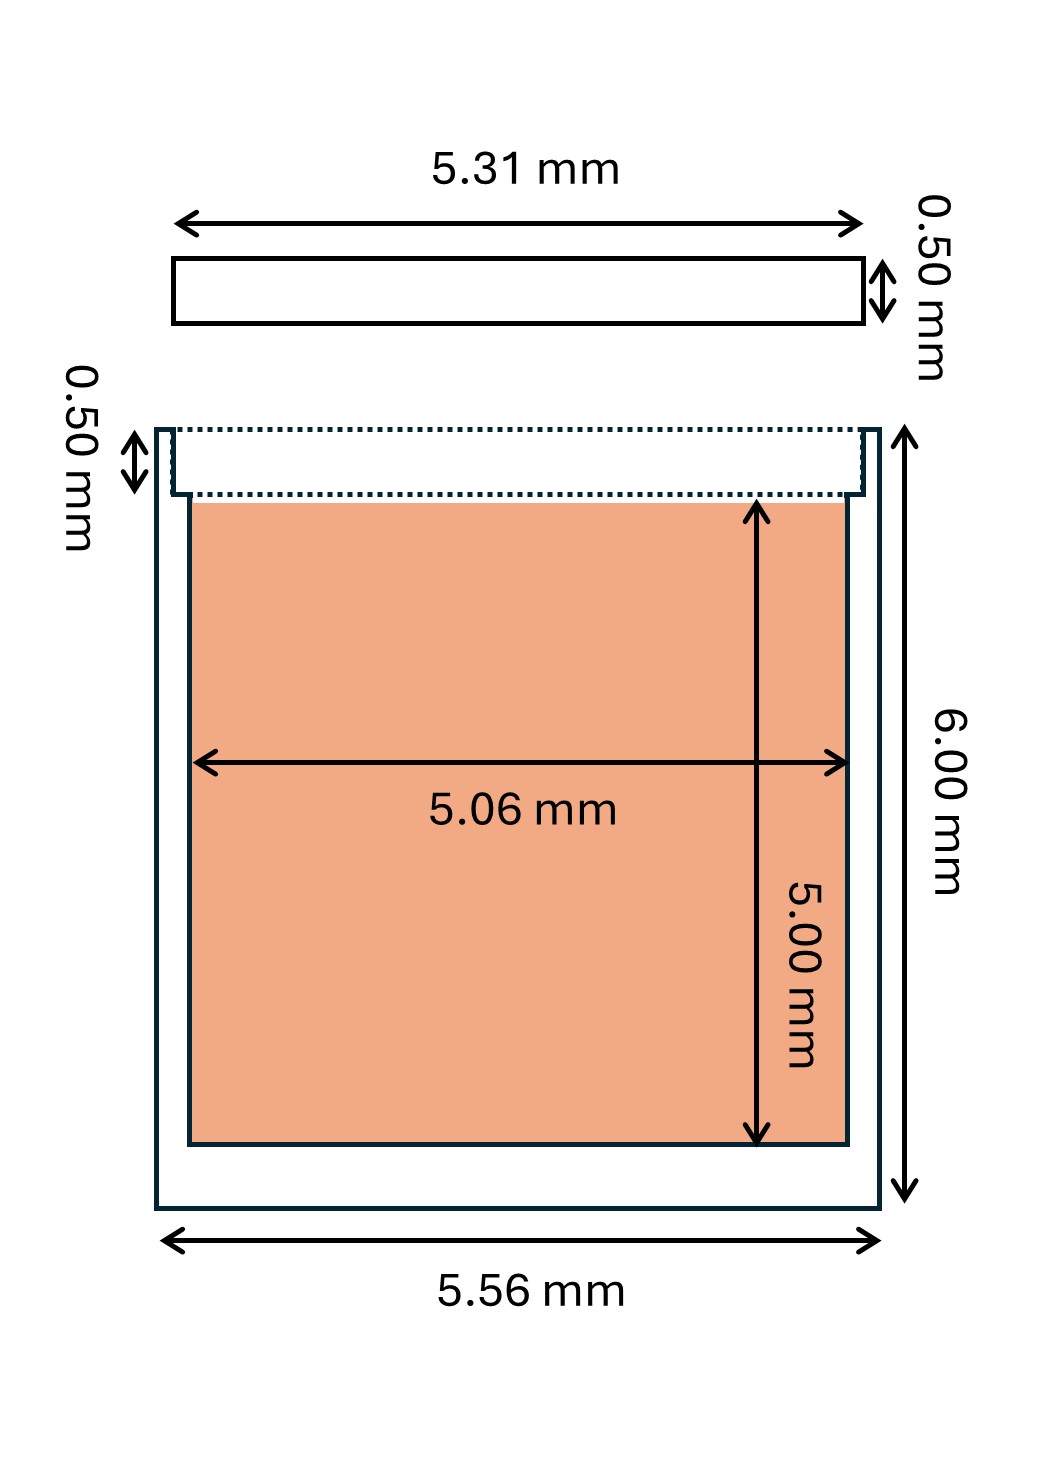
Figure 1: Schematic of the custom projectile shells for this investigation. The orange square in the schematic represents the projectile material.
This design of projectile allowed a geologically complex Martian simulant material to be used, with minimal preparation required, thus reducing chemical changes to the projectile. This was fired at cemented PCA-1 (Phobosian simulant) [9] target blocks (Figure 2) forming a geologically complex analogue of the Phobosian near-surface region. Targets were cubes with an average side length of 8.6 cm and depth of 5.8 cm. The average porosity was calculated to be 9.6% just is on the lower end of the current porosity range of 10-50% estimated for Phobos [1].
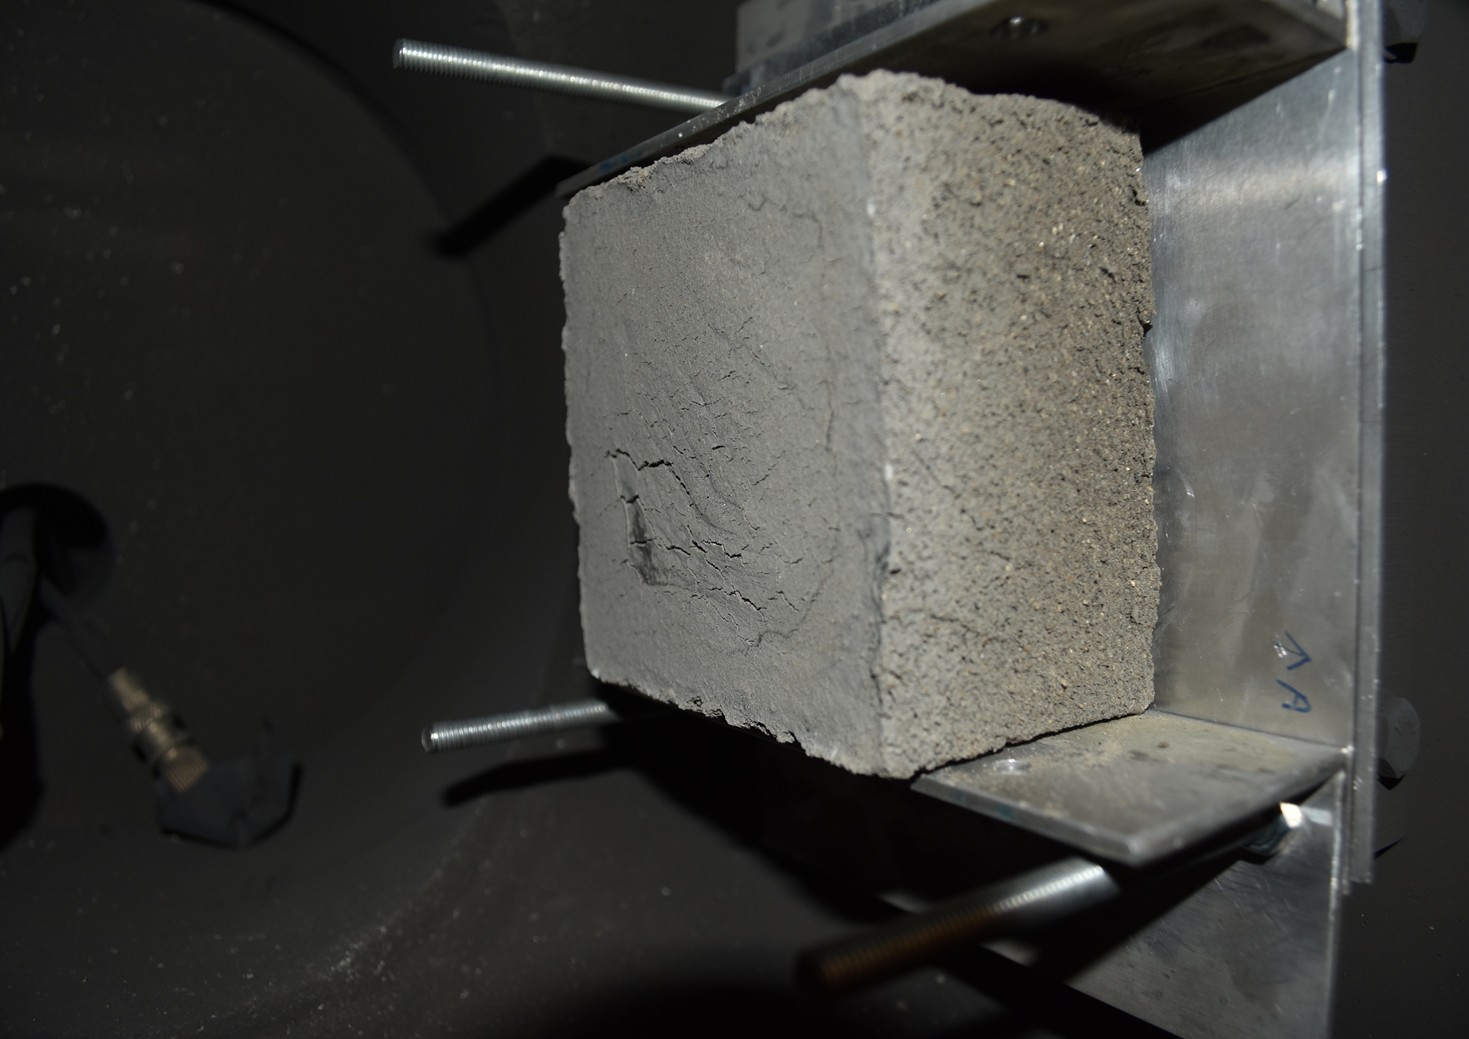
Figure 2: Pre-impact target within the Kent light-gas gun.
Post-shot analysis focused on two main questions: 1) can material from a Martian projectile be detected, and 2) can the level of detected material be quantified. For this, ejecta material was captured during each shot through the use of an ejecta capture cell. Not all of the ejecta from each shot was captured, but it is assumed that the material collected is representative of the entire population. Analysis was carried out on the ejecta sample and resultant impact crater separately, allowing the distribution of Martian contaminant material within the Phobosian regolith and the implantation of projectile material to be investigated separately.
Results and Discussion:
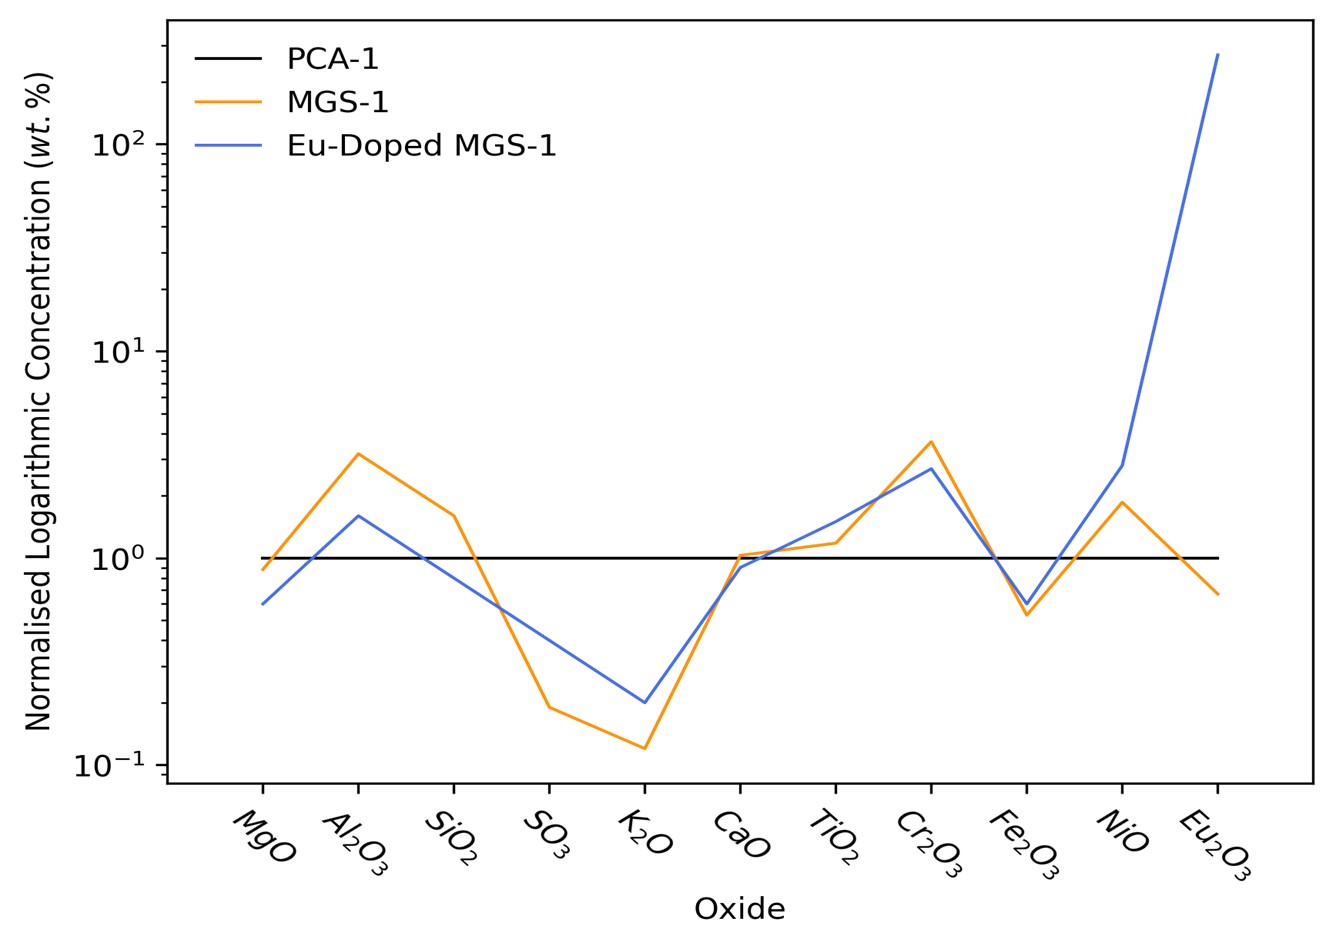
Figure 3: XRF results of pre-shot material. Values for each constituent are normalised to the values for PCA-1. The y-axis is presented as a logarithmic scale.
Collected ejecta samples were subjected to XRF, and XRD analysis, to both confirm and attempt to quantify the presence of projectile. To aid in the post-shot identification of projectile material, an elemental tracer (in the form of Eu(CH3CO2)3·XH2O) was included in the projectile. XRF analysis of the pre-impact material (Figure 3) shows clear differences between the PCA-1 and MGS-1 materials. Not only is the europium content of the projectile significantly higher than the background levels within the PCA-1 or MGS-1 simulants, characteristic variations between the two simulants (with differences being found between the measured K2O, Cr2O3, and NiO values) are also evident. Whilst the initial results show the clear presence of projectile material within the collected ejecta, further in-depth analysis is required to quantity its level. Initial observations of the impact features also shows the presence of projectile material (see Figure 4 and Figure 5).
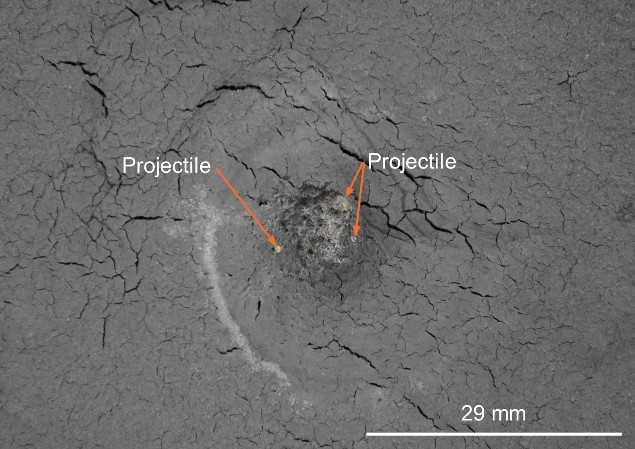
Figure 4: Formed impact feature from shot 2 showing potential projectile material embedded within the crater.
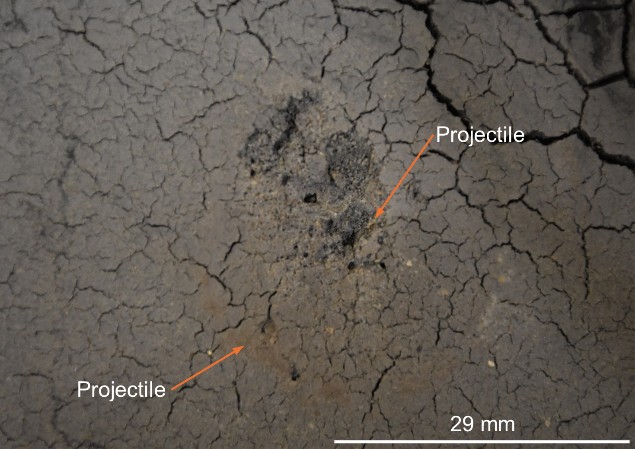
Figure 5: Formed impact feature from shot 6. During the shot the projectile broke-up prior to impact. Potential projectile debris is highlighted.
Conclusions:
This study has demonstrated the ability to effectively fire a geologically complex ‘Martian’ projectile and subsequently detect this material within the impact target and ejecta. A full analysis of the targets and ejecta is now underway, with the aim of quantifying the level of successful transfer of impactor to the target. If successful this would provide an experimental test of previous numerical studies investigating the formation of Phobos.
References:
[1] R.I. Citron, et al., Icarus 252, 334 (2015).
[2] K.R. Ramsley, J.W. Head, Space Sci. Rev. 217, 86 (2021).
[3] K.R. Ramsley, J.W. Head, PSS 87, 115 (2013).
[4] P. Thomas, Icarus 131, 78 (1998).
[5] L. Chappaz, et al. Astrobiology 12, 936 (2013)
[6] R. Hyodo, et al., Sci. Rep. 9, 19833 (2019).
[7] G. Poggiali, et al., MNRAS 516, 465 (2022).
[8] K.M. Cannon, et al., Icarus 317, 470 (2019).
[9] Z.A. Landsman, et al., Advances in Space Research 67, 3308 (2021).
[10] M. Price, et al. International Journal of Impact Engineering 184, 104828 (2024)
[11] R. Hibbert, et al., Procedia Engineering 204, 208 (2017)
How to cite: Finch, E., Wozniakiewicz, P., Tandy, J., Burchell, M., Sefton-Nash, E., Avdellidou, C., Alesbrook, L., Koschny, D., and Spathis, V.: The mysterious Martian potato: An experimental investigation into the origin of Phobos, EPSC-DPS Joint Meeting 2025, Helsinki, Finland, 7–13 Sep 2025, EPSC-DPS2025-1484, https://doi.org/10.5194/epsc-dps2025-1484, 2025.
The origin of Phobos and Deimos remains uncertain. Over the years, several hypotheses have emerged: an impact between Mars and a planetesimal (Craddock (2011)), accretion from a debris disc ( Hesselbrock and Minton (2017)) or an asteroid capture (Hunten (1979), Rosenblatt (2011)). In 2021, Bagheri et al. (2021) proposed that both moons are fragments of a larger progenitor. Indeed, based on tidal forces, the authors have integrated backwards the orbital elements of the two satellites from their current positions, showing that the orbits of the two satellites may have crossed in the past. This leads them to conclude on a common origin. Hyodo et al. (2022)) then showed, in a simplified dynamic framework, that the post-fragmentation orbital elements resulting from this integration do not allow the newly-formed fragments to survive to the present day. In fact, a destructive collision between the two fragments seems difficult to avoid within 10,000 years of their formation. Thanks to a large number of N-body simulations, we have extended these results with a more complex physical model. We confirm the results of Hyodo et al. (2022) by taking into account more realistic physics: the survival of Phobos and Deimos until the present day in the formation scenario proposed by Bagheri et al. (2021) is quite limited.
How to cite: Dahoumane, R., Baillié, K., and Lainey, V.: Origin of Phobos and Deimos : Plausibility of a Fragmentation Scenario, EPSC-DPS Joint Meeting 2025, Helsinki, Finland, 7–13 Sep 2025, EPSC-DPS2025-309, https://doi.org/10.5194/epsc-dps2025-309, 2025.
Abstract:
The formation of Martian moons is one of the most enigmatic in the solar system. Long considered to be asteroids captured by Mars, a giant impact origin has recently been proposed, motivated by the exploration of Phobos by Mars Express (Paetzold et al., 2025). The objective of this study is to review recent formation scenarios proposed within the framework of this giant impact hypothesis.
1- The formation of two small moons from a giant impact
The asteroid capture scenario fails to explain the current near-circular and near-equatorial orbits of both moons (e.g., Rosenblatt, 2011). Alternatively, the giant impact scenario naturally explains the near-equatorial orbits by forming the two moons in an impact-induced debris disk (Craddock, 2011). Rosenblatt et al. (2016) and Canup and Salmon (2018) have shown that it is possible to accrete two small moons of the mass of Phobos and Deimos into this debris disk, on either side of the synchronous boundary. However, these small moons have elliptical orbits, and to match the near-circular orbit of Deimos requires a tidal dissipation rate of its interior that is not consistent with a rocky composition (Rosenblatt et al., 2016). Moreover, the composition of these small moons should be a mixture of materials from Mars and the impactor, which is not consistent with a purely primitive composition as suggested by remote sensing data from the surface of Phobos and Deimos.
2- The question of primitive composition
The giant impact is expected to eject fully molten rocky material into Martian orbit, composed of similar amounts of Martian and impact materials (Hyodo et al., 2017). This mixed material crystallizes primarily into olivine and pyroxene phases (Pignatale et al., 2018), which have not yet been identified in the remote sensing data (e.g., Wargnier et al., 2025). However, the ejected material is also expected to contain a small amount of volatile compounds (Pignatale et al., 2018), depending on the impactor composition, which could mimic the remote sensing signature of a primitive composition.
Kegerreis et al. (2024) also proposed the disruptive capture of an asteroid by the planet's tidal forces, leaving a cloud of primitive material in orbit. However, the authors did not study the accretion of two small moons from this cloud.
3- The question of the long-term orbital evolution of the Martian moons
Bagheri et al. (2021) proposed a large tidal dissipation rate in the Martian system, leading to a faster orbital evolution of Phobos and Deimos. They found that both moons could be at the same distance from Mars 1–3 Gyr ago, suggesting that they could originate from the breakup of a single progenitor. Nevertheless, the origin of such a progenitor is not explained in this model and the breakup process yields to the formation of several smaller fragments instead of just two (Hyodo et al., 2022). However, such a large tidal dissipation rate merits revisiting the orbital evolution of two small bodies formed around Mars or even captured by Mars.
4- Could Phobos have formed after Deimos?
Under the giant impact scenario, Hesselbrock & Minton (2017) propose that Phobos could have formed after Deimos. In this model, Phobos would result from multiple cycles of a ring-moon system. This model is consistent with the overall shape of Phobos (Hu et al., 2020) and the slightly inclined orbit of Deimos above the Martian equator, which could reflect gravitational interaction with a larger, former inner moon (Cuk et al., 2020). Nevertheless, a faint dust ring is expected to remain around Mars today (Madeira et al., 2023), which has not been observed so far. Furthermore, the retention age of Phobos surface craters is as old as 4.3 Gyr (Schmedemann et al., 2014), which is inconsistent with a younger Phobos according to this model.
5- How could the Martian Moon eXplorer data help discriminate between these formation scenarios?
The sample collected at Phobos’ surface will provide determined its composition (Usui et al., 2020). However, this surface could be contaminated by ejecta from the Martian surface, making it difficult to distinguish between the impact debris disk model and the asteroid disruptive capture model. One solution to resolve this ambiguity is to measure the magnetic properties of the sample. Indeed, if the material forming Phobos is condensed in Martian orbit, it should record the strong magnetic dipole field of the early Mars (Rosenblatt et al., 2024). If the Circum-Martian Dust Monitor measured a low-dense ring of material around Mars (Kobayashi et al., 2019), this would support the ring-moon cycle model. The geodesy experiment will allow for better constraint on the internal structure of Phobos (Yamamoto et al., 2024), thus the modeling of its tidal dissipation properties. The MMx data will open the way to exciting research aimed at answering the following question: Is Mars capable of maintaining small accreted moons in orbit throughout its history, or even capturing asteroids, to ultimately form the current Martian lunar system?
References:
Bagheri A. et al. (2021) Nat. Astron. 5:539; Canup R. & Salmon J. (2018) Sci. Adv. 4 :4; Craddock, R.A. (2011) Icarus, 211:1150; Cuk M. et al. (2020) ApJ. Lett. 896:id.L28; Hesselbrock A.J. & Minton D.A. (2017) Nat. Geosci. 10:266; Hu X. et al. (2020) GRL 47; Hyodo R. et al. (2017) ApJ 845:125; Hyodo R. et al. (2022) 3:204; Kegerreis J.A. et al. (2024) arXiv :2407.15936v1; Kobayashi et al. (2019) EPSC-DPS 2019-1669; Madeira G. et al. (2023) Astron. J. 165:4; Paetzold M. et al. (2025) Space Sci. Rev., 221:41; Pignatale F.C. et al. (2018) ApJ 853:118; Rosenblatt P. (2011) A&A Rev. 19-44; Rosenblatt et al. (2016) Nat. Geosci. 9:581; Rosenblatt P. et al. (2024) COSPAR 0032-24; Schmedemann et al. (2014) Planet. Space Sci. 102:152; Usui T. et al. (2020) Space Sci. Rev. 216:49; Wargnier A. et al. (2025) A&A 694:A304; Witasse O. et al., (2014) Planet. Space Sci., 102:18-34; Yamamoto K. (2024) Earth, Planet. Spac. 76:id.86
How to cite: Rosenblatt, P.: A giant impact scenario to form the Martian moons?, EPSC-DPS Joint Meeting 2025, Helsinki, Finland, 7–13 Sep 2025, EPSC-DPS2025-329, https://doi.org/10.5194/epsc-dps2025-329, 2025.
Please decide on your access
Please use the buttons below to download the supplementary material or to visit the external website where the presentation is linked. Regarding the external link, please note that Copernicus Meetings cannot accept any liability for the content and the website you will visit.
Forward to presentation link
You are going to open an external link to the presentation as indicated by the authors. Copernicus Meetings cannot accept any liability for the content and the website you will visit.
We are sorry, but presentations are only available for users who registered for the conference. Thank you.
The two small satellites of Mars, Phobos and Deimos, have low-eccentricity obits close to the plane of the Martian equator, implying their in-situ formation (Burns, 1992). The most common proposed hypothesis for their origin is that the moons formed from debris ejected by a giant impact onto early Mars (Craddock, 2011; Rosenblatt and Charnoz, 2012; Citron et al., 2015; Rosenblatt et al., 2016; Hesselbrock and Minton, 2017; Hyodo et al., 2017; Canup and Salmon, 2018). Much is unknown about how the initial giant impact gave rise to the current moons, as Phobos (and any other more massive moons present in the past) likely experienced large-scale tidal evolution over the age of the Solar System. As Mars is a relatively slow rotator, all moons orbiting interior to the synchronous orbit at about 6 Mars radii (RM) orbit faster than Mars spins and tidally migrate inward (Deimos is just outside synchronous orbit, at 6.92 RM).
Hesselbrock and Minton (2017) (HM17) have proposed that Phobos is not primordial, but a product of ring-moon cycles over the age of the Solar System. According to HM17, successive generations of Martian moons formed from successive generations of rings. After forming at the outer edge of the rings (near the Fluid Roche Limit at 3.2 RM ), the moons migrate outward through interactions with the ring until the ring dissipates. When the ring torques become too weak to counter Martian tides, the moons migrate inward, until the Martian tides disrupt them at the rigid Roche Limit (at 1.6 RM ), forming the next generation of the Martian ring (cf. Black and Mittal, 2015). Each generation of moons is several times less massive than the previous, as inward tidal evolution drains angular momentum from the system, and the rest of the mass is accreted onto Mars.
One of the conclusions of HM17 was that, over several Gyr, mass many times larger than that of Phobos was deposited over the equatorial regions of Mars due to ring infall. So far, there have not been any claims of geological or geochemical features on Mars that would be related to this mass infall. Here we revisit the dynamics of the putative past ring of Mars and show that its evolution would have been complex and largely shaped by solar resonances.
During its past and future evolution Phobos crosses several solar semi-secular resonances (SSRs), in which a moon’s precession period is a multiple or a simple fraction of Mars’s heliocentric orbital period. Unlike mean-motion resonances in which capture can happen only during convergent evolution (Murray and Dermott, 1999), capture into eccentricity and inclination-type solar SSRs requires different directions of migration. When the planet’s oblateness is the dominant source of perturbation, a satellite’s orbit precesses faster as eccentricity grows (Danby, 1992), making capture into constant-precession-rate resonances possible during outward migration (e.g. evection resonance; Touma and Wisdom, 1998; Cuk and Stewart, 2012). However, inclined orbits precess more slowly than planar (Danby, 1992), making inward migration a requirement for capture into an inclination-type SSR. This has previously been confirmed numerically for the 2:3 SSR (Touma and Wisdom, 1998) and 2:1 SSR (Yokoyama, 2002; Yokoyama et al., 2005). The 2:1 SSR is of particular interest for modeling the future dynamics of inward migrating moons and rings resulting from their disruption.
Figure 1: The capture of a ring particle (or a moon) into the 2:1 solar semi-secular resonance, at about 2.15 RM. As the particle's orbit is shrinking, it is moving right to left in the plot. At this distance the apsidal and nodal precession periods are 0.5 martian years. The particle's orbit is captured into the resonance and the inclination keeps increasing as the particle drifts closer to Mars. This resonance was first described by Yokoyama et al. (2005), so we refer to it as the Yokoyama resonance.
Yokoyama et al. (2005) find that Phobos is very likely to be captured into the 2λM +Ω−3ΩEq harmonic of the 2:1 SSR at 2.15 RM (“Yokoyama resonance”), where λM is the mean longitude of Mars,Ω is the longitude of the node of the moon (or a dust particle) and ΩEq is the longitude of Mars’s equinox. We confirm the general process using our integrator SIMPL in the simulation shown in Fig. 1. A particle migrating inward relatively rapidly (on sub-Myr timescales) is captured into the Yokoyama resonance, and its inclination grows over time as it maintains a constant nodal precession of half a Martian year as its semimajor axis continues shrinking. The bottom panel in Fig. 1 shows the equivalent semimajor axis, if the particle were to damp onto a planar orbit while conserving orbital angular momentum (as in collisions within a ring). But the equatorial angular momentum is proportional to the cosine of inclination and the square root of semimajor axis, so we can see that by the time inclination within the resonance reaches about 45 deg, the equivalent planar semimajor axis is within the planet. The physical meaning of this result is that, if the resonance is broken and particles formerly in the resonance are allowed to collide, they will impact Mars before managing to form a thin ring. For the angular momentum seen at the end of the simulation in Fig. 1, particles will have inclinations of about 26 deg when impacting Mars.
We will present more in-depth explorations of both the exact distance at which we expect the disruption of Phobos (and its putative forebears) and the fate of martian ring particles under the influence of solar resonances.
How to cite: Cuk, M., Agrusa, H., Anand, K., and Minton, D.: Dynamics and Fate of the Past Martian Rings, EPSC-DPS Joint Meeting 2025, Helsinki, Finland, 7–13 Sep 2025, EPSC-DPS2025-139, https://doi.org/10.5194/epsc-dps2025-139, 2025.
Introduction :
The upcoming MMX (Martian Moon eXploration) mission [1] will carry the MIRS instrument (MMX Infrared Spectrometer, [2]) designed to investigate the surface composition of Mars’ moons, Phobos and Deimos. As airless bodies, these moons are subject to various space environment-induced alteration processes collectively referred to as space weathering. Space weathering encompasses a range of phenomena - including micrometeorite impacts and irradiation by solar wind and cosmic ray particles - that modify the optical, chemical, and mineralogical properties of surface materials. Gaining insight into how these processes alter the spectral signatures of airless bodies is essential not only for understanding the long-term evolution of these objects but also for accurately interpreting compositional data obtained through remote sensing. In this study, to support future MIRS observations, we investigate in the laboratory the effects of both micrometeorite bombardment and irradiation by charged particles on a basalt sample, analogous to the expected surface composition of Phobos and Deimos.
Sample :
The sample used is an unweathered fine-grained basalt from a lava flow of Pic d’Ysson (Massif Central, France). Originally used as a lunar simulant analog, this fresh tholeiitic basalt is fully crystallized and contains some phenocrysts of olivine (forsterite), pyroxene (diopside), and plagioclase (anorthite) along with magnetite [3]. It is slightly aqueously altered, as shown by its only ~1% water content [4]. The largest grains are composite polycrystalline regular blocks with a rough aspect and some visible shiny facets of phenocrysts. The basaltic rock Ysson was crushed and sieved to limit the fraction of the powder to grain sizes below 250 μm, and finally compacted to obtain several indurated pressed pellets (10 to 13 mm diameter).
Laser irradiation :
To simulate micrometeorite impacts, we carried out nanosecond pulse-laser experiments on a first pellet of Ysson basalt using the Laser-Induced Breakdown Spectroscopy (LIBS) suite of the SuperCam instrument spare [5, 6, 7] in Toulouse, France. We expect that the impact velocity of micrometeorites on the surface of Phobos can range from 8.5 to 15 km.s−1 [8]. Micrometeoroid impact at ∼10 km.s−1 of dust (1 μm in size) delivers an energy equivalent to 32 J.cm−2, which is roughly equivalent to the energy provided by one laser shot with SuperCam (14mJ over 0.25mm2). The samples are located in a vacuum chamber, enabling to reach a pressure of around 10−3 mbar and approach the low oxygen fugacity conditions at the surface of the martian moons. Two grids of 10x10 points of one and three laser shots were realized. After laser irradiation, the sample was characterized using an Agilent micro-spectrometer equipped with a Focal Plan Array (128x128 pixels) detector installed at the SMIS beamline of the SOLEIL synchrotron in France [9], to study mid-IR spectral properties (2.5-12.5 μm). The projected pixel size on the focal plane was 5.5 μm and the field of view was 700 µm .
Ion irradiation :
We also irradiated an Ysson basalt pellet with ions to simulate other space weathering components. We used the INGMAR vacuum chamber allowing to monitor in situ the Visible to Near-InfraRed (VisNIR from 0.5 to 4 μm) reflectance spectroscopy during ion implantation on the SIDONIE ion separator (JANNuS-SCALP platform of IJCLab, Orsay). A first pellet of Ysson basalt was irradiated with He+ at 20 keV and ion flux of 1013 ions/(s.cm2) to simulate solar wind as in previous experiments within our team [10,11]. Several steps of irradiation were performed to reach a final ion fluence of 1.1017 ions/cm2. A second pellet was irradiated with O+ at 30 keV (with same flux and fluencies as He+) to simulate implanted particles at the surface of Phobos that previously escaped from Mars’ atmosphere [12, 13] and may contribute to spectral modifications with time. The same mid-IR characterization at SOLEIL than for the lasered pellet was also performed.
Results and conclusion :
Preliminary analysis of the data indicates that laser irradiation of the Ysson basalt (Figure 1) results in an overall decrease in reflectance within the 2.5–12.5 μm spectral range, along with a significant change in the Christiansen and Reststrahlen bands. Ion irradiation similarly causes a decrease in reflectance in the visible to near-infrared (VNIR) wavelength range. Further analyses are currently underway, including VNIR micro-spectroscopy on laser-irradiated samples. The resulting datasets will be compared to assess and distinguish the effects of these two space weathering processes within overlapping spectral domains, and will be presented during the meeting.
Figure 1 : Stereo microscope image of the first sample irradiated with a nanosecond pulse-laser (1 and 3 shots). The image on the right shows a zoomed-in version of the 3-shot grid (red square).
References :
[1] Kuramoto, K. (2024), Annual Review of Earth and Planetary Sciences, 52.
[2] Barucci, M. A., et al., (2021), Earth, Planets and Space, 73, 1-28.
[3] Granier, J., et al., (2025), Acta Astronautica, 226, 66-77.
[4] Berger, G., et al., (2019), Icarus, 329, 8-23.
[5] Maurice, S., et al., (2021), Space Science Reviews, 217, 1-108.
[6] Wiens, R. C., et al., (2021), Space Science Reviews, 217, 1-87.
[7] David, G., et al., (2024), Copernicus Meetings.
[8] Miyamoto, H., et al., (2021), Earth, Planets and Space, 73, 1-17.
[9] Brunetto, R., et al., (2018), Planetary and Space Science, 158, 38-45.
[10] Caminiti, E., et al., (2024), Icarus, 420, 116191.
[11] Lantz, C., et al., (2024), The Planetary Science Journal, 5(9), 201.
[12] Nénon, Q., et al., (2021), Nature Geoscience, 14(2), 61-66.
[13] Lillis, Robert J., et al., (2017) Journal of Geophysical Research: Space Physics 122.3: 3815-3836.
How to cite: David, G., Lantz, C., Brunetto, R., Lasue, J., Nénon, Q., Pinet, P., Barucci, A., Nakamura, T., Le Mouelic, S., and Fau, A.: Laser and ion irradiations of Ysson basalt to simulate space weathering on Phobos and Deimos, EPSC-DPS Joint Meeting 2025, Helsinki, Finland, 7–13 Sep 2025, EPSC-DPS2025-269, https://doi.org/10.5194/epsc-dps2025-269, 2025.
Deriving quantitative regolith properties from photometric remote sensing data remains a challenge. Many photometric models are empirical, where the parameters lack direct physical interpretation. Although Hapke models have parameters that correspond to physical properties of the regolith, they suffer from other issues such as parameter degeneracy (where different physical properties can explain the same behavior) or the fitting algorithm getting stuck in local minima. To reliably interpret remote sensing data, one can validate the findings by reproducing the observed photometric behavior in laboratory. One such study was recently performed by Wargnier et. al. (2024), where they found the single-scattering albedo (SSA) of Phobos simulants to be 3-6 times higher than the observation made by Fornasier et. al. (2024) and Simonelli et. al. (1998) based on Mars Express/HRSC and Viking clear filter images, respectively. However, a closer match with remote sensing observations may be achieved by using wider grain size distributions or higher porosity.
In preparation for the upcoming Martian Moons eXploration (MMX) mission to Phobos, multiple new Phobos regolith simulants have been developed for testing purposes [4,5]. A primary objective in preparing these simulants has been achieving spectroscopic similarity to the observations made during previous space missions. However, due to limited knowledge of some key physical properties like particle size distribution, packing density, and surface roughness, they are not tightly constrained in the simulants. Miyamoto et al. [4] prepared three different grain size models for the University of Tokyo Phobos Simulant (UTPS) - a) resembling lunar surface regolith, b) resembling possible regolith of the smooth area of Itokawa, and c) an intermediate distribution between models (a) and (b). While Wargnier et al. [1,4] used different grain size ranges for sample preparation and subsequent analysis, their focus was mainly on the detectability of hydrated minerals and organic bands. Despite these efforts, the effect of different grain size distributions, packing densities, and surface roughness on the photometric behavior of Phobos simulants has yet to be systematically investigated.
We conduct an extensive photometric analysis of the UTPS simulant using the PHIRE-2 (PHysikalisches Institut Radiometric Experiment - 2) radio-goniometer at the University of Bern. This instrument is particularly well suited for studying dark samples (like UTPS) and allows observations at phase angles as low as 0.5 degrees [6]. Our study compares the photometric behavior of samples with varying grain size distributions and packing densities against observations from the Mars Express/HRSC. We also plan to investigate wavelength dependency on the photometric properties to assess if the observed red/blue spectral dichotomy on Phobos can be attributed to differences in physical characteristics. These experiments will help us better interpret the observations from Mars Express/HRSC and should give us a more comprehensive understanding of the regolith properties of Phobos.
References:
1. Wargnier, A. et al. (2024), "Spectro-photometry of Phobos simulants: I. Detectability of hydrated minerals and organic bands", Icarus v241, 116216, doi: 10.1016/j.icarus.2024.116216
2. Fornasier, S. et al. (2024), "Phobos photometric properties from Mars Express HRSC observations", A&A, 686, A203, doi: 10.1051/0004-6361/202449220
3. Simonelli, D. et al. (1998) "Photometric Properties of Phobos Surface Materials from Viking Images", Icarus 131(1), p. 52-77, doi:10.1006/icar.1997.5800
4. Miyamoto, H. et. al. (2021), "Surface environment of Phobos and Phobos simulant UTPS", Earth Planets Space 73, 214, doi: 10.1186/s40623-021-01406-3
5. Wargnier, A. et.al. (2023), "Development of a new Phobos spectral simulant: spectral properties from visible to the mid-infrared range", MNRAS v524-3, p3809–3820, doi: 10.1093/mnras/stad2132
6. Jost et. Al. (2016), "Experimental characterization of the opposition surge in fine-grained water–ice and high albedo ice analogs", Icarus v264, 109-131, doi: 10.1016/j.icarus.2015.09.020
How to cite: Keshav, N., Schröder, S., Pommerol, A., and Hagermann, A.: Experimental investigations of the photometric properties of Phobos simulant , EPSC-DPS Joint Meeting 2025, Helsinki, Finland, 7–13 Sep 2025, EPSC-DPS2025-623, https://doi.org/10.5194/epsc-dps2025-623, 2025.
Introduction
The martian moons Phobos and Deimos are the main target of the Martian Moons eXploration mission (MMX). The mission will depart from Earth in October 2026, and arrive around Mars in 2027. Phobos and Deimos orbit Mars at respectively 9400 and 23000 km [2], with low inclinations and eccentricities. The moons present strongly processed surfaces and host a fine regolith [15]. Spectroscopic observations in the Visible and Near-Infrared (Vis-NIR) display dark and red flat spectra [12].
Because of their shape, spectral properties and orbital parameters, their origins is yet to be understood. The proposed hypothesis regarding their formation stipulate that they could result from the capture of D-type asteroids [12] or that they may results from an impact [3, 12].
Despite they share important spectral similarities with D-type asteroids, their peculiar orbits (low inclination and eccentricity) are difficult to reconcile with a gravitational capture scenario; but are compatible with an impact origin.
The mission MMX [10] hence aims to study closely Phobos and Deimos compositions relying on MMX Infrared Spectrometer (MIRS) observing across a spectral range of 0.9 to 3.6µm [1]. At a distance of 1.5 a.u., the moons' surfaces are warm enough [8] to emit a significant thermal flux, especially beyond 2µm resulting in a spectral distortion after 2.5µm. This work presents a method adapted from previous works [6, 10] to characterise the surface temperature of the martian moons in preparation of MIRS data interpretation.
Illumination at the moons surface
Because of their small size and the absence of atmosphere, Phobos and Deimos surface temperatures are solely driven by the flux absorbed at the surface.
Thus, we developed a simulation that computes the flux reaching the surface of the moons over one orbit around the Sun. It relies on the SPICE/NAIF toolkit and the shape models by [16] to computes the distance and the viewing geometry at the moons surfaces. Consequently the incident flux at a given location at the surface varies with the solar distance, the eclipses, the orientation of the satellite, and the thermal emission of Mars.
Solving heat equations
A thermophysical model [6,10] solves the 1-D time-dependent heat equation for each point of the incident flux map previously computed. The model takes as input the surface properties: the porosity p, the grain size Dg, the bulk density ρ and the thermal conductivity of the non-porous material κm. Considering the absence of atmosphere of the martian moons the model does not consider convection, but consider the heat exchange by conduction and radiation inside the surface. This conduction is described by the effective conductivity κeff computed from the surface texture (Dg, p,) and thermal (Cp, κm) properties with [14] model.
Concerning self-heating
This self-heating represents the mutual irradiation between two surface elements as their temperature is warm enough to emit a significant flux in the IR. As the self-heating influences the temperature and thus itself, we simulate this self-heating several times and reinject the previous estimation in the thermal model until the self-heating flux converge – which happens after 2 iterations. This mutual heating is specifically important in the craters and adds up to 35 W.m-2 to the surface.
Thermal emission of a rough surface
We adopted the method from [5] to estimate the flux from a rough surface. Therefore, we compute the temperature of a large number of sub-resolution elements by modulating the incoming flux by a tilting angle estimated from Hapke’s mean slope parameter derived in [7]. The surface emission is thus only the averaged sum of all the sub-resolution elements contribution.
Removing thermal emission in NIR spectra

Figure : a) CRISM data and best fitted thermophysical model. b) Comparison of CRISM data corrected with [4] and this work.
To test our model, we simulated NIR synthetic data in the MIRS spectral range using outputs of our models, on which we added a reflective component - estimated from the Hapke model [9], and the solar flux scaled to the martian orbit – and gaussian noise. To remove the thermal emission from a NIR spectrum, the pipeline computes thermal emission, the reflective component and adjust the grain size and the porosity to fit the data. We were able to perfectly remove the thermal emission.
Moreover, when incorporating absorption feature in the synthetic data, we could test the sensitivity of the correction to the presence of bands, which is revealed pretty robust unless the bands lies in the thermal emission range. In addition, this method does not deform the band shape and therefore allows for a precise measurements of their depths. As a second test of the model, we tried to fit the NIR measurement from CRISM hyperspectral observations and compared to another method of iterative black-body fitting from [4]. The residual slope after the corrections is minimal and 4 times smaller than the one after [4], but after 3µm the noise in the data is too large to assess of the presence of any spectral feature.
Perspectives
We developed a pipeline to support the analysis of the future MIRS data, dedicated to estimating the surface temperature of martian moons and remove the thermal emission from the spectral observations. This approach is strongly dependent on the surface properties, necessitates a previous knowledge of the surface and is computationally hungry, but gives promising results and is not dependent to the data. Thus it can be used as support to closely monitor the presence of absorption features at Phobos surface. As the model computes the temperature profile down to 10 thermal skin depth (~10m on Phobos), it is potentially possible to derive the sub-surface texture from spectral measurements in the NIR-MIR like PFS data.
References
[1]Barucci+2021
[2]Burns+1978
[3]Craddock+2011
[4]David+2024
[5]Davidsson&Rickman2014
[6]Ferrari+2006
[7]Fornasier+2024
[8]Giuranna+2011
[9]Hapke2012
[10]Kuramoto+2022
[11]Leyrat+2011
[12]Rivkin+2002
[13]Rosenblatt+2016
[14]Sakatani+2017
[15]Thomas+1979
[16]Willner+2014
How to cite: Sultana, R., Yumoto, K., Wargnier, A., Leyrat, C., and Barucci, M. A.: Modelling Martian Moons Surface Temperature – an update, EPSC-DPS Joint Meeting 2025, Helsinki, Finland, 7–13 Sep 2025, EPSC-DPS2025-674, https://doi.org/10.5194/epsc-dps2025-674, 2025.
Introduction:
The Martian moons exploration, MMX, is JAXA’s sample return mission targeting the two Martian moons Phobos and Deimos and is scheduled to launch in 2026 to return samples from Phobos to Earth in 2031 [1]. The main scientific goal of the mission is to determine the origin of Phobos and Deimos and to investigate the evolution of the Martian moons. MMX will study the Martian system for 3 years and perform close-up observations of Phobos, while carrying out multiple flyby’s of Deimos. Finally, the mission will collect samples from Phobos before returning to Earth.
The MMX Rover IDEFIX [2] is one of the MMX payloads and will investigate Phobos in-situ using a suite of scientific instruments comprised of a pair of stereo navigation cameras, another two cameras mounted underneath the rover to study the wheel-regolith interaction, a Raman spectrometer to study the mineralogical composition of Phobos’ surface material, and the miniRAD radiometer to study the material’s thermophysical and mineralogical properties.
The miniRAD Instrument:
The miniRAD Radiometer's purpose is to measure the surface brightness temperature on the surface of Phobos in six infrared wavelength channels between 4.5 µm and 60 µm.
It houses six thermopile sensors, equipped with individual IR-filters to fulfill specific scientific measurement goals. These are:
- Determination of surface brightness temperature over a full day-night cycle on several spots on the Phobos’ surface.
- Determination of surface thermal inertia of Phobos’ regolith and boulders
- Estimation of the central wavelength of a suspected Christiansen feature
- Determination of the mm to cm-scale surface roughness.
Figure 1: minRAD sensor head and PEEK mounting bracket attached to a heat sink in preparation for TVAC test
The thermopile sensors are situated inside the sensor head having a radiation shield, reflective coating and heaters for temperature control. To decouple the sensor head thermally from the rest of the hopper, the head is attached to the rover using PEEK brackets. (Fig. 1)
A low-thermal conductivity flex harness connects the sensor head to the avionics box located inside the Structural and Electrical Model of IDEFIX.
Calibration: We describe the relation between target temperature T and the signal voltage U by a form of the Sakuma-Hattori interpolation equation
U = R * exp(- c_2/(A*T+B)) - R * exp(- c_2/(A*T_S+B)) + S_H*P_H + U_off
where c_2 is the second radiation constant while R, A, B, S_H and U_off are adjustable parameters. P_H is the heating power used to stabilize the sensor head at the chosen setpoint, and the factor S_H corrects for the instrument background radiation slightly varying with P_H.
minRAD underwent radiometric calibration in a vacuum chamber equipped with an LN2-cooled large aperture cavity blackbody. The sensor head was placed inside a temperature-controlled aluminum box representing the thermal environment while viewing the blackbody.
By varying the blackbody temperature from 100-330 K and the box temperature between 200 K and 280 K the five calibration coefficients could be fitted for each thermopile channel. The estimated uncertainty of the brightness temperature measurement (using the broadband filters), including systematic disturbances, is 5 K for a target temperature of 100 K and the uncertainty of the narrowband channels is < 1 K for dayside temperature > 250 K.
Figure 2: Brightness temperatures inverted during calibration and deviation from blackbody temperature.
How to cite: Knollenberg, J., Grott, M., Hamm, M., Ziese, R., Ihring, A., and Biele, J.: The miniRAD Radiometer For The IDEFIX Rover on Martian Moons eXploration, EPSC-DPS Joint Meeting 2025, Helsinki, Finland, 7–13 Sep 2025, EPSC-DPS2025-1441, https://doi.org/10.5194/epsc-dps2025-1441, 2025.
Introduction: The origins of Mars' moons, Phobos and Deimos, remain uncertain, with two main hypotheses under consideration: formation from debris following a high-energy impact between Mars and an asteroid [1], or capture of primitive asteroids [2]. To address this, JAXA's Martian Moons eXploration (MMX) mission aims to return samples from Phobos by 2031 [3]. The characterisation of these samples will determine the origin of Phobos.
To ground-truth remote observations of Phobos, we have used X-ray diffraction (XRD), and Fourier transform infrared (FTIR) reflectance spectroscopy to characterise the bulk mineralogy and IR spectral properties of ureilites, carbonaceous and ordinary chondrites, the composition of which could be indicative of a captured asteroid [4], and Martian meteorites that could represent a collisional formation. By acquiring XRD and IR data from the same material, mineral abundances can be directly correlated with features in reflectance spectra [5]. When MMX reaches Phobos, meteorite data collected in the laboratory will play a crucial role towards interpreting the mineralogy and composition of materials on its surface.
Methods: We have characterised the mineralogy and spectral properties of six CM (Mighei-like) carbonaceous chondrites, Tarda (C2-ung), the CO (Ornans-like) chondrite Kainsaz, a range of shock darkened ordinary chondrites (mostly falls) including L4-6, and H5-6, four CR2 chondrites, four ureilites, Martian meteorites Nakhla and Tissint, and a Tagish Lake (C2-ung) based simulant created by the University of Tokyo, known as UTPS-TB [6]. For the meteorites, chips of approximately 200 mg were ground to produce powders with grain sizes of less than 40 microns. The UTPS-TB sample came in a powdered form which was ground to the same grain size as the meteorites.
Diffuse reflectance spectra (1.7 - 50 μm) were collected using a Bruker VERTEX 70V FTIR spectrometer at the University of Oxford Planetary Spectroscopy Facility. Spectra were calibrated at the start of each measurement day and between measurements of samples using a gold standard. The powdered sample was measured under a vacuum to reduce terrestrial atmospheric contributions.
XRD patterns of the same powders were collected using an INEL X-ray diffractometer with a position-sensitive detector at the Natural History Museum, London. Around 50 mg of powdered sample was measured for 16 hours to achieve good signal-to-noise. Measurements of well-characterised standard minerals were collected for 30 minutes and compared with meteorite patterns to identify minerals and quantify their abundance in the sample [e.g. 7].
Results & Discussion: The mineralogical and spectral characteristics of meteorites in this investigation are compared the reflectance spectra of Phobos’ surface. The CR chondrites are primitive, containing both anhydrous silicates (e.g. olivine and pyroxene) and aqueous alteration phases such as phyllosilicates, carbonates, magnetite, and sulfides. Their albedo is ~3-5% reflectance with a weak red slope in the visible to near-infrared (VNIR). The CRs have a 3 μm hydration band, due to partial aqueous alteration. Their low VNIR reflectance, red-sloped continuum, and weak 3 μm spectral absorption feature is like that of Phobos, supporting the captured asteroid origin theory. The CM chondrites share similar spectral features but have a lower albedo and a stronger μm hydration band, corresponding to a higher phyllosilicate composition.
The ureilites are achondritic ultramafic meteorites containing olivine, pyroxene and carbon phases. These samples have a low albedo (~6-15% in VNIR) due to their opaque carbonaceous composition. However, their VNIR spectra are blue-sloped, inconsistent with Phobos’ red-sloped spectra. Ureilites are also anhydrous and therefore lack the 3 μm hydration band seen in Phobos spectra. Their low reflectance and feature-poor spectra could resemble Phobos, however there is a significant difference in spectral slope and hydration features. Therefore, Phobos were composed of ureilitic material, its surface would need to be significantly modified by space weathering.
Martian meteorites Nakhla (a nakhlite) and Tissint (a shergottite) have mineralogical and spectral features consistent with their basaltic origin. XRD measurements of these meteorites are dominated by pyroxene (augite, pigeonite), and olivine, consistent with their origin in the Martian crust. Their reflectance spectra have relatively high albedo, mafic absorption bands at ~1 and 2 μm, and a lack of hydration features. These features are inconsistent with the spectra of Phobos, which lack 1 or 2 μm bands and show significantly lower reflectance.
CR and CM chondrites are the closest spectral match to Phobos from the samples studied. Their low albedo, red-sloped, hydrated spectra are consistent with surface measurements of Phobos. Ureilites share low reflectance but differ significantly in slope and hydration, while Martian meteorites differ in more spectral characteristics. These results support the interpretation that Phobos is composed of primitive, carbon-rich material, likely of outer solar system origin, and favour a capture scenario over a collisional formation from Martian ejecta. The similarities between the carbonaceous chondrites and Phobos indicates that the Martian moons may be captured asteroids and further demonstrates the importance of the MMX mission sample return for solving the mystery of their origin definitively.
References: [1] R. Citron et al. (2015) Icarus 252:334-338. [2] M. Pajola et al. (2013) The Astrophysical Journal 777:127. [3] K. Kuramoto et al. (2022) Earth, Planets and Space 74:12. [4] K. D. Pang et al. (1978) Science 199(4324):64-66. [5] H. C. Bates et al. (2023) Meteoritics & Planetary Science 1-23. [6] H. Miyamoto et al. (2021) Earth, Planets and Space 73:1-17 [7] G. Cressey et al. (1996) Powder Diffraction 11:35-39.
How to cite: Branagan-Harris, E., Bowles, N. E., King, A. J., Shirley, K. A., Bates, H. C., and Russell, S. S.: Investigating Phobos' Origin using X-ray Diffraction and Reflectance Spectroscopy of Meteorites., EPSC-DPS Joint Meeting 2025, Helsinki, Finland, 7–13 Sep 2025, EPSC-DPS2025-1539, https://doi.org/10.5194/epsc-dps2025-1539, 2025.
While there has never been a dedicated spacecraft mission to Deimos, several Mars-focused spacecraft have imaged the small moon. The spacecraft orbits, number of imaging opportunities, and tidally locked state of Deimos have limited the spatial coverage of the surface. The anti-Mars side, in particular, has had few imaging opportunities. The first Deimos shape model to resolve geologic features (Ernst et al., 2023) was created with the stereophotoclinometry method (Gaskell et al., 2008, 2023) using 332 images from cameras on five spacecraft (four missions): the Viking Orbiter Visible Imaging Subsystem (VIS) (four cameras, two on each spacecraft, Viking Orbiter 1 and 2), the Mars Global Surveyor (MGS) Mars Orbiter Camera (MOC) narrow-angle camera, the Mars Express (MEX) High Resolution Stereo Camera super resolution channel (hereafter, SRC), and the Mars Reconnaissance Orbiter (MRO) High Resolution Imaging Science Experiment (HiRISE). All of those data are publicly available, through either the NASA Planetary Data System or the European Space Agency Planetary Science Archive. (Images taken by the Emirates eXploration Imager (EXI) on board the Hope probe were acquired after the construction of the Deimos shape model and were not included in that effort; the images would significantly improve the anti-Mars side of the model, but are not publicly available.)
The global shape model of Deimos has a ground sample of 20 m, though most of the images used to make the model were of coarser resolution. Figure 1 illustrates the limbs and SPC maplets (localized digital terrain maps) that were used to construct the model. Although some regions of Deimos still lack good limb observations, the bulk of its shape has been well constrained by limbs. About half of the body was imaged sufficiently to support the construction of SPC maplets, which allow the topographic modeling of geologic features and provide additional fidelity to the overall shape of the moon. This Deimos shape model and with co-registered images from Viking and SRC are available publicly in the Small Body Mapping Tool (SBMT; sbmt.jhuapl.edu).
On 12 March 2025, the Hera spacecraft performed a Mars flyby on its way to rendezvous with the asteroid Didymos (Michel et al., 2022). During the flyby, the Asteroid Framing Cameras (AFC) acquired several images of Deimos, centered on its anti-Mars hemisphere. The best six images captured Deimos at pixel scales ranging from 86–111 m (in family with most of the SRC images used in the model) and phase angles ranging from 13–17º. These images are well suited to detect albedo information, but are less useful for morphological assessments. Figure 2 shows a comparison between the outlines of Deimos in one of the highest-resolution AFC images and of the current shape model rendered to match the image. The side of the shape that was well-constrained matches well with the image. The side that was poorly constrained differs, showing that the AFC images can help to improve our knowledge of Deimos’s bulk shape and volume.
We have co-registered the highest-resolution AFC images to Viking images that were part of the solution for the current shape model and have started to incorporate the AFC images into SPC maplets of the anti-Mars side of Deimos. Figure 1 shows the areas of the model where the AFC images have provided new limbs and additional SPC maplet coverage. We will present an updated shape model of Deimos that incorporates the AFC data. We will discuss changes relative to prior shape models and address any subtle changes in the bulk physical attributes of the object, in preparation for the arrival of JAXA’s Mars Moon eXploration mission (Kuramoto et al., 2022) that will observe both Phobos and Deimos.
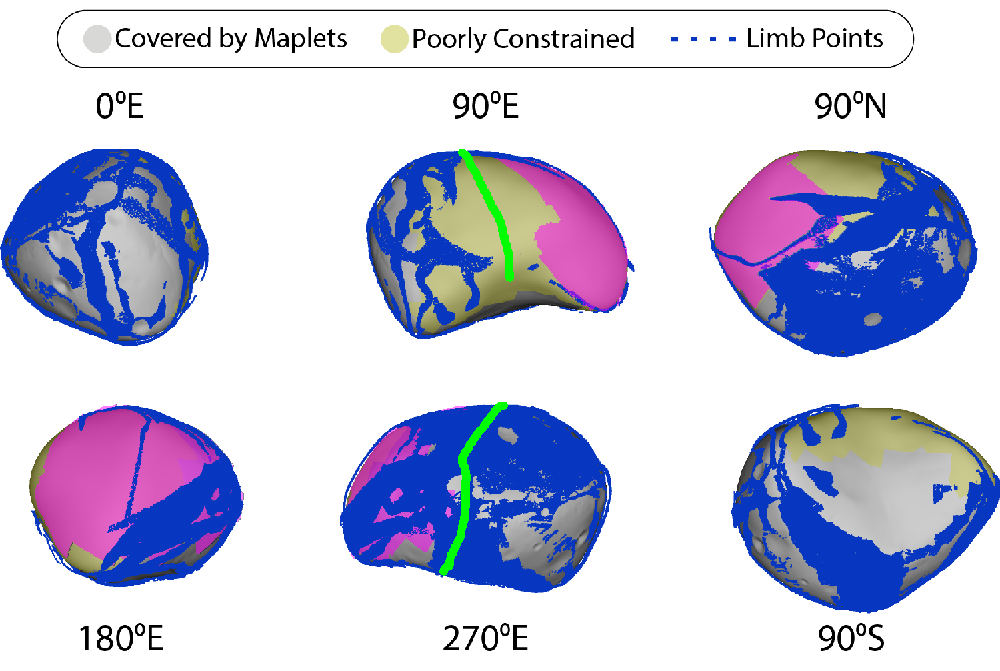
Figure 1. The current global SPC shape model of Deimos (Ernst et al. 2023), seen along the axes and rendered without albedo. The global model has an average resolution of 20 m per facet, a total of over 3 million facets, and was constructed from 332 images. Areas shaded yellow are constrained only by limbs. The blue limb points have been radially offset slightly above the body to aid visibility. Pink areas and green lines indicate where new SPC maplets and new limbs, respectively, are enabled by the Hera AFC images. The new limb visible in the 90ºE view in particular provides an important new constraint on the shape.
Figure 2. Comparison between the outline of Deimos in AFC image AF1_0CRROB_250312T120825_1B (green) and the outline of the existing Deimos shape model (blue) rendered to match the image. The right side of the shape, which was well constrained by maplets and limb points, matches well with the new image. The left side of the shape, which was poorly constrained, shows a mismatch that will be improved by incorporating the AFC limbs into the solution.
How to cite: Ernst, C., Barnouin, O., Daly, T., Gaskell, R., Vincent, J.-B., Kovács, G., Sugita, S., Michel, P., and Küppers, M.: Refining the Deimos Shape Model with Hera Asteroid Framing Cameras Observations, EPSC-DPS Joint Meeting 2025, Helsinki, Finland, 7–13 Sep 2025, EPSC-DPS2025-1668, https://doi.org/10.5194/epsc-dps2025-1668, 2025.
Introduction: The planetary defense mission HERA [Michel et al., 2022] performed a Mars swing-by on March 12th 2025. During the flyby, the Asteroid Framing Camera (AFC) captured seven images of Deimos in front of the Martian surface. These images are useful for calibration purposes but likewise suited for astrometric observations of Deimos, thus supporting the improvement of ephemerides.
The evaluation of images containing only a single planetary object requires accurate information on the spacecraft pointing or some means to deal with pointing offsets or random errors. However, with a second object in view, the spacecraft pointing can be corrected applying the knowledge of the secondary object’s 3D-position, thus improving the accuracy of the overall measurement. Here we measure the position of Deimos by using craters on the Martian surface in the background to correct the spacecraft pointing.
Methods: First the image coordinates of Deimos’ center of figure (COF) are determined. This is achieved by computing a simulated image, based on ephemerides for Deimos and HERA, a shape and a rotational model for Deimos (Thomas et al., 2000, Stark et al., 2017) and information on the AFC’s nominal pointing and camera parameters [Vincent et al., 2024]. Moreover, the photometric behavior of Deimos’ surface is modeled using the parameterless version of the Akimov disk function (Shkuratov et al., 1999; Longobardo et al., 2014).
The simulation is then used to detect Deimos in the measured image with pixel accuracy. A cut-out of this image is matched to Deimos in the measured images with sub-pixel accuracy. As the shape model was put into the simulated image at the location of the center of mass (COM), the location of Deimos’ center in the measured image is easily determined if a good match between observation and simulation can be achieved [Ziese and Willner 2018]. However, Deimos’ ephemerides provide the position of its center of mass (COM), while Deimos’ shape model is given with respect to the center of figure. Our procedure assumes that the COF and the COM coincide. For Deimos no offsets between the COF and COM are known. If they exist, they are believed to be very small.
To correct the spacecraft’s pointing, several of the depicted Mars craters are identified using the MUTED web service [Heyer et al., 2018]. The 3D-coordinates of the craters’ centers are then derived from a crater data base and are used to compute the expected line/sample coordinates of the craters. To determine the image coordinates of the crater centers in the measured image, an ellipse fit using OpenCV [Bradski, 2000] and the lmfit library [Wuttke] is used as craters are observed under oblique viewing geometry and appear elliptic. The difference between the expected and measured line/sample coordinates of the craters is computed and applied to the measured line/sample position of Deimos, thus providing corrected line/sample coordinates for the moon. The line/sample coordinates thus corrected are then converted to RA/DEC of Deimos as seen from HERA with respect to the ICRF.
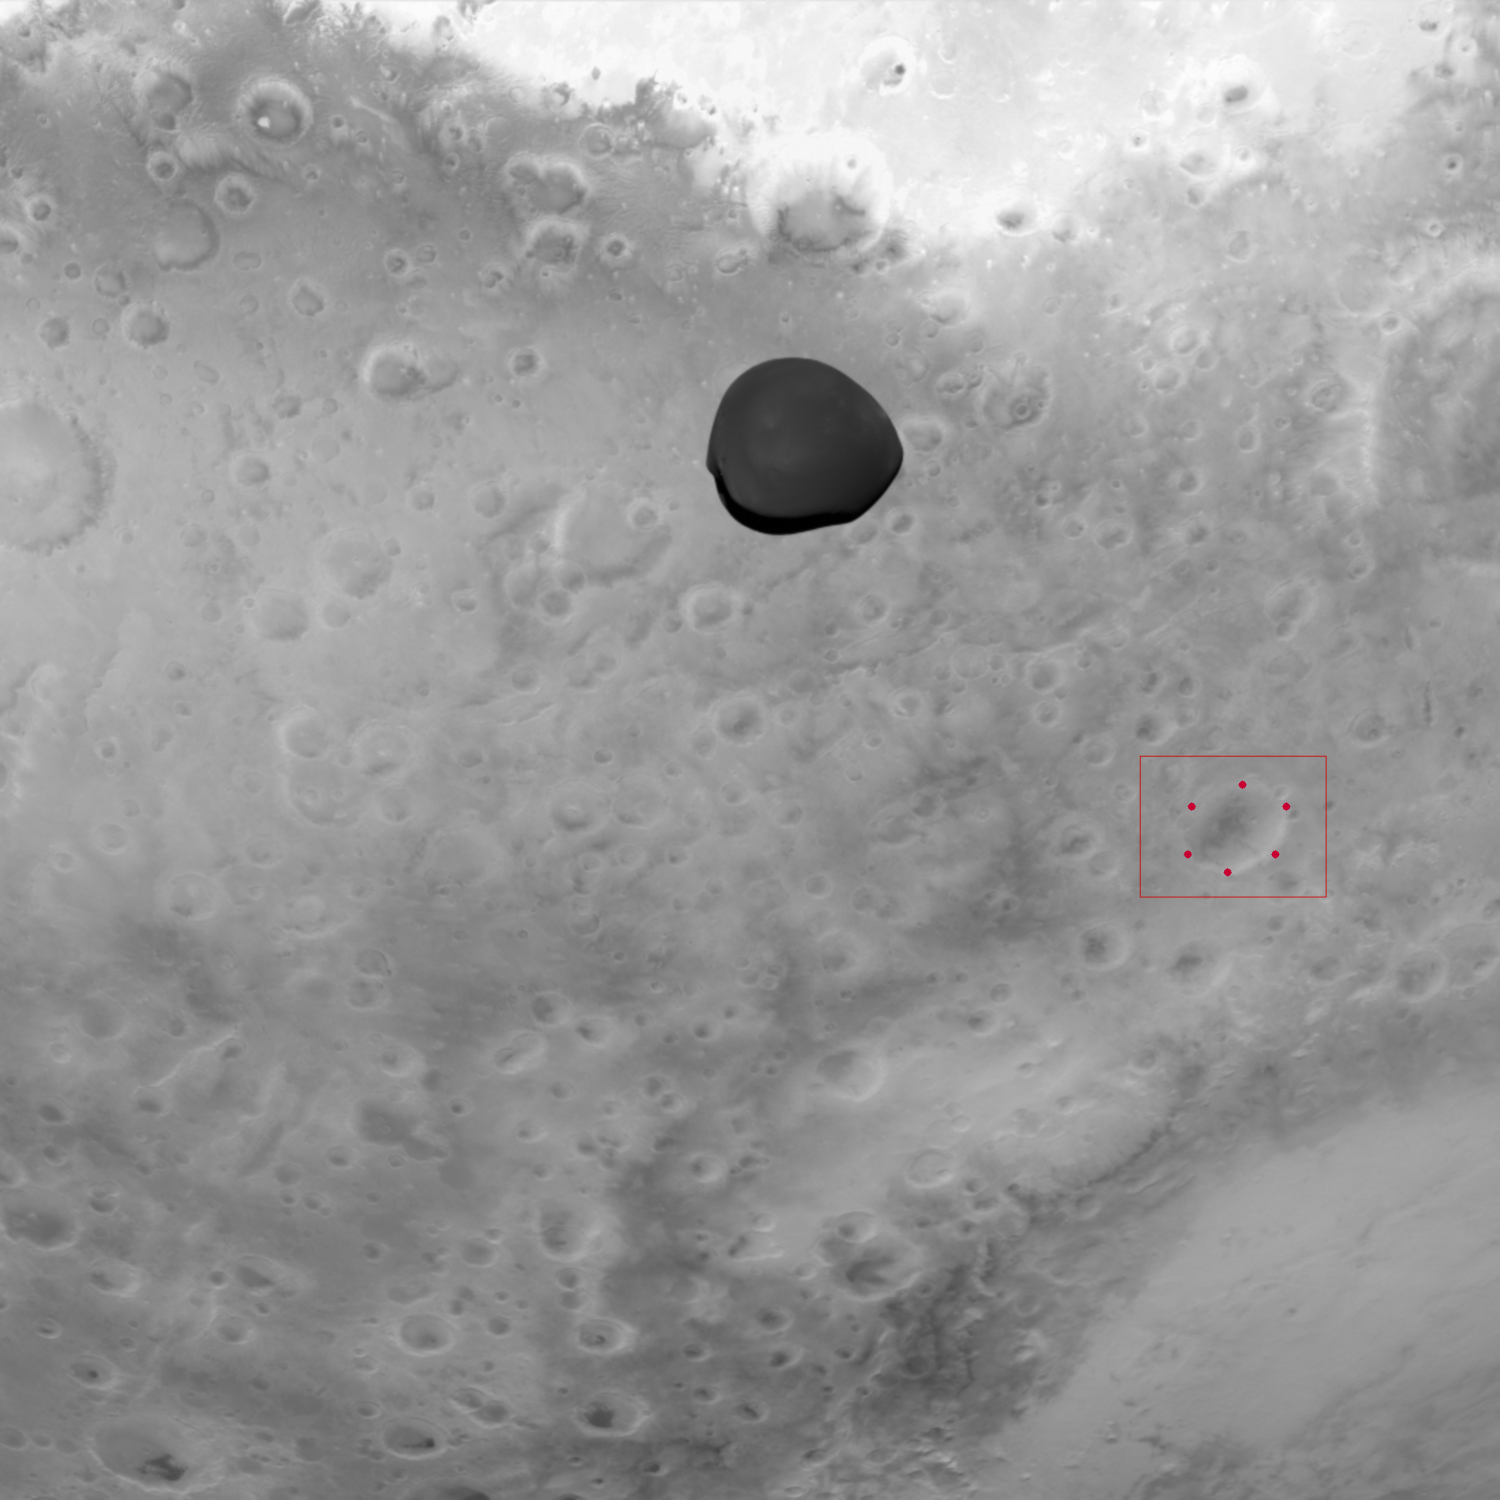
Figure 1: Deimos in front of the Martian surface. [ESA] For several craters the centers are determined by choosing points on their rims and applying an ellipse fit.
Summary and Outlook: We evaluate HERA/AFC images taken during HERA’s Mars Flyby on March 12th 2025, showing Deimos in front of the Martian surface. The measured position of Deimos will be compared against existing orbit models, e.g. MAR097 and NOE-4-2020. The new observations are expected to complement the existing data set and to support the improvement of ephemerides for Deimos.
Acknowledgements: This project is supported by the Deutsche Forschungsgemeinschaft (DFG), research grant number 528586639. The authors thank the HERA/AFC team as well as ESA/ESTEC for their successful planning and acquisition of data.
References:
Bradski, G., 2000. The OpenCV Library. Dr. Dobb's Journal of Software Tools. http://www.drdobbs.com/open-source/the-opencv-library/184404319.
Heyer, T., Hiesinger, H., Reiss, D., Erkeling, G., Bernhardt, H., Luesebrink, D., and Jaumann, R., 2018. The Multi-Temporal Database of Planetary Image Data (MUTED): A web-based tool for studying dynamic Mars. Planetary and Space Science 159, 56–65. doi:10.1016/j.pss.2018.04.015
Longobardo, A., Palomba, E., Capaccioni, F., De Sanctis, M. C., Tosi, F., Ammannito, E., Schröder, S. E., Zambon, F., Raymond, C. A. And Russell, C. T., 2014. Photometric behavior of spectral parameters in Vesta dark and bright regions as indferred by the Dawn VIR spectrometer. Icarus, 240, 20. doi:10.1016/j.icarus.2014.02.014
Michel, P., Küppers, M. et al., 2022. The ESA Hera Mission: Detailed Characterization of the DART Impact Outcome and of the Binary Asteroid (65803) Didymos. The Planetary Science Journal, 3. doi:10.3847/PSJ/ac6f52
Shkuratov, Y. G., Kreslavsky, M. A., Ovcharenko, A. A., Stankevich, D. G., Zubko, E.S., Pieters, C. And Arnold, G., 1999. Opposition Effect from Clementine Data and Mechanisms of Backscatter. Icarus, 141, 132. doi:10.1006/icar.1999.6154.
Stark, A., Willner, K., Burmeister, S., and Oberst, J., 2017. Geodetic Framework for Martian Satellite Exploration I: Reference Rotation Models, European Planetary Science Congress, 2017.
Thomas, P. C., Yoder, C. F., Synnott, S. P., Salo, H., Veverka, J., Simonelli, D., Helfenstein, P., Carcich, B., Black, G. J., Nicholson, P. D., Binzel, R. P., Gaffey, M. J., Zellner, B. H., Bell, J. F., III, and Clark, B. E., 2000. Small Body Shape Models V2.1, NASA Planetary Data System, 173, 2000.
Vincent, J.-B., Kovacs, Gábor, Nagy, B., Preusker, F., Pajola, M., Kueppers, M. and Michel, P., 2024. The Asteroid Framing Cameras on ESA's Hera mission. European Planetary Science Congress. doi:10.5194/epsc2024-445.
Wuttke, J. lmfit – a C library for Levenberg-Marquardt least-squares minimization and curve fitting. Retrieved from https://jugit.fz-juelich.de/mlz/lmfit.
Ziese, R. and Willner, K., 2018. Mutual event observations of solar system objects by SRC on Mars Express, A&A, 614. doi:10.1051/0004-6361/201731644.
How to cite: Ziese, R., Willner, K., Vincent, J.-B., and Oberst, J.: Deimos’ astrometric position from HERA/AFC images, EPSC-DPS Joint Meeting 2025, Helsinki, Finland, 7–13 Sep 2025, EPSC-DPS2025-1965, https://doi.org/10.5194/epsc-dps2025-1965, 2025.
Introduction
Phobos, the largest and closest moon to Mars, is the principal target of the Martian Moon eXploration (MMX) JAXA mission, which is scheduled for launch in 2026. The mission will orbit Phobos and perform multiple fly-bys of Deimos, send a rover to the surface of Phobos (Michel et al., 2022) and retrieve and return ≥10g of Phobos regolith back to Earth in 2031 (Kawakatsu et al., 2023; Kuramoto et al., 2022). The primary objective of the mission is to provide a definitive answer regarding the origin of the martian moons.
The mission comprises an orbiter and a small rover, designated IDEFIX. The latter is a contribution from the Centre National d’Etudes Spatiales (CNES) and the German Aerospace Center (DLR). The instrument suite on board the rover will comprise the navigation cameras (a stereo pair), two wheel cameras, a Raman spectrometer and a mini radiometer. The cameras (NavCams & Wheelcams) are a contribution from CNES, whereas the remaining two instruments are provided by DLR.
Instrument description
The navigation cameras (NavCams) are mounted at the top of the front panel of the rover and are tilted down by 23 deg. The mass of the NavCams (stereo bench) is ~526g. Four white LEDs are located in between the stereo camera to allow observations during the night. The NavCams consist of a stereoscopic pair with a field of view (diagonal) of 122 deg, a focal length (F) of ~7.9mm, a F/8 aperture and a depth-of-field from 35 cm to infinity. The stereo baseline (distance between the two cameras) is 6 cm. Each camera consists of a wide-angle optical lens assembly developed by Lambda-X and a CASPEX 2048 × 2048 pixels CMOS detector equipped with RGGB Bayer filters provided by 3DPLUS and CNES. The pixel size is 5.5 μm. This corresponds to an angular resolution of 0.6 mrad at the center and 0.9 mrad at the edges, hence pixel scales at 1 metre of 0.6 millimetre and 0.9 millimetre respectively. The distortion amounts to ~17% on the FOV sides. The spectral response of each camera, integrating the properties of both the detector and the optics, extends approximately from 400 to 800 nanometre. The power consumption amounts to ~1.2 W.
Science objectives
By performing stereoscopic imaging of the site surrounding IDEFIX, up to the horizon, the navigation cameras aim to provide answers - in a coordinated effort with orbiter and other rover instruments (such as the TENGOO and OROCHI cameras (Kameda et al., 2021) and the MIRS spectrometer (Barucci et al., 2021) on the orbiter, the Wheelcams, miniRAD and RAX on the rover) - to the following main scientific questions of the MMX mission concerning Phobos’ surface geology:
- What is the link between geological / topographic features and spectrophotometric properties of Phobos’ regolith?
- How does space weathering work on Phobos? Is it Lunar-like or Tagish Lake-like space weathering?
- What is the origin of the colour dichotomy on Phobos?
- What is the occurrence of grooves and craters at small scales?
- What is the boulder/grain size distribution for D≥3 millimetre particles and how does it compare with other small bodies?
- Are exogenous materials present? If yes, what is their composition and origin?
- How does erosion work for boulders and centimetre-sized rocks on Phobos? How common is boulder cracking and is it thermally or impact driven?
- Is there any evidence of dust transport and levitation on Phobos?
Data processing pipeline
A processing pipeline is currently being developed at the Laboratoire d’Astrophysique de Marseille to transform the raw NavCam data into high-level science products. This pipeline, developed in Python, benefits from a heritage from the Rosetta mission.
The pipeline aims to generate, among others:
- Radiometrically and geometrically calibrated stereo pairs
- 3D digital terrain models (DTMs) of the observed scenes
- Albedo and color maps
- Low resolution spectral maps
- Maps of gravitational heights and slopes
Conclusion
The CNES/DLR IDEFIX rover of the JAXA MMX mission is scheduled to be delivered to the surface of Phobos in December 2028 or early 2029. The goal of the rover is to travel across the surface of Phobos for at least 100 days, with autonomous guidance provided by the NavCams. During this expedition, the first of its kind on a low-gravity body, the images collected by the NavCams will provide elements of answers to a number of scientific questions, including but not limited to the origin of the color dichotomy and the nature of space weathering processes on Phobos.
How to cite: Vernazza, P., Jorda, L., Tardivel, S., Baroukh, J., Groussin, O., Poulain, A., Chabaud, P.-Y., Lalucaa, V., Théret, N., Murdoch, N., Le Mouelic, S., Beck, P., Rüsch, O., Flahaut, J., Charnoz, S., Lasue, J., Barucci, M.-A., Doressoundiram, A., Michel, P., and Ulamec, S. and the MMX NavCams: Surface science on Phobos with the navigation cameras of the MMX IDEFIX rover, EPSC-DPS Joint Meeting 2025, Helsinki, Finland, 7–13 Sep 2025, EPSC-DPS2025-56, https://doi.org/10.5194/epsc-dps2025-56, 2025.
Introduction:
The Martian Moon eXploration (MMX) Japanese mission is scheduled to be launched in 2026 to explore the martian moons system. The mission will orbit and land on Phobos, observe Deimos and retrieve and return more than 10 grams of regolith from the surface of Phobos back to Earth by 2031 [1, 2]. The scientific goals of the mission are to better understand the formation and evolution of the martian moons, to decipher their origin, and observe the surface and atmosphere of Mars from a different vantage point.
The origin of Phobos and Deimos, whether as asteroids by capture, or fragments of Mars by impacts, remains debated in the community (see [3] and references therein). The peculiar dynamics of their orbits seems consistent with an origin from impacts. However, their infrared spectra are most consistent with primitive asteroids with a low albedo, red slope and few if any mineralogical absorption features [4].
Method:
Polarimetric observations are a useful tool to classify and decipher the evolution of planetary surfaces [5] and has been especially used to study the properties of asteroid families [6]. Few observations in polarization have been made in the 1970s of Phobos and Deimos by the Mariner 9 space mission and ground-based observations [7, 8]. At large phase angles from 74 to 81 degrees, those observations were done in the visible at 570 nm, while low phase angle observations below about 30 degrees were done in the ultraviolet at 233 nm. We can directly compare those measured values to the ones observed for different types of asteroids from the ground in the U and V astronomical filters [9, 10] as shown in Figure 1.
Then the PROGRA2 experiment is a polarimetric goniometer that studied the light-scattering properties of dust particles of various size distributions under Earth’s gravity either deposited or lifted by an air-draught, as well as levitated under microgravity conditions in dedicated flight campaigns. The experiment was used to study the polarimetric behavior of various astronomical analogues including crushed meteorite samples that were levitated or deposited [11]. These meteorites included: Allegan, an H5 ordinary chondrite analogue to S-type asteroids, Allende, a CV3 primitive carbonaceous chondrite analogue to C-, L- or K-type asteroids (crushed in two different grain sizes: fine sieved <50microns and large sieved <500microns), and Orgueil, a CI1 carbonaceous chondrite possibly linked to C-, B-, X- or D-type asteroids, although terrestrially weathered. Additional analogues of primitive asteroids surfaces were also generated using mixtures of olivine and iron sulfide (FeS) in submicrometre-size powders [12] The phase functions of Phobos and Deimos can be compared with those of deposited meteorites as shown in Figure 2.


Figure 1. Comparison of the polarization measurements of the surface of Phobos and Deimos with the observations from primitive asteroids (types C, D, P) and the S-type asteroids. Top: data of the asteroids taken in the V filter, showing the specific phase curve of Ryugu C-type asteroid. Bottom: zoom on the negative branch of the phase curves. Asteroidal data taken in the U filter. The Phobos and Deimos polarization data in the UV is most consistent with the primitive types asteroids phase curves (red).


Figure 2. Comparison of the polarization observations of Phobos and Deimos with deposited crushed meteorite samples (Allegan, Allende and Orgueil) [11] and hyperfine olivine and FeS mixtures (20% and 30% olivine volume fraction) [12]. Top: full phase curve comparison. Bottom: zoom on the negative branch between 0 and 40 degrees phase angles. (in the legend, for a given color the solid line and the dashed line correspond to the first and the second name respectively)
Discussion:
Comparison of the phase curves with the ones observed for asteroids clearly confirms the link with C-type and primitive asteroids. At large phase angles the Phobos and Deimos data points fall on the C-type asteroidal trend. Lower than the Ryugu phase curve whose high polarization was interpreted to be due to the presence submillimeter-sized large grains on its surface layer [10]. At low phase angles also, the data points in the UV are most consistent with the trend of C-type asteroids, with a lower Pmin value than S-type asteroids.
Comparison to the meteorite samples and deposited olivine and FeS mixtures is most consistent with the deposited Allende large grains sizes sample (sieved to <500 microns) for both the small and large phase angles. While other samples appear very close such as Orgueil or the Olivine and FeS mixtures, their negative branch characteristics (Pmin and P0 values) are inconsistent with the ones observed for Deimos.
Though the experimental curves for Allende have been measured in the red (630 nm) the color trend is expected to be small. Similar maximum in polarization (i.e. Pmax) values were obtained experimentally for dark particles deposited or in levitation showing that multiple scattering is negligible [11].
These results are then consistent with large particle grains (mm in size) of primitive meteorites such as carbonaceous chondrites constituting the regolith of both Phobos and Deimos.
Conclusions:
The polarization phase curves of Phobos and Deimos are consistent with primitive asteroids of types C, D and P, just like their infrared spectra. Comparison with crushed deposited meteorite samples and analogues is indicative of the presence of relatively large grains (mm sized) of primitive materials on the surface the martian moons.
References:
[1] Kuramoto K. et al. EPS 74.1 (2022): 12.
[2] Kawakatsu Y. et al. Acta Astronautica 202 (2023): 715-728.
[3] Kuramoto K. AREPS 52 (2024).
[4] Fraeman A. et al. Icarus 229 (2014): 196-205.
[5] Kolokolova, Hough, Levasseur-Regourd eds. "Polarimetry of stars and planetary systems." (2015) CUP.
[6] Cellino A. et al. MNRAS 455.2 (2016): 2091-2100.
[7] Noland M. et al. Icarus 20.4 (1973): 490-502.
[8] Zellner B. AJ, Vol. 77, p. 183 (1972) 77 (1972): 183.
[9] Lupishko D. Ed. (2022). Asteroid Polarimetric Database V2.0. urn:nasa:pds:asteroid_polarimetric_database::2.0. NASA PDS; doi: 10.26033/hyf9-4762.
[10] Kuroda D. et al. APh. Let. 911.2 (2021): L24.
[11] Hadamcik E. et al. MNRAS 520.2 (2023): 1963-1974.
[12] Sultana R. et al. Icarus 395 (2023): 115492.
How to cite: Lasue, J., Hadamcik, E., Renard, J.-B., Poch, O., and Beck, P.: Phobos and Deimos polarimetric observations interpreted through analogue measurements, EPSC-DPS Joint Meeting 2025, Helsinki, Finland, 7–13 Sep 2025, EPSC-DPS2025-91, https://doi.org/10.5194/epsc-dps2025-91, 2025.
Planetary surface analogues of rocky celestial bodies play a crucial role for understanding the potential for spectroscopy payloads on robotic missions to objects in our solar system. Special surface simulants were developed for the Martian moon Phobos, in order to verify what insights into the history/origin of its formation can be gained from vibrational spectroscopy. The main scenarios considered are: the disintegrating of the parent planet by a giant impact (PGI); the gravitational capture of an asteroid from the inner or outer solar system (PCA) and co-accretion with Mars [1, 2]. The chemical composition of the Phobos soil will be probed in-situ using the Raman Spectrometer instrument (RAX) [2] on board of the lander of the JAXA Martian Moon eXploration (MMX) mission.
In this study, we investigated the ability of Raman scattering spectroscopy and mid-infrared (MIR) reflectance spectroscopy to resolve differences in the chemical composition of selected Phobos surface simulants. Our work shall support the understanding of in-situ Raman spectroscopy data derived during the soon-to-be-launched MMX mission, as well as provide a motivation to develop infrared reflectance and/or emission instrumentation for future missions to rocky celestial bodies, operating over a wavelength range of 8-18 µm.
Phobos simulants. Natural minerals and coal from the collection of the Institut für Planetologie were used to prepare the Phobos surface simulants of the PCA (#711) and PGI (#712) types. The original solid samples were first crushed and sieved to produce size fractions in the range of 63-125 µm. This is consistent to the fine silicates with the thermal inertias like determined by infrared radiometry of Phobos [3]. The powder mixes were then prepared to match the mineral abundances as in [4]. Both simulants contain phyllosilicates, olivine, sulfates, sulfides and oxides as well as carbon, in different weight percentages, while pyroxene at 17 wt% is present only in the PGI simulant.
Simulated space weathering.
The alteration of Phobos surface is likely primarily due to solar wind plasma and small-size hypervelocity impacts from micrometeorites, similar to atmosphere-less planetary bodies. Due to the moon’s proximity to Mars, the latter includes also particles ejected from the Martian surface. Micrometeorite bombardment is regularly simulated by pulsed laser irradiation, with the mean impact energy roughly equal to the pulse energy [5]. We used a 8 ns pulsed NdYAG laser operating at 1064 nm. The pulse energy was varied (0.1 mJ, 1 mJ, 10 mJ) for different irradiated areas on the samples (Fig. 1).
The MIR reflectance spectra were recorded in specular reflection mode at 13° angle. The spot size on the sample was varied between 5.2 to 4.6x4.5 mm2. The choice of the spectral range (2-18 µm) was motivated by coverage of the strongest reflectance features of minerals, such as Reststrahlen bands and Christiansen features (CF) [6].
As the different bands resolved in the PCA to PGI reflectance spectra, we can point out a few weak features of enstatite, that stand out and are distinguishable between the PGI and PCA samples: the Si-O-Si bending modes in the 13-15 µm region and the metal-OH bands at around 2.3 µm (Fig. 2). The most pronounced spectral features, such as stretching absorption bands and the CF of enstatite, cannot be differentiated because of overlapping bands of other silicates present.
Raman spectroscopy of the sample surface was performed in the wavelength range 535-666 nm of Stokes shifted light. The 532 nm laser has a spot of 1.5 µm on the sample; mapping was with different step sizes down to 10 µm. The RAX instrument of the MMX mission uses the same wavelength range, and has a similar spectral but lower spatial resolution (50 µm).
Raman microscopy resolves all phases in both the original and the altered samples (Fig. 3). This includes the observation of metamorphic changes, amorphization, and evolution of the original mixes in the grain size.
Implications to in-situ analytical instrumentation.
For the Phobos simulants in this study, thermal infrared spectroscopy (Fig. 2) shows capability in resolution of pyroxene, limited to relatively weak internal bending modes of silicates, and generally only in areas of low alteration. Given the significant progress in modern development of sensitive, space-qualified MIR detectors or new time-domain spectroscopy approaches [7], one may assume the arrival of advanced instrumentation for fingerprinting infrared-active resonances that can significantly improve accuracy of mineral identification, compared to the visible and near-infrared spectral ranges.
Raman microscopy resolves all phases under spatial resolution below 20-30 µm in the impact craters and around. Averaging spectra across 50-100 µm size areas (the sampling size range of the RAX instrument [2]) can result in reduction of Raman signal contrast at locations with multiple phases, particularly if these are poorly represented or exhibit strong luminescence (Fig. 3).

Fig. 1. Microscope image of the section of a Phobos surface simulant (sample 712) after irradiation with 1 mJ pulses in a 250 x 300 µm grid.

Fig. 2. Infrared reflectance spectra of Phobos surface simulants before compression into pellets used for laser irradiation (left Y-axis), compared with individual spectra of contributing silicates (right Y-axis). The red arrows indicate the selected wavelength ranges in which fingerprints of the characteristic enstatite bands remain distinguishable.

Fig. 3. Raman spectra of the Phobos surface simulant 712 recorded as 100 µm x 100 µm map in a crater produced by the energy 1 mJ, step of 10 µm. The signal averaged over 100 points in the map center loses most of the spectral features of the mineral phases present.
References:
[1] H. Miyamoto, T. Niihara, K. Wada, et al. EPS 73, 214 (2021).
[2] Y. Cho, U. Böttger, F. Rull, et al. EPS 73, 232 (2021).
[3] L. Ksanfomality, S. Murchie, D. Britt, et al. Planet. Space Sci. 39, 311 (1991).
[4] Z. A. Landsman, C. D. Schultz, D. T. Britt, et al. Adv. Space Res. 67, 3308 (2021).
[5] I. Weber, U. Böttger, F. Hanke, et al. J. Raman Spectrosc. 53, 411 (2022).
[6] A. Morlok, S. Klemme, I. Weber, et al. Icarus 324, 86 (2019).
[7] O. Gueckstock, N. Stojanovic, Y. Ha, et al. Appl. Phys. Lett. 124, 141103 (2024).
How to cite: Pavlov, S., Weber, I., Morlok, A., Reitze, M. P., Rammelkamp, K., Lorek, A., Greiner-Bär, M., and Gensch, M.: Raman light scattering and thermal infrared spectroscopic studies of Phobos surface analogues: Towards the Martian Moon Exploration mission, EPSC-DPS Joint Meeting 2025, Helsinki, Finland, 7–13 Sep 2025, EPSC-DPS2025-375, https://doi.org/10.5194/epsc-dps2025-375, 2025.
Introduction: The JAXA Martian Moons Exploration (MMX) mission [2] will deploy the French-German rover Idefix (Fig. 1) to the surface of Phobos [3]. The Idefix rover will act as a scout for the main goal of the mission: perform a sample return from the surface of Phobos. This will also mark the first attempt at wheeled-locomotion in a low-gravity environment, offering the opportunity to investigate both the surface of Phobos and the behaviour of regolith at the surface of small bodies [2; 10]. Idefix, the WheelCams and its science objectives: The MMX rover IDEFIX is tasked to provide data on the regolith properties thanks to scientific instruments that will deliver high-resolution images, measurements of the thermal properties, and Raman spectroscopy, respectively thanks to the NavCams and WheelCams cameras, the miniRAD radiometer and the Rax raman spectrometer [3]. Our main interest is the WheelCams instrument, which will aim at the wheels of the rover and capture wheel-regolith interactions. These images will be used to characterize the properties of the regolith such as the size distribution and the morphological parameters [4]. The goal is to thus infer parameters such as the angle of internal friction, in order to estimate the strength of Phobos’ regolith.
Figure 1: The MMX rover Idefix. a) A photo of the delivered MMX rover IDEFIX in the clean room (Credit: JAXA). b) CAD of IDEFIX in the on-surface configuration. Field of views of miniRAD and WheelCAMs are displayed in yellow and red respectively (Credit: CNES, from Michel et al. (2022)).
Morphological parameters: A pipeline has been developed to quantitively analyse such parameters of individual grains [5]. However, waiting for the MMX mission to launch, this pipeline has been tested and approved on images from other small bodies and especially from Dimorphos (Fig. 2), the target of the NASA DART mission [1]. It was the first detailed morphological analysis of these bodies, allowing the bulk internal friction angle of the boulders at the surface of Dimorphos to be constrained (Fig. 2) and providing insights to our understanding of the formation of this binary asteroid.
Figure 2: (Left) Boxplots of the internal friction angles values from the boulders >30 px analysed on the images of Dimorphos, Itokawa, Ryugu and Bennu and the average and standard deviation amongst the 4 asteroids. (Right) last image taken of Dimorphos before impact with the DART spacecraft. Boulders selected and analysed are coloured in blue and red. The red boulders indicate the smaller resolved boulders (<30 px). Figures from Robin et al. (2024).
A digital shear box for material characterisation: In order to further our understanding on the behaviour of granular material at the surface of small bodies, we also perform Discrete Element Method simulations with the Project Chrono code[9; 8] (Fig. 3) Wheel simulations have been previously performed to understand the sinking and driving behaviours of an MMX rover wheel in different simulated granular materials [7]. In Sunday (2022) the sinking and driving behaviour of the IDEFIX rover was studied for different values of microscopic (particle-particle) friction and cohesion. However, it is also important to understand how the sinking and driving vary with the bulk properties, as it is the bulk properties that will be more readily inferred in-situ. Therefore, to quantify the macroscopic parameters, we perform shear tests, similar to laboratory experiments (Fig. 3), in order to determine the internal friction angle and the bulk cohesion of the studied granular materials.
Figure 3: Visualisation of the stress during shear tests simulations of frictional particles without cohesion. (Left) The granular material before shear. (Right) The same simulation after a displacement of 10% of the box. We can see the shear band, where most of the shear strain is located.
We performed simulations for a low friction material (μ = 0.16), a high friction material (μ = 0.4), and a high friction material with cohesion (μ = 0.4 , C = 68.9 mN at Earth gravity and C = 0.04 mN at Phobos gravity). In addition, we also used the most likely Phobos-regolith parameters a defined in the MMX ERD (μ = 0.4, C = 0.02 mN at both Earth and Phobos gravities). By running several simulations with different normal loads and retrieving the maximal shear stress endured by the granular material, after a displacement of 10% of the box, we can use the Mohr-Coulomb law to infer the internal friction angle and the bulk cohesion of the material (Fig. 4).
Figure 4: (Left) Shear stress on the pushing wall as a function of the shear box displacement. The value of shear stress for a given load at a 10 mm (i.e. 10%) displacement corresponds to a data point in the Mohr-Coulomb plot. (Right) Shear stress plotted as a function of normal stress for rough glass beads. An internal friction angle of 23.15° is measured with a bulk cohesion of 1.7 kPa, which are expected results for this material in this range of normal stress [6; 11].
Conclusion: These shear box simulations will allow macroscopic characterization of frictional and cohesive properties based on a specified set of microscopic parameters. The results presented at this conference will then be the framework to study sinkage and driving performance as a function of the macroscopic properties.
How to cite: Robin, C. Q., Murdoch, N., Duchene, A., and Sunday, C. and the Dart Investigation Team and others: Characterizing the frictional properties of Phobos’ regolith using theIDEFIX WheelCams, EPSC-DPS Joint Meeting 2025, Helsinki, Finland, 7–13 Sep 2025, EPSC-DPS2025-639, https://doi.org/10.5194/epsc-dps2025-639, 2025.
It was suggested first by Soter [1] that dust rings exist around Mars, formed by particles released from Phobos and Deimos. The configuration of such rings has been studied theoretically (see [2] and references therein) but so far, attempts to detect the rings remotely were unsuccessful [3]. A promising opportunity to detect and characterize these rings are the measurements to be performed with the Circum Martian Dust Monitor (CMDM) instrument [4] on the JAXA mission Mars Moons Explorer (MMX) [5]. In this paper we employ recent results from computer simulations [2] of the Martian dust rings to evaluate the dust fluxes expected for CMDM along the orbital tour of MMX around Mars.
[1] Soter S. (1971), Report of Center for Radiophysics and Space Research, 462
[2] X. Liu and J. Schmidt (2021), MNRS, 500, Configuration of the Martian dust rings: shapes, densities, and size distributions from direct integrations of particle trajectories.
[3] Showalter M. R., Hamilton D. P., Nicholson P. D. (2006), PSS, 54, A deep search for Martian dust rings and inner moons using the Hubble Space Telescope.
[4] M. Kobayashi et al. (2018), PSS, 156, In situ observations of dust particles in Martian dust belts using a large-sensitive-area dust sensor.
[5] K. Kuramoto et al. (2022), EPS, 74, Martian moons exploration MMX: sample return mission to Phobos elucidating formation processes of habitable planets.
How to cite: Schmidt, J., Kobayashi, M., Krüger, H., and Liu, X.: Estimates for Dust measurements with the Circum Martian Dust Monitor in Martian orbit, EPSC-DPS Joint Meeting 2025, Helsinki, Finland, 7–13 Sep 2025, EPSC-DPS2025-1238, https://doi.org/10.5194/epsc-dps2025-1238, 2025.
The formation history of Deimos and Phobos is debated and varies between direct capture, formation after a giant impact, or in a ring-moon cycle resulting from a giant impact impact disk. In either of the giant impact origin scenarios, Deimos is formed directly from the circumplanetary impact disk with the former scenario suggesting that Deimos (or its precursors) passed through resonances with the inner moon during its evolution}. However, this implies an excited modern-day orbit with Deimos having a chaotic eccentricity history. Present-day Deimos has low eccentricity (e = 0.00033) and moderate inclination (i = 1.8o to the Laplace plane), and tidal dissipation within Deimos is too inefficient for eccentricity damping. With a more excited orbit, sesquinary impactors would have a higher impact energy and could break up a rubble-pile-like body via a runaway sesquinary bombardment. Sesquinary impactors are ejecta from the target satellite that have escaped its gravitational pull and reimpact it after orbiting the parent planet on an independent orbit.
Here, we test and show that the sesquinary catastrophe can break up an excited proto-Deimos into a debris disk. This disk is easier to circularize and would eventually re-accrete into modern-day Deimos, just under the sesquinary catastrophe threshold q ~ 10-14 where q = √(e2 + sin2 i ) vorbital / vescap is a measure of the sesquinary excitation of the satellite. We launch impactors from the surface of Deimos with initial velocities of1 - 3 vescape with a total mass of 0.1 % MDeimos. These impactors have the same density as Deimos. As they evolve over time, they precess and re-impact Deimos, potentially causing erosion. The ejected mass can escape Deimos and feed this cascade. We see consistent mass loss at various excitations q > 5-10, and complete break-up in accelerated simulations.
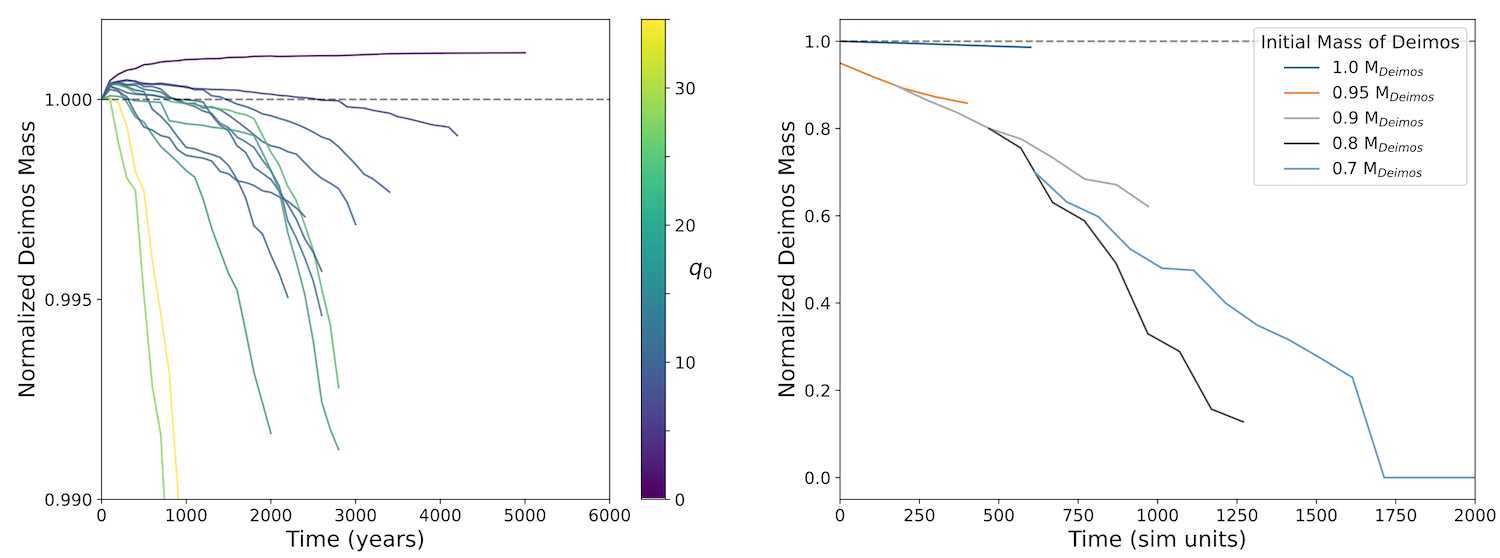 Figure 1: Deimos’ mass loss due to sesquinary impacts. (a) Mass loss across multiple initial orbital excitations q. Impactor Rinitial∼100−200 m. (b) Accelerated mass loss for Deimos at q∼23 with lower starting mass and bigger impactors. We see consistent mass loss in both sests of simulations.
We find a semi-analytical timescale for break-up as a function of q. The impact velocity in the simulations has a Rayleigh distribution with a mode q·σ where σ ≈0.25. We then average the mass loss scaling laws with the impact velocity distribution and obtain an approximate breakup threshold of q ~ 10-14. This breakup time is on the order of 104 years but varies depending on the impact velocity distribution.
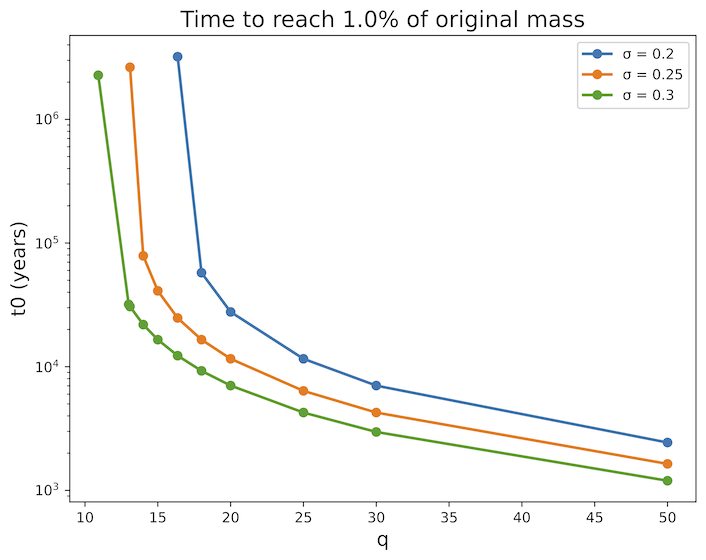
Figure 2: Time taken to breakup a Deimos-like satellite to 1% of it’s original mass via the sesquinary catastrophe.
We use the N-body integrator Swiftest with a cratering collision model to model the sesquinary impacts. Swiftest has a built-in collisional fragmentation model (FRAGGLE) for similar-size impactors and a cratering impactors. This work shows that the sesquinary catastrophe is viable mechanism to reconcile an excited proto-Deimos with the cooler orbit of modern Deimos.
How to cite: Anand, K., Minton, D., and Ćuk, M.: The sesquinary catastrophe can reconcile Deimos' cool present with it's excited past, EPSC-DPS Joint Meeting 2025, Helsinki, Finland, 7–13 Sep 2025, EPSC-DPS2025-1834, https://doi.org/10.5194/epsc-dps2025-1834, 2025.
- Relative volumetric mineral abundances (olivine, orthopyroxene, clinopyroxene),
- Compositional endmembers (e.g., fayalite and ferrosilite contents),
- Taxonomic class probabilities using a confidence-based scheme.
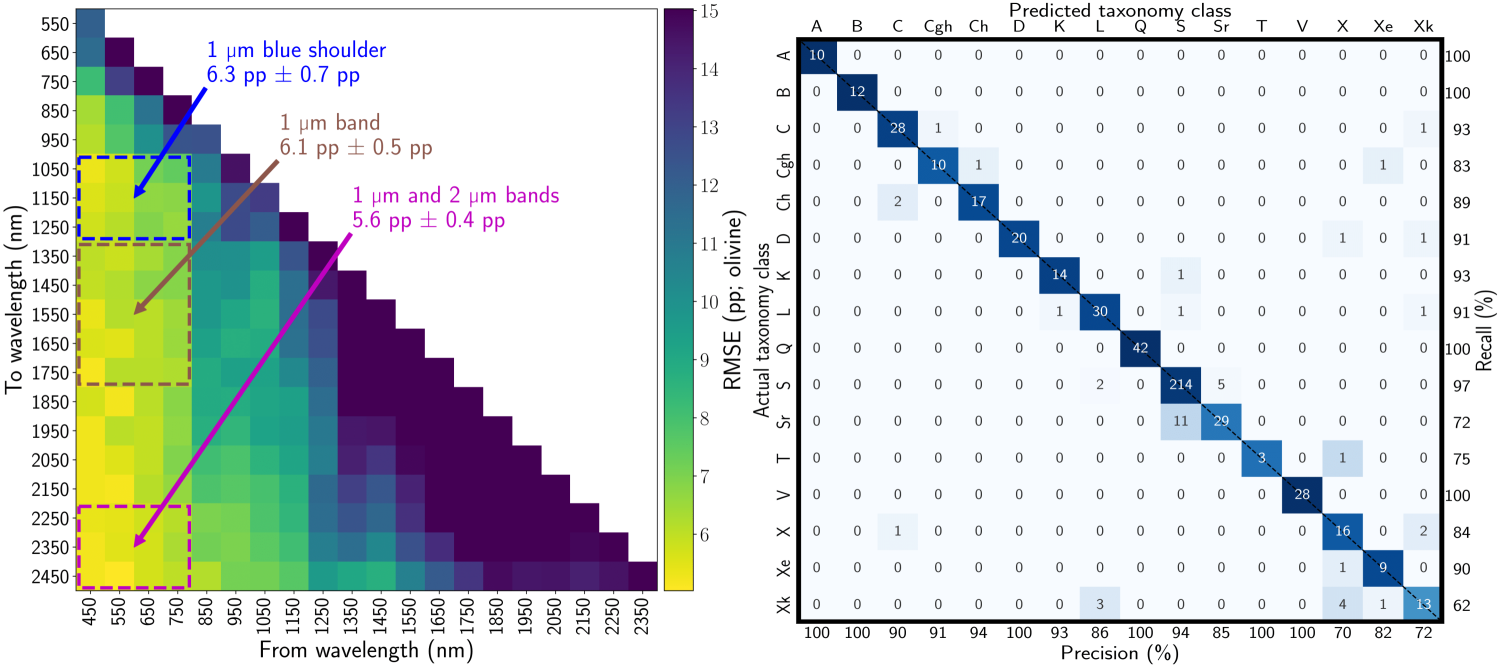
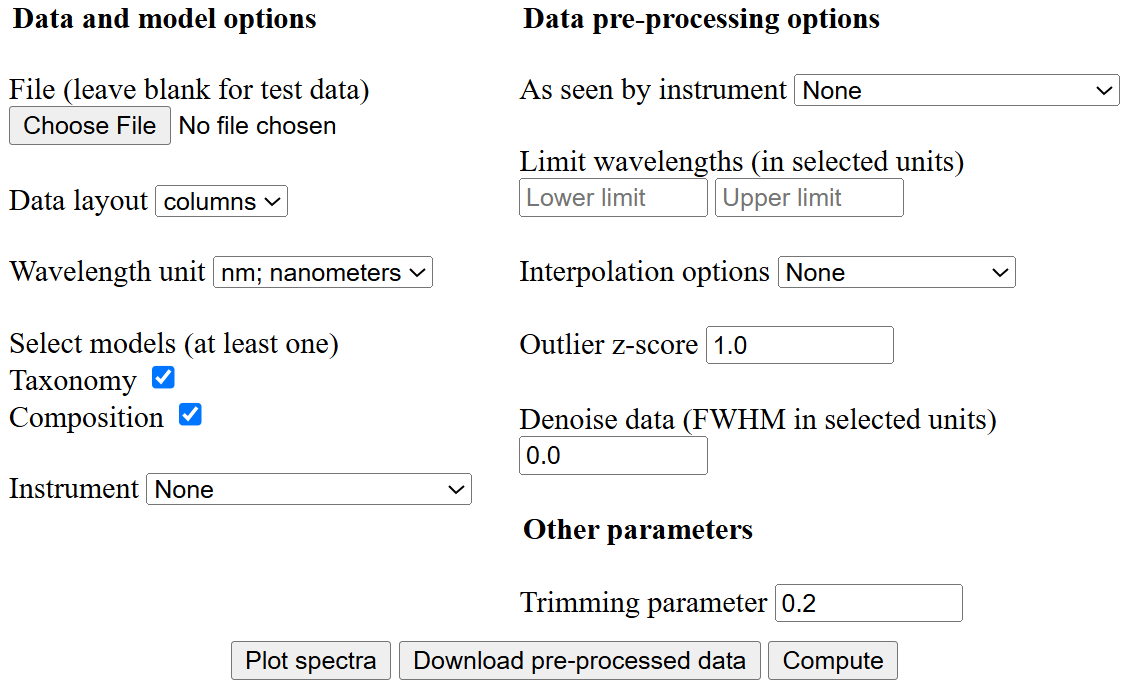
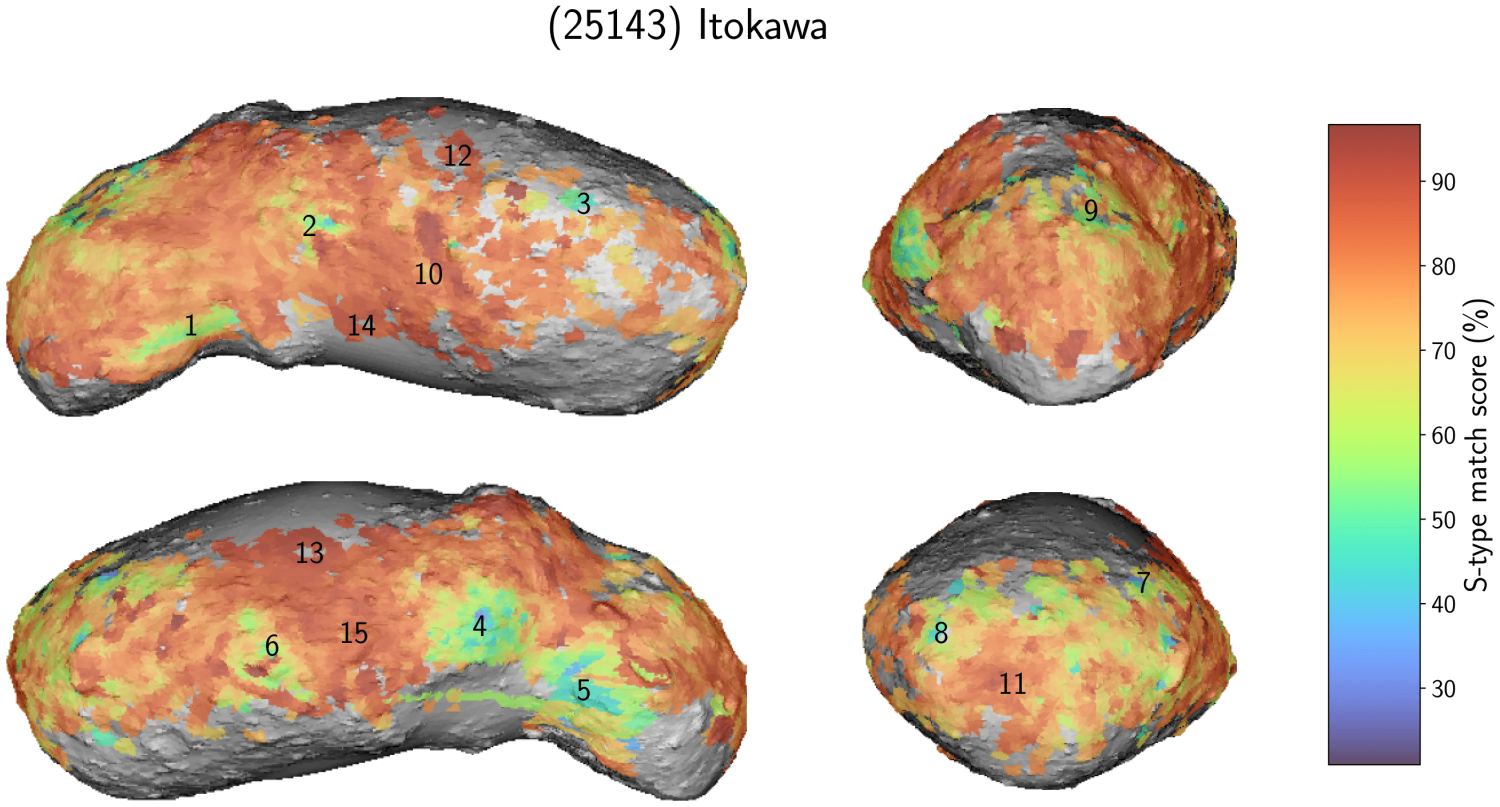
How to cite: Korda, D., Kohout, T., Popescu, M., and de León, J.: Surface Composition and Space Weathering of Asteroids via Neural Network-Based Spectral Analysis, EPSC-DPS Joint Meeting 2025, Helsinki, Finland, 7–13 Sep 2025, EPSC-DPS2025-1295, https://doi.org/10.5194/epsc-dps2025-1295, 2025.
Introduction:
In late 2026, JAXA will launch the Martian Moons eXploration mission (MMX) towards the Mars system to gain insights into the origin of the two Martian moons, Phobos and Deimos. After a travel time of about a year and another year of observations from orbit, the spacecraft will approach Phobos where it deploys the rover IDEFIX to the moon’s surface to take in-situ measurements. Moreover, the main spacecraft will gather samples (<10g) to be returned back to Earth [1].
The small rover IDEFIX [2,3] is equipped with several instruments to investigate the surface regolith: among these is a Raman spectrometer called RAX [4], which is mounted on the underside of the rover. To conduct measurements, the rover first lowers its body to a height of about 8 cm over ground, then the opto-mechanical RAX autofocus is used to focus the laser onto the surface. From spectral analysis of the inelastically backscattered light, information about the mineral composition of the analyzed spot can be obtained. After two Raman spectrometers on NASA’s Perseverance rover operating on Mars since 2021, RAX will be only the third Raman spectrometer to be sent to space.
The RAX Development Model (DM) is the model most similar to the Flight Model (FM) in terms of its optics and software and was used for tests on the MMX flat rover until end of 2024. In this work, we report on the implementation of the RAX reference setup with the RAX DM in a thermal vacuum chamber and first reference measurements.
Reference Setup with the RAX Development Model:
Like the RAX FM, the DM features a continuous-wave laser with an excitation wavelength of λ = 532 nm that is connected to the RAX Spectrometer Module (RSM) via a multimode optical fiber with a core diameter of 50 µm [4]. The RSM contains a highly compact confocal optical assembly able to detect Raman shifts from 90 to 4000 cm-1 in a spectral range between 535 to 680 nm and with a resolution of 10 cm-1. The spot size is 50 µm. RAX is equipped with an integrated opto-mechanical autofocus subsystem (AFS) that can focus the laser within a working range of 13 mm, with an accuracy of 50 µm. Up to now, the RAX DM was used in a horizontal measurement geometry that did not allow the analysis of unconsolidated materials.
To generate reference data representative of in-situ measurements with RAX on Phobos, the RAX DM was set up similarly to how it will acquire data on Phobos. Important features for the reference setup were (1) a downwards facing measurement configuration which enables the analysis of loose samples of different grain sizes and (2) to keep the detector at temperatures below 5°C to achieve high signal-to-noise ratios representative of data from Phobos. The latter required to move the whole instrument into a thermal vacuum chamber in order to avoid condensation of humidity.
The vacuum chamber, which is shown in Fig. 1, features the main tank, where the RAX instrument is placed, as well as an additional six-flange cube for different electrical feed-throughs. For this setup, three feed-throughs were added for the power connection, the SpaceWire line for communication with the instrument, as well as a connection to power and move a sample stage. This sample stage was set up below the instrument and allows to take measurements on multiple samples without a need to open and close the chamber in between. We use a URS-BPPV6 rotary stage by Newport with a custom-made sample holder. Inside the chamber, RAX is mounted to a massive foundation plate which can be cooled by a closed-loop cooling system. The working distance was chosen so that the AFS can make full use of its focus range. This setup enables to fully operate RAX and the sample stage in thermal vacuum from outside the chamber to measure multiple samples. The goal is to acquire an extensive number of Raman spectra of different minerals and other samples in preparation of the mission.
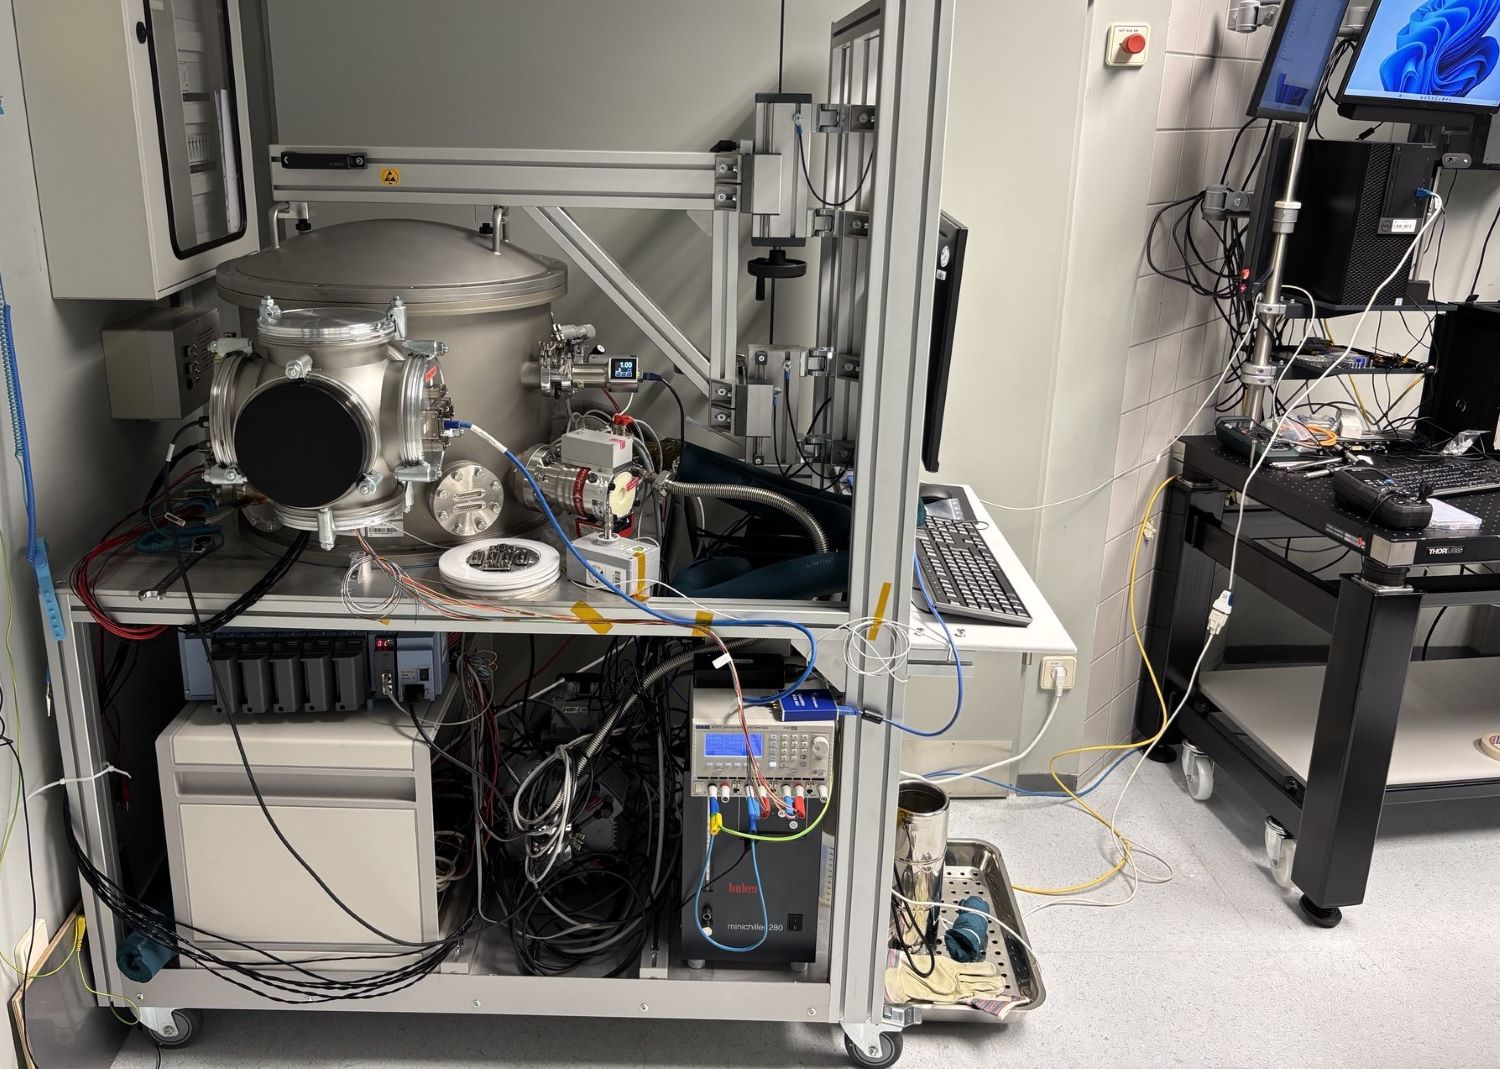
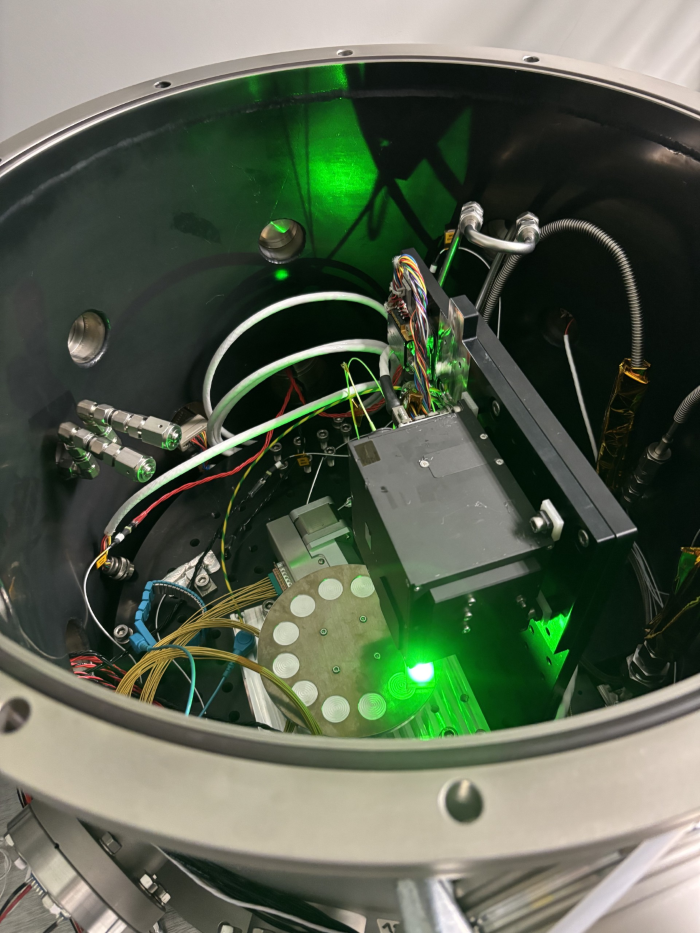
Figure 1: Top: Thermal vacuum chamber into which the RAX DM was integrated. Bottom: The RAX DM is facing downwards to measure reference samples placed on a rotating sample holder
First Reference Measurements:
The first measurements were done on several minerals including anatase and quartz. A dark image, i.e. without laser illumination, was acquired before every Raman measurement. This dark spectrum was subtracted from the Raman data afterwards. Spectral data from a measurement using only a neon light source was used for spectral calibration. The data was geometrically calibrated using a routine that was developed around the RAX FM and will be later optimized for the DM. The data from spatial as well as the spectral dimension was binned to optimize the visibility of Raman features. Each measurement was conducted ten times at the same spot and the resulting data averaged.
Fig. 2 shows exemplary data taken of quartz and anatase in their fingerprint region at ambient conditions. Data acquisition parameters will be optimized. Data taken at different lower temperatures of several minerals and analogue materials will be taken in the following weeks and presented at the conference.
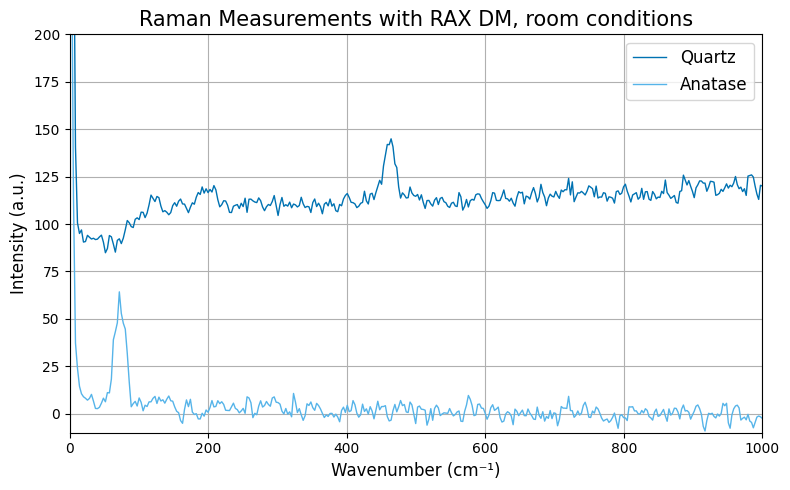
Figure 2: First light data of quartz and anatase measured using the RAX DM in the reference setup at ambient conditions. Data acquisition parameters need yet to be optimized.
Acknowledgements:
MMX is a JAXA mission with contributions from NASA, CNES and DLR. The MMX IDEFIX rover is provided by CNES and DLR. The RAX instrument is a joint development from DLR-OS, INTA/UVa, and JAXA/UTo.
References:
[1] Y. Kawakatsu, K. Kuramoto, T. Usui et al., Acta Astronaut. 2023, 202, 715.
[2] P. Michel, S. Ulamec, U. Böttger et al., Earth Planets and Space, 2022, 74, 2.
[3] S. Ulamec, P. Michel, M. Grott et al., Acta Astronaut. 2023, 210, 95.
[4] T. Hagelschuer, U. Böttger, M. Buder et al., Internat. Astronautical Congress (IAC): 18-22 September, 2022, Proceed. 2022, IAC-22-A3.4A.8
How to cite: Krybus, N., Seel, F., Schröder, S., Buder, M., Bunduki, Y., Hagelschuer, T., Eisenmenger, H., Binger, J., Dietz, E., Kopp, E., Rammelkamp, K., Säuberlich, T., Cho, Y., Hübers, H.-W., Moralia, A., Peter, G., Prieto-Ballesteros, O., Ulamec, S., Usui, T., and Weber, I.: The Reference Setup for the RAX Raman Spectrometer on the MMX IDEFIX Rover for Phobos in-situ analysis, EPSC-DPS Joint Meeting 2025, Helsinki, Finland, 7–13 Sep 2025, EPSC-DPS2025-1669, https://doi.org/10.5194/epsc-dps2025-1669, 2025.
Please decide on your access
Please use the buttons below to download the supplementary material or to visit the external website where the presentation is linked. Regarding the external link, please note that Copernicus Meetings cannot accept any liability for the content and the website you will visit.
Forward to presentation link
You are going to open an external link to the presentation as indicated by the authors. Copernicus Meetings cannot accept any liability for the content and the website you will visit.
We are sorry, but presentations are only available for users who registered for the conference. Thank you.
Please decide on your access
Please use the buttons below to download the supplementary material or to visit the external website where the presentation is linked. Regarding the external link, please note that Copernicus Meetings cannot accept any liability for the content and the website you will visit.
Forward to session asset
You are going to open an external link to the asset as indicated by the session. Copernicus Meetings cannot accept any liability for the content and the website you will visit.
We are sorry, but presentations are only available for users who registered for the conference. Thank you.