
 1,1,1,2
- 1LATMOS, CNRS, Sorbonne Université, Université Versailles St Quentin, Paris, France
- 2Instituto de Astrofísica de Andalucía (IAA-CSIC), Granada, Spain
Introduction
The clouds of Venus are unique in the solar system, comprising multiple layers at an altitude ranging from 50 to 70 kilometres and enveloping the entire surface of the planet. They consist of droplets of liquid sulphuric acid (70-95% by mass) and water, exhibiting a bi- or tri-modal size distribution. It has been observed that the three modes have a radius of approximately 0.3, 1 and 2 micrometres, respectively(1).
Modelling these clouds represents a significant challenge in comprehending the dynamics of Venus atmosphere. However, the models that have been developed so far are mainly in 1D(2–6), and the few 2D and 3D models are limited to simplified equilibrium schemes(7–10). The present study focuses on the first 3D modelling of Venus clouds employing a comprehensive microphysics model, and its 1D validation. The Venus PCM(11, 12), a GCM that incorporates a comprehensive chemistry model, a radiative transfer scheme and a parametrisation of the clouds, is used in this study. The existing cloud parametrisation(10) assumes that the clouds are in a state of constant thermodynamical equilibrium with the water vapour and sulfuric acid at each timestep.
Method
We have coupled the MAD-VenLA model from the work of Guilbon(13) and Määttänen(14) to the Venus PCM. MAD-VenLA is a modal model that describes two particle modes that have a lognormal form and a fixed standard deviation. MAD-VenLA includes a scheme of homogeneous nucleation(15), a simplified parametrisation of heterogeneous nucleation, Brownian coagulation, condensation and evaporation(14). In addition, MAD-VenLA incorporates mode-merging(16) that allows transfer particles from one mode to another. The sedimentation scheme uses the Stokes terminal speed modified by the Cunningham correction.
Results
A key issue we have with the coupling of the 0D microphysical scheme and the 3D GCM is the difference between the timestep lengths (1s for 0D, 7 minutes for 3D). For ensuring stability of the calculations with the longer timestep in 3D, we have updated the solution of the condensation/evaporation scheme with a Runge-Kutta 4 scheme. We also adapted for our purpose the state-of-the-art sedimentation scheme adapted from Stolzenbach(10).
The goal of this study is to link a complete microphysical scheme to a state of the art GCM to reproduce realistic clouds in regards to 3D dynamical regime. Before presenting the 3D simulation results, we examine 1D simulations of several Venus Days. These tests aim to validate the behaviour of the microphysical scheme by comparing it to the observations and to other microphysical schemes (Fig 1,2).
We will present our first 3D simulations that are relatively short simulations initialized with the equilibrium state computed with the parametrisation from Stolzenbach(10). These simulations did not yet reach the steady states but they provide a first look the both vertical and the horizontal distributions of the cloud droplets.(Fig 3.)
We are planning to run longer 3D simulations to reach a steady-state in order to compare the simulated clouds to the observations of the past missions and also give information for the upcoming ones (EnVision, etc.).
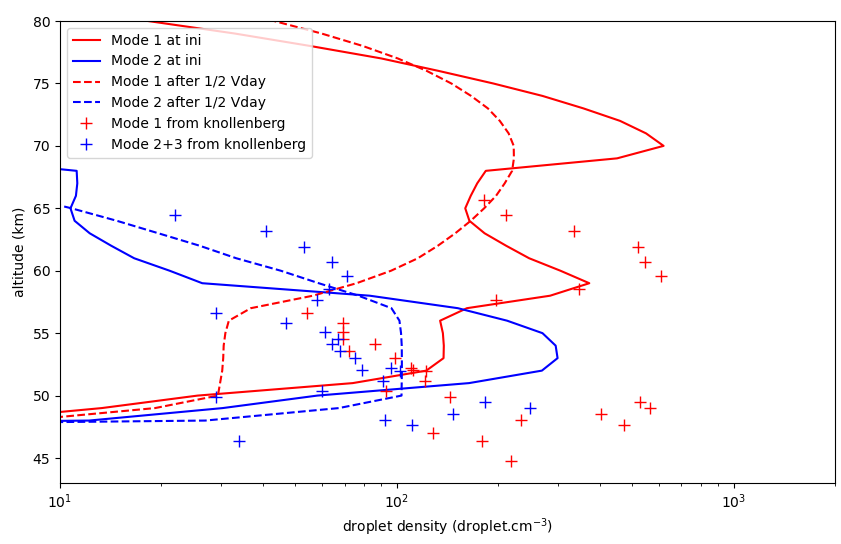
Figure 1: Droplet density profile (in droplet.cm-3) of mode 1 (in red) and mode 2 (in black) particles at the initialization (full line) and after half a Venusian day (dashed line) with the 1D version of the Venus PCM. The outputs are compared to the Knollenberg data (crosses). Since MAD-VenLA is only composed of 2 modes, we sum up the mass of the mode 2 and mode 3 from the Knollenberg data.
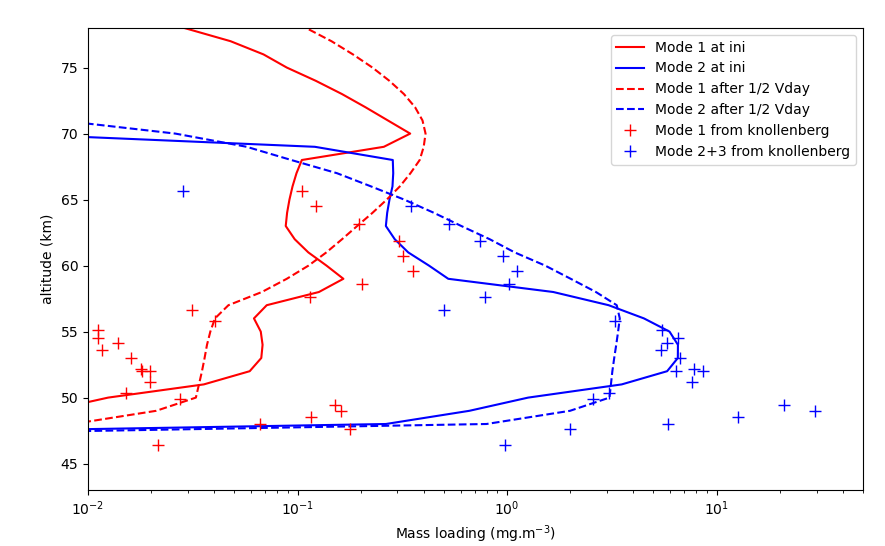
Figure 2 : Mass-loading profile (in mg.m-3) of mode 1 (in red) and mode 2 (in blue) particles at the initialization (full line) and after half a Venusian day (dashed line) with the 1D version of the Venus PCM. The outputs are compared to the Knollenberg data (crosses). Since MAD-VenLA is only composed of 2 modes, we sum up the mass of the mode 2 and mode 3 from the data.
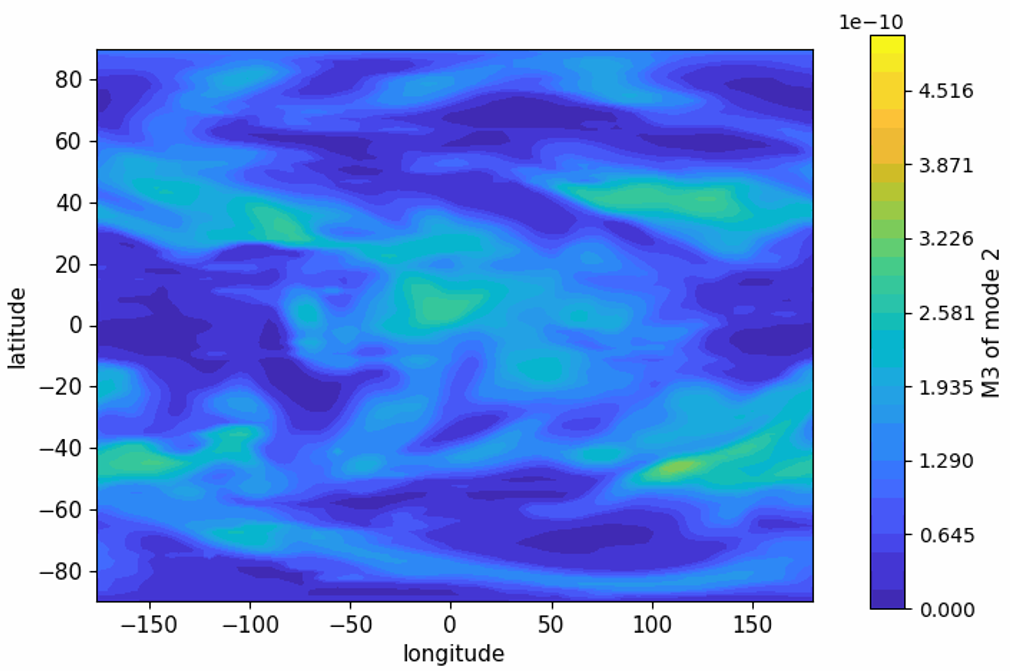
Figure 3: Horizontal map of the distribution of the 3rd order moment of mode 2 droplets after 2 terrestrial days at 55 km of altitude. This map is the result of a 3D simulation with the Venus PCM with MAD-VenLA. It presents the distribution of the volume of the droplets in each pixel.
References
- R. G. Knollenberg, D. M. Hunten, J. Geophys. Res. 85, 8039–8058 (1980).
- E. P. James, O. B. Toon, G. Schubert, Icarus. 129, 147–171 (1997).
- T. Imamura, G. L. Hashimoto, J. Geophys. Res. 103, 31349–31366 (1998).
- M. Yamamoto, M. Takahashi, J. Geophys. Res. 111, 2006JE002688 (2006).
- K. McGouldrick, E. L. Barth, Planet. Sci. J. 4, 50 (2023).
- H. Karyu et al., Planet. Sci. J. 5, 57 (2024).
- C. Lee, S. R. Lewis, P. L. Read, Icarus. 206, 662–668 (2010).
- H. Ando, M. Takagi, N. Sugimoto, H. Sagawa, Y. Matsuda, Journal of Geophysical Research: Planets, in press, doi:10.1029/2019JE006208.
- H. Karyu et al., Journal of Geophysical Research: Planets, in press, doi:10.1029/2022JE007595.
- A. Stolzenbach, F. Lefèvre, S. Lebonnois, A. Määttänen, Icarus. 395, 115447 (2023).
- S. Lebonnois, N. Sugimoto, G. Gilli, Icarus. 278, 38–51 (2016).
- G. Gilli et al., Icarus. 281, 55–72 (2017).
- S. Guilbon, thesis, Université Paris Saclay (COmUE) (2018).
- A. Määttänen, S. Guilbon, J. Burgalat, F. Montmessin, Advances in Space Research. 71, 1116–1136 (2023).
- A. Määttänen et al., JGR Atmospheres. 123, 1269–1296 (2018).
- E. Whitby, F. Stratmann, M. Wilck, Journal of Aerosol Science. 33, 623–645 (2002).
How to cite: Streel, N., Määttänen, A., Lefèvre, F., and Stolzenbach, A.: Detailed microphysics coupled with the Venus Planetary Climate Model : One-dimensional and three-dimensional simulations, EPSC-DPS Joint Meeting 2025, Helsinki, Finland, 7–12 Sep 2025, EPSC-DPS2025-97, https://doi.org/10.5194/epsc-dps2025-97, 2025.