Europlanet Science Congress 2020
Virtual meeting
21 September – 9 October 2020
Europlanet Science Congress 2020
Virtual meeting
21 September – 9 October 2020

Poster presentations and abstracts

MITM9

Modern space missions, ground telescopes and modeling facilities are producing huge amount of data. A new era of data distribution and access procedures is now starting with interoperable infrastructures and big data technologies. Long term archives exist for telescopic and space-borne observations but high-level functions need to be setup on top of theses repositories to make Solar and Planetary Science data more accessible and to favor interoperability. Results of simulations and reference laboratory data also need to be integrated to support and interpret the observations.

The Virtual Observatory (VO) standards developed in Astronomy may be adapted in the field of Planetary Science to develop interoperability, including automated workflows to process related data from different sources. Other communities have developed their own standards (GIS for surfaces, SPASE for space plasma, PDS4 for planetary mission archives…) and an effort to make them interoperable is starting.

Planetary Science Informatics and Data Analytics (PSIDA) are also offering new ways to exploit the science out of planetary data through modern techniques such as: data exploitation and collaboration platforms, visualisation and analysis applications, artificial intelligence and machine learning, data fusion and integration supported by new big data architecture and management infrastructure, potentially being hosted by cloud and scalable computing.

We call for contributions presenting progresses in the fields of Solar and Planetary science databases, tools and data analytics. We encourage contributors to focus on science use cases and on international standard implementation, such as those proposed by the IVOA (International Virtual Observatory Alliance), the OGC (Open Geospatial Consortium), the IPDA (International Planetary Data Alliance) or the IHDEA (International Heliophysics Data Environment Alliance), as well as applications linked to the EOSC (European Open Science Cloud) infrastructure.

Conveners: Christophe Arviset, Baptiste Cecconi | Co-conveners: Sébastien Besse, Angelo Pio Rossi

Session assets

Session summary

EPSC2020-214
André M. Silva, Sérgio G. Sousa, Nuno Santos, Olivier D. S. Demangeon, and Mafalda X. Matos

High precision time-series photometry from space is being used for a number of scientific cases. In this context, the recently launched CHaracterizing ExOPlanet Satellite (CHEOPS) (ESA) mission promises to bring 20 ppm precision over an exposure time of 6 h, when targeting nearby bright stars, having in mind the detailed characterization of exoplanetary systems through transit measurements. However, the official CHEOPS (ESA) mission pipeline only provides photometry for the main target (the central star in the field). In order to explore the potential of CHEOPS photometry for all stars in the field, we present archi, an additional open-source pipeline module to analyse the background stars present in the image. As archi uses the official data reduction pipeline data as input, it is not meant to be used as an independent tool to process raw CHEOPS data but, instead, to be used as an add-on to the official pipeline. We test archi using CHEOPS simulated images, and show that photometry of background stars in CHEOPS images is only slightly degraded (by a factor of 2–3) with respect to the main target. This opens a potential for the use of CHEOPS to produce photometric time-series of several close-by targets at once, as well as to use different stars in the image to calibrate systematic errors. We also show one clear scientific application where the study of the companion light curve can be important for the understanding of the contamination on the main target.

How to cite: M. Silva, A., G. Sousa, S., Santos, N., D. S. Demangeon, O., and X. Matos, M.: archi: pipeline for light curve extraction of CHEOPS background stars , Europlanet Science Congress 2020, online, 21 Sep–9 Oct 2020, EPSC2020-214, https://doi.org/10.5194/epsc2020-214, 2020.

EPSC2020-661
Santa Martínez, Mark S. Bentley, Thomas Cornet, M. Angeles Cuevas, Nicolas Fajersztejn, Marco Freschi, Daniel Galán, Julio Gallegos, Alan J. Macfarlane, Francisco Vallejo, Iñaki Ortiz de Landaluce, and Antonio Villacorta

The joint ESA/JAXA BepiColombo mission to Mercury comprises two orbiters and a solar-electric transfer module, currently in a stack configuration. The BepiColombo spacecraft stack flew by the Earth on 10th April 2020 and will perform eight flybys more on its way to Mercury: two at Venus (in October 2020 and August 2021), and 6 at Mercury, starting from October 2021, before orbit insertion in December 2025. The two spacecraft host many instruments designed to study Mercury's interior structure, surface properties, close space environment, and their interplay.

Processing the telemetry received from the spacecraft on ground into science products for the archive and providing quick access and visibility of the science results to the science team are the responsibility of the ESA Science Ground Segment (SGS). Raw and calibrated science products are generated by the data processing pipelines within hours after reception of the telemetry and can be visualised through a Quick-Look Analysis (QLA) web-application. Science products are also made available in the Planetary Science Archive (PSA) to the instrument teams for detailed analysis and further processing.

This contribution will describe how the SGS data processing and quick-look analysis infrastructure, in operation since launch, has been enhanced to support the monitoring, sharing and analysis of all the scientific measurements that will be acquired during the flybys. This infrastructure includes instrument-specific calibration and reduction processing pipelines developed by the PI teams. Reduction pipelines are hosted either by the SGS or by the corresponding PI team based in a prime-redundant configuration and with a replica always available at the SGS.

The Quick-Look Analysis web-application is intended to provide rapid feedback on the content and quality of the science archive products, to support the diagnosis of pipeline or instrument issues, to facilitate the monitoring of deviations of the executed observations from the planned observations and, when possible, to feedback the result of the analysis into the different cycles of the science planning. This strategy is science-driven and offers the possibility of exploring and sharing information and plots of the science data collected by both the MPO and MMO instruments among the BepiColombo science working team members.

In addition to the Quick-Look Analysis web-application, all the spacecraft and payload housekeeping parameters are made available to the science team via a web-based user interface (WebMUST). This interface allows monitoring of the spacecraft and instrument operations in near-real time, as the telemetry arrives on ground. Pre-configured dashboards can be designed for specific needs such as monitoring the data volumes in the packet stores of the on-board mass memory (SSMM) along with the switch on of the various instruments of the BepiColombo payload.

Despite the limited science capabilities of the spacecraft in cruise configuration (as the boresight of many instruments is partially or fully blocked by the Mercury Transfer Module), several instruments will perform calibration and scientific measurements during flybys. Some examples of how the science observations can be monitored with the tools developed by the SGS will be presented. The main goal of these tools is to make available to the science team all the information relevant for the post-analysis of the executed observations and to capture and preserve this knowledge for the future users of the BepiColombo data in the scientific community.

How to cite: Martínez, S., Bentley, M. S., Cornet, T., Cuevas, M. A., Fajersztejn, N., Freschi, M., Galán, D., Gallegos, J., Macfarlane, A. J., Vallejo, F., Ortiz de Landaluce, I., and Villacorta, A.: BepiColombo Science Data Processing & Quick-Look Analysis, Europlanet Science Congress 2020, online, 21 Sep–9 Oct 2020, EPSC2020-661, https://doi.org/10.5194/epsc2020-661, 2020.

EPSC2020-920
Edoardo Rognini, Angelo Zinzi, Davide Grassi, Alberto Adriani, Alessandro Mura, and Maria Teresa Capria and the JIRAM team

MATISSE (Multi-purpose Advanced Tool for the Solar System Exploration) [1] is a tool that allows the visualization of observations from space missions and datasets derived from these observations on  a  three-dimensional  model  of  the  selected  target  body.  The  second  version  of  the  tool  (named MATISSE  2.0 –https://tools.ssdc.asi.it/Matisse)  will,  among  other  things,  include  algorithms developed  by  partner  research  teams;  in  this  work  we  focalize  our  attention  on  the  MATISSE inclusion of two codes developed for atmospheric retrieval and thermophysical modeling. The retrieval code is used for the analysis of the spectra provided by the JIRAM instrument (Jovian Infrared Auroral Mapper [2]) onboard the NASA’s Juno mission, whose main purpose is the study of the upper regions of Jupiter’s atmosphere in the 2-5 μm wavelength range and pressure up to 5-7 bar. The spectra provided by the instrument are processed with the retrieval code that calculates, for each pixel of a hyperspectral image, the chemical and physical parameters in the corresponding points of the  atmosphere  [3].  The  code  processes  all  pixels  of  a  hyperspectral  image,  so  parallelization  is convenient  in  order  to  reduce  the  computation  time;  this  is  possible  by  using  the  Python  language tools, which allow the execution of a code written in its own language (FORTRAN in this case) by providing  the  required  parallelization. As a further optimization step,  the  code has been converted into a Docker image to make it portable and easy to run on heterogeneous architectures. The second  code  included  in  MATISSE  is  a  thermophysical  model  that  calculates  the  surface temperature of airless bodies as function of thermal conductivity [4,5] and other physical properties; the calculated temperature can be compared with the measured ones, if any, in order to retrieve the thermal properties of the soil, or can be used to compute other temperature-dependent quantities. At the present time this code is going to be used for Mercury and Ceres and is almost ready to be included in MATISSE 2.0.

[1] Zinzi, A., et al. (2016), Astronomy & Computing, 15, 16-28
[2] Adriani, A., et al. (2017), Space Science Reviews, 213, 393-446
[3] Grassi et al. (2010), Planetary and Space Science, 58, 1265-1278
[4] Capria, M. T. et al (2014), Geophysical Research Letters, 41, 1438-1443
[5] Rognini et al. (2019), Journal of Geophysical Research, https://doi.org/10.1029/2018JE005733

How to cite: Rognini, E., Zinzi, A., Grassi, D., Adriani, A., Mura, A., and Capria, M. T. and the JIRAM team: Inclusion of scientific algorithms in MATISSE, Europlanet Science Congress 2020, online, 21 Sep–9 Oct 2020, EPSC2020-920, https://doi.org/10.5194/epsc2020-920, 2020.

EPSC2020-925
Ruben Docasal, Isa Barbarisi, Javier Arenas, Silvia De Castro, Angel Montero, Jose Osinde, Francisco Raga, Jorge Ruano, Jaime Saiz, Bruno Merin, Sebastien Besse, Mark Bentley, Daniela Coia, Diego Fraga, Emmanuele Grotheer, David Heather, Tanya Lim, and Santa Martinez

Abstract

Geographical information systems (GIS) are becoming increasingly used for planetary science. GIS are computerised systems for the storage, retrieval, manipulation, analysis, and display of geographically referenced data.

Some data stored in the Planetary Science Archive (PSA)[1] have spatial metadata associated to them. To facilitate users in handling and visualising spatial data in GIS applications, the PSA should support interoperability with interfaces implementing the standards approved by the Open Geospatial Consortium (OGC).

These standards are followed in order to develop open interfaces and encoding that allow data to be exchanged with GIS Client Applications (e.g. OpenLayers, Cesium...). Access to this data for use in applications can be provided through OGC Web Service (OWS) implementations.

An existing open source server is GeoServer, an instance of which has been deployed for the PSA, that uses the OGC standards to allow the sharing, processing and editing of data and spatial data through the Web Map Service (WMS) and Web Feature Service (WFS) standards. On the back-end side, a PostgreSQL/PostGIS instance allows the spatial queries.

The final goal is to enhance the PSA (accessible through ) further as a portal which enables science exploitation of ESA's planetary missions datasets. This can be facilitated through the GIS framework, offering interfaces (both web GUI and scriptable APIs) that can be used more easily and scientifically by the community, and that will also enable the community to build added value services on top of the PSA.

Introduction

Some of the current operational ESA planetary missions, such as Mars Express, ExoMars 2016, and BepiColombo, as well as other future missions such as ExoMars 2020, Juice, etc. will benefit of a GIS tool to visualize their targets (Mars, Mercury, Jupiter…) allowing spatial queries to retrieve geometrical information like features, footprints, rover path tracking, rover drill sites, etc.

GIS Architecture

The PSA relies on 3-tiered system for the GIS architecture (see Figure 1). The database layer is composed of a PostgreSQL database with the PostGIS extension to store the spatial information. The server layer uses GeoServer as a map server to provide WMS/WFS responses (e.g. GeoJson, kml…) to the web application’s requests (implemented on the Vaadin framework). Finally, the client layer (browser) runs the OpenLayer Javascript library to render the map.

Other external GIS tools like QGIS might be used to get the PSA spatial data from either the GeoServer or the database.


Figure 1: GIS architecture diagram for the PSA

Views Consistency

The PSA provides different views to show the same planetary data. These views are integrated and synchronized to each other to visualize the information as the data type requires. All of them use the filter menu to search by a given criteria and offer similar features such as sorting, pagination, downloading and product detailed info. Once a query is executed on a view, the information is automatically loaded when changing views. The map view is integrated in the current PSA (see Figure 2) as the other views (Table, Image) giving other perspective of displaying results when it comes to search for spatial data.


Figure 2: Views Consistency in the PSA

GIS Applicability

GIS technology on the PSA will offer a common way to filter (by mission, instrument, target, dates, geometry…) and search for spatial data, even for legacy missions, thanks to the homogenization of the geometrical information with per-product spatial metadata computed in a consistent way via SPICE.

PSA will provide spatial data retrieval of both versions of the NASA Planetary Data Systems archival formats, PDS3 and PDS4, based on a criteria search, and, the possibility of selecting PDS3/PDS4 products from a particular region of interest (ROI) (see Figure 3).


Figure 3: Query by ROI and footprint selection

PSA also provides other useful GIS tools such as switching projections for better visualization and analysis of footprints over the poles (see Figure 4) as well as switching between different base maps of Mars for better visualization, enabling/disabling layer feature, overlapping footprint selection by popup and a grid/graticule layer.

Figure 4: Footprints over the Mars North Polar projection

PSA also allows the user to add customized and external data through a GeoJSON file uploader tool (see Figure 5).

Figure 5: GeoJSON data uploader feature

Acknowledgement

Although the whole PSA team has somehow been involved in this GIS implementation, I would specially like to thank Francisco Raga for his huge contribution in many of the presented GIS features.

References

[1] Besse, S. et al. (2017) Planetary and Space Science, , ESA's Planetary Science Archive: Preserve and present reliable scientific data sets.

How to cite: Docasal, R., Barbarisi, I., Arenas, J., De Castro, S., Montero, A., Osinde, J., Raga, F., Ruano, J., Saiz, J., Merin, B., Besse, S., Bentley, M., Coia, D., Fraga, D., Grotheer, E., Heather, D., Lim, T., and Martinez, S.: GIS Architecture and its Applicability for the Planetary Science Archive, Europlanet Science Congress 2020, online, 21 Sep–9 Oct 2020, EPSC2020-925, https://doi.org/10.5194/epsc2020-925, 2020.

EPSC2020-1086
Jesús Zafra, César Quintana, Maite Diez, Sergio Ibarmia, Laura Seoane, Miguel Ramiro, Carlos Pérez, Andoni Moral, Fernando Rull, and Olga Prieto-Ballesteros

Introduction

The Raman Laser Spectrometer (RLS) [1] is one of the Pasteur Payload instruments belonging to the analytical suite onboard the ExoMars’ Rosalind Franklin Rover that will perform Raman spectroscopy on samples extracted from the Martian subsoil for a definitive identification and characterization of minerals and biosignatures [2] in order to address the question of whether life has ever existed on Mars.

At the whole life cycle of the instrument, quite testing campaigns are accomplished with the flight and flight-representative models (RLS FM, FS and EQM). Outcomes from some of them, mainly the ones dedicated to get functional and performance capacities of the instrument, may be very useful as reference results during the operations phase in Mars and, also, to learn about the instrument itself (possible design improvements, ageing influence, etc.).

But all these outcome data is not easy to manage, on the one hand because lots of telemetries and parameters are generated during each test and, on the other hand because it is very important to have into account the specific conditions for each test.

So, for RLS, the need to archive properly all this data, including test conditions, and to ease its analysis led to the challenge of developing a tool for scientist and engineers to handle this outcome, so that they can easy access to data and compare results from different tests and modes and perform long-term analysis of the RLS instrument scientific and technical performance.

In this context, RASTA (RLS Archive and Supporting Tool for Analysis) has been conceived as a solution for managing all the RLS data generating during different on-ground test campaigns) in addition to those that will be generated by the RLS FM during operations at Mars surface.

RASTA (RLS Archive and Supporting Tool for Analysis)

The overall RASTA architecture is shown in Figure 1. RASTA has 3 main elements: RASTA-Parsers, RASTA-DB (Database) and RASTA-MS (Matlab® Scripts).

Therefore, RASTA tool consists in a structural and relational database and several parser files that allow to analyze the data generated by the instrument and insert the raw data into RASTA-DB. Once all of the above is done, the users can consult the available data to perform their engineering or science analysis using the user-oriented RASTA-MS (Matlab® Scripts).

As depicted in Figure 1, RLS sessions act inside the RASTA architecture as the input files, which could be found in two formats:

  • RLS IDAT (Instrument Data Analysis Tool) .rls files: for ground session performed with the End-to-end Ground Testing Framework [3] as EGSE. Those sessions are generated by RLS IDAT, a software tool that can be used for the reception, decodification, calibration and verification of the TMs (science and housekeeping) generated by the RLS instrument.
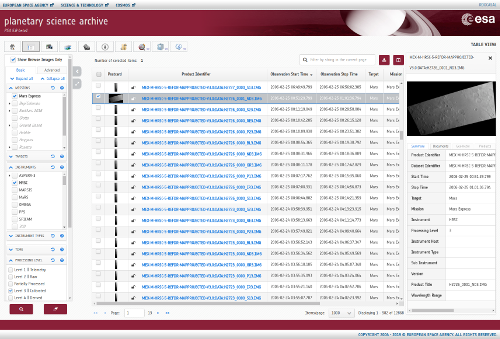
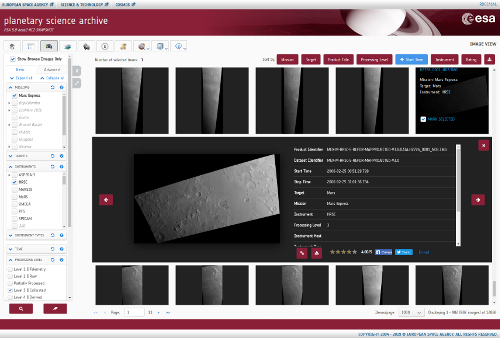
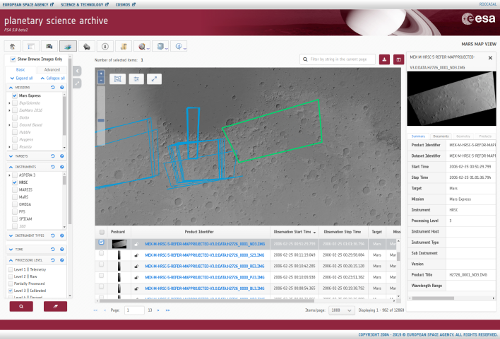
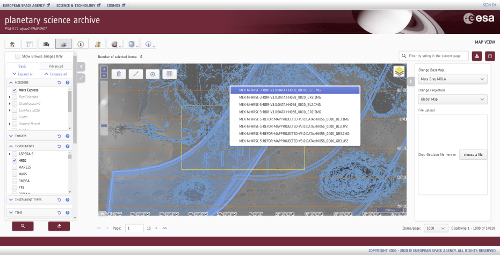
  • PDS4 (Planetary Data System, version 4) files for ground and flight sessions performed with the Rover different models: Rover OBC (onboard computer) inside ATB (ExoMars rover Avionic Test Bench), GTM (ExoMars rover Ground Test Module) or PFM (ExoMars rover Proto-flight Model). PDS4 [4] is the official archive system for the ExoMars Mission data. 

Figure 1- RASTA architecture diagram

According to the type of the RLS session input files, the RASTA-Parser extracts the relevant data and stores it into the RASTA-DB. RASTA-DB is a relational open source database developed in SQL language hosted on a server, for allowing ‘read permission’ access to RLS scientists’ and engineers’ community. In order to properly archive each RLS data, a dedicated metadata file is linked to the data provided, so that every aspect of the session like: test purpose, test sequence, mission phase or environment conditions could be addressed to the RASTA-Parsers, before the session is committed into RASTA-DB.

Finally, in order to support the users’ analysis, a software library based on Matlab® language has been developed. This library consists of:

  • Low-level library: implementing basic searches in RASTA-DB.
  • Use cases: specific analysis, implemented as sets of calls to ‘Basic scripts’ plus some additional logics or math.

The main feature of the tool is that the users can develop their own Matlab® custom analyses by calling the basic ones as ‘building-blocks’ for implementing their analyses.

Conclusion

RASTA provides a solution for archiving and supporting the analysis of the large amounts of data generated by RLS in its multiple campaigns performed not only in ground, but also during Mars operation in the coming years. It is a powerful tool to do long term analysis of scientific and engineering performance across different sessions of different RLS models.

Acknowledgements

MINECO grants ESP2014-56138-C3-1-R, ESP2014-56138-C3-2-R, ESP2107-87690-C3-1-R, ESP2107-87690-C3-3-R.

References

[1] Moral, A.G., et al, A Raman Spectrometer for the ExoMars 2020 Rover, European Planetary Science Congress 2017, 17-22 September, 2017, Riga Latvia, id. EPSC2017-1001.

[2] Rull, F., et al, The Raman Laser Spectrometer for the ExoMars Rover Mission to Mars, Astrobiology, 2017, vol. 17(6-7), 627-654.

[3] J. Zafra et al., End-to-end Ground Testing Framework for Raman Laser Spectrometer (RLS) on board Exomars 2020, in Simulation and EGSE for Space Programmes- sesp 2019.

[4] Jet Propulsion Laboratory California Institute of Technology Pasadena, California, Planetary Data System Standards Reference, Version 1.14.0, may 22, 2020.


How to cite: Zafra, J., Quintana, C., Diez, M., Ibarmia, S., Seoane, L., Ramiro, M., Pérez, C., Moral, A., Rull, F., and Prieto-Ballesteros, O.: RASTA: a supporting tool to manage all the data generated by the RLS instrument for ExoMars, Europlanet Science Congress 2020, online, 21 Sep–9 Oct 2020, EPSC2020-1086, https://doi.org/10.5194/epsc2020-1086, 2020.