Poster presentations and abstracts
This session welcomes presentations on all aspect of the Venus system including interior, surface, atmosphere and ionosphere. We welcome presentations based on past or current observations, theory and modelling, as well as presentations related to future instruments and missions including the ESA-NASA proposed EnVision Venus orbiter and NASA Discovery Venus missions.
Session assets
For more than 3 decades the existence of lightning discharge in Venus has been controversial, which might be caused by insufficient observational methods optimized for such purpose. There had been no satellite payload intentionally designed for the detection of lightning phenomena using radio waves or optical sensors. LAC, lightning and airglow camera, onboard Akatsuki spacecraft developed by Hokkaido University together with JAXA, is the first sensor made for the lightning optical flash detection in planets other than the Earth. A unique performance of LAC compared to other equipment used in the previous exploration of Venus is the high-speed sampling rate at 20 kHz with 32 pixels of Avalanche Photo Diode (APD) matrix, enabling us to distinguish the natural optical lightning flash from other pulsing noises, including artificial electrical noise and cosmic rays. We selected OI 777 nm line for lightning detection, which is expected to be the most prominent emission in the CO2-dominant atmosphere based on the laboratory discharge experiments carried out by some researchers. We have been conducting lightning hunt since October 2016 with LAC onboard Akatsuki, selecting triggering parameter sets optimized for the light curve similar to the normal lightning and also for sprite type in the Earth, which has a slower variation of optical intensity. The total coverage of the LAC lightning hunt became approximately 100 [million km2-hr], meaning 86 percent detectability of previous results with a ground-based telescope by Hansell et al. (1995). Here we report the update of the detailed examination of recorded data by LAC for these almost 4 years and discuss their possible interpretation, considering all kinds of candidates of optical and other sources. Also, the future observation strategy including ground observation with a high-speed photometer installed at the ground telescope and radio observation will be introduced.
How to cite: Takahashi, Y., Imai, M., Sato, M., and Oono, T.: 4-years lightning hunt in Venus , Europlanet Science Congress 2020, online, 21 Sep–9 Oct 2020, EPSC2020-836, https://doi.org/10.5194/epsc2020-836, 2020.
- Abstract
Lightning in planetary atmospheres are generated by the convections, so the detection of lightning can be used to deduce the atmospheric dynamics and the large-scale structures on other planets. In the case of Jupiter, the lightning flashes have been observed in the dense clouds. Previous studies (e.g. Gierasch et al., 2000; Ingersoll et al., 2000) suggested that zonal jet is driven by small-scale eddies that receive their energy from moist vertical convection which similar to large thunderstorm on the Earth. Although it is difficult to know the vertical convections within the dense clouds, lightning clusters are correlated with the cumulonimbus, and thus lightning observations can be used to investigate the formation of Jupiter’s zonal jet structure. In Venus, the existence of Venusian lightning is controversial for 40 years, and the possible generation mechanisms are convection, volcanic, or aeolian triboelectric activity. In the previous study, there are radio wave observations and optical observations by CCD. Although some of the observations have detected lightning, no unambiguous lightning flash events have been detected recently by LAC (Lightning and Airglow Camera) onboard AKATSUKI Venus Climate orbiter (Lorenz et al., 2019). There is no robust evidence of existence the lightning because it is difficult to distinguish between the lightning signal and the electrical noise or other plasma waves, the observation area is limited, and the CCD’s sensitivity is not enough for lightning flashes. If we can confirm the existence of Venusian lightning like the Jovian, it could also be an indicator of Venusian atmospheric dynamics.
To reveal the relationship between lightning and atmospheric dynamics of Jupiter and Venus, we have developed the Planetary Lightning Detector (PLD), which is the high-speed and high-sensitive lightning detector mounted on a 1.6-m ground-based telescope “Pirka” by using a photomultiplier tube to observe the planetary lightning. Pirka telescope, operated by the Faculty of Science, the Hokkaido University, is primarily dedicated to observations of the planets of the Solar System. Using this telescope we can obtain an observation period at least one hour per day for several months, longer than the previous studies. We can obtain the light-curve of flash events with a sampling rate of >20 s-1to distinguish the other flashes and decrease the contamination of dayside light and sky to improve the Signal-to-Noise ratio. We will reveal the concentrate of lightning and its frequency, and then we derive the distribution of a few tens km scale vertical convections. We compare the results and the variation of wind velocity or cloud distribution to reveal the atmosphere dynamics.

Figure 1: The layout of inside of PLD.
777.4 nm (atomic oxygen) is the predicted strong emission line in the Venus lightning spectra (Borucki et al. 1996). PLD equips narrowband filter (FWHM = 1 nm) of 777 nm. PLD observes the light by using a Photomultiplier tube. The minimum exposure time is 50 microseconds. The maximum time resolution is about 2x10⁴ points/s. PLD’s FOV can be changed to 5”, 10”, 30”, 60” pinhole, and 2”x11” slit by using field stops. Slit and pinhole are used for Venus’s night-side observation. To obtain the lightning’s light curve, we operate the bandpass filter to remove noise and large time scale variation by the atmosphere. We have observed Venus by using PLD from May 2020. In our Venus observation, we could find several possible lightning events having large count values above 4-sigma of the background level. The detection frequency was 3 events per 2000 s observation period. The estimated peak energy of light-curve is about from 8.9×10⁷ to 1.4×10⁸ J. The calculated event rate is ~10-11 [s-1km-2], which is ten times larger than the result of previous study 2.7×10⁻¹² [s-1km-2] (Hansell et al., 1995). Although, our observation duration is not sufficient to compare with the previous study. we will increase the observation time up to 3 hr in total.

Figure 2: RAW data light-curve of a detected event on 05/18. The triggered time set to 0 s.
In this presentation, we will introduce the newly developed lightning observation instrument PLD and present our observation results obtained from May 2020. We will also show our future coordinated observation with LAC.
- References
[1] Borucki, W. J., McKay, C. P., Jebens, D., Lakkaraju, H. S., and Vanajakshi, C. T. (1996). Spectral Irradiance Measurements of Simulated Lightning in Planetary Atmospheres. Icarus, 123, 336-441
[2] Gierasch, P. J., Ingersoll, A. P., Banfield, D., Ewald, S. P., Helfenstein, P., Simon-Miller, A., Vasavada, A., Breneman, H. H., Senske, D. A., and Galileo Imaging Team (2000). Observation of moist convection in Jupiter’s atmosphere. Nature, 403(6770), 628-630
[3] Hansell, S. A., Wells, W. K., and Hunten, D. M. (1995). Optical Detection of Lightning on Venus. Icarus, 117, 345-351
[4] Ingersoll, A.P., Gierasch, P.J., Banfield, D., Vasavada, A.R., and Galileo Imaging Team (2000). Moist convection as an energy source for the large-scale motions in Jupiter’s atmosphere. Nature, 403, 630–632
[5] Lorenz, R. D., Imai, M., Takahashi, Y., Sato, M., Yamazaki, A., Sato, T. M., et al. (2019). Constraints on Venus lightning from Akatsuki's first 3 years in orbit. Geophys. Res. Lett., 46, 7955–7961. https://doi.org/10.1029/ 2019GL083311
How to cite: Ono, T., Takahashi, Y., Sato, M., Watanabe, S., Takagi, S., and Imai, M.: Ground-based Observation of planetary lightning flashes with Photomultiplier tube, Europlanet Science Congress 2020, online, 21 Sep–9 Oct 2020, EPSC2020-231, https://doi.org/10.5194/epsc2020-231, 2020.
Venus is entirely covered by optically thick clouds that play essential roles in the Venus' climate system. The cloud consists of H2SO4 aerosols, and H2SO4 is produced from SO2 photochemically at the cloud top. SO2 is abundant in the lower part of the cloud layer and the subcloud region (Bertaux, 1996), and is thought to be transported to the cloud top in the sulfur cycle (Mills et al., 2007), although the dynamical processes responsible for the transport are not understood. The purpose of our study is to confirm that SO2 is supplied from the lower atmosphere to the cloud top where it is lost via photochemical reactions and to determine how the stationary planetary-scale circulation and time-varying disturbances contribute to the SO2 transport. The horizontal divergence calculated from the cloud-tracked wind (Ikegawa and Horinouchi, 2016; Horinouchi et al., 2018) is considered as an index of the vertical flow in the cloud: a horizontally divergent (convergent) flow will tend to correspond to an upward (downward) wind for convection-like motions, while the divergence is out of phase with the vertical wind by 90 degrees for gravity waves including thermal tides. The 283-nm radiance, which is subject to SO2 absorption, measured by Akatsuki UVI (Yamazaki et al., 2018) was converted to UV albedo following the method of Lee et al. (2015, 2017), and low (high) albedo regions are considered to be regions of high (low) SO2 density. By comparing the Lagrangian derivative of UV albedo with the horizontal divergence, the relation between the change of the cloud-top SO2 and the vertical flow was obtained for independent air parcels and the mean field. The result shows that the solar-fixed structure of the UV albedo is consistent with the supply of SO2 by the updraft phase of the thermal tides and that transient and localized UV albedo variations are consistent with the supply of SO2 by ascending flows coincident with horizontal divergences.
How to cite: Iwanaka, T., Imamura, T., Lee, Y. J., and Yamazaki, A.: Spatial and temporal variability of UV albedo and its relation to the wind field revealed by Akatsuki UVI, Europlanet Science Congress 2020, online, 21 Sep–9 Oct 2020, EPSC2020-786, https://doi.org/10.5194/epsc2020-786, 2020.
The 100% cloud coverage of Venus leads to its high reflectance of the solar irradiance. However, in the ultra-violet (UV) range Venus’ brightness is reduced due to the absorptions of an unknown absorber and SO2 gas. The unknown absorber is a mystery not only for its chemical composition, but also for its vertical location. This latter factor is an important constraint to estimate a solar heating rate. In this study, we use disk-integrated phase curves and estimate a possible vertical location of the unknown absorber, relative to the cloud top level. We also expand the same method to estimate the SO2 gaseous abundance at the cloud top level.
We used 283 and 365-nm narrow filter images taken by the UV camera onboard Akatsuki (UVI, [1]). We have selected global Venus images with a sufficient signal over 3 years (2016-2018) to calculate the disk-integrated reflectance. Total ~6,000 images per filter have been collected in a broad range of solar phase angle, 0-155°, and we calculated mean phase curves at the two UV wavelengths as shown in Fig.1. We used a pre-conditioned backward Monte Carlos (PBMC) algorithm that solves the vector radiative transfer equation [2] to fit the observed mean phase curves. This PBMC was successfully used to analyze Venus’ phase curves in the visible range [3]. In this study, we assumed a global Venus cloud top structure with a 70-km cloud top level (unity tau) and a 4-km aerosol scale height, and changed a relative location of the unknown absorber layer from the assumed cloud top level. Cloud aerosols’ microphysical properties were taken from previous observation analysis [4,5]. We find that the 365-nm phase curve is sufficiently sensitive on the vertical location of the unknown absorber, as this is the only one absorption agent. Our best fits suggest that the unknown absorber layer should be centered at 3 km below the cloud top level, or lower, regardless of its thickness (2, 6, 10 km thickness, Fig. 2 shows that with the 6-km thickness). The 283-nm phase curve has been analyzed for the first time. However, we find a difficulty on a distinction of absorbing agents between the SO2 gas and the unknown absorber (Fig. 3), using only the phase curve.
We have analyzed the 3-year mean solar phase curves at 283 and 365 nm acquired by UVI/Akatsuki. Our results at 365 nm suggest that the unknown absorber layer should be located near and below the cloud top level, but not above. This supports the analysis of Pioneer Venus observations [6], suggesting that the unknown absorber is a layer below the cloud top level. We rule out a well-mixed layer above the cloud top level, which was suggested as a possible solution [7]. Our analysis shows its limit at 283 nm to understand abundance of the SO2 gas due to the overlapped absorption of the unknown absorber. This limitation perhaps can be able to overcome with spectral information, such as planned observation by the UV spectrometer onboard BepiColombo during its cruise phase (August 2020).

Figure 1 Observed mean disk-integrated reflectance at 365 nm (a) and 283 nm (b) as a function of solar phase angle (degree). Grey dots are individual data points, and the red curve is an average over 3 years (2016-2018).

Figure 2 Analysis at 365 nm with an assumed 6-km thick unknown absorber layer. A2 refers to the unknown absorber. (a) Reduced Chi-square contour compared to the observed phase curve. Free variables are an absorption ratio of the unknown absorber (A2_R) at 365 nm and a vertical location of the unknown absorber layer. Dashed line indicates the cloud top level, 70 km, so ‘-’ means below the cloud top level and ‘+’ means above. (b) A comparison between the observed mean phase curve (red) and a simulated best-fit curve (black, the ‘x’ mark on (a)).

Figure 3 Analysis at 283 nm. This used the best-fit condition of the unknown absorber layer as retrieved in Fig.2: the 6-km thick layer of unknown absorber is centered at 3 km below the cloud top level. (a) Reduced Chi-square contour, compared to the observed phase curve. Free variables are an absorption of the unknown absorber (A2_R) at 283 nm and an abundance of SO2 gas at the cloud top level (70 km). The yellow line indicates the mean SO2 gas abundance retrieved from ground-based mid-IR observations cloud top level in 2016-2018 (22.4 ppbv at 70 km. This is a converted value from the 450 ppbv at 61 km [8] using the same manner in [9]). (b) Comparison between the observed mean phase curve (red) and simulated curves (blue and oranges), as indicated in (a).
References
[1] Yamazaki et al. 2018, EP&S, 70, 23, https://doi.org/10.1186/s40623-017-0772-6
[2] García Muñoz and Mills 2015, A&A 573, A72, https://doi.org/10.1051/0004-6361/201424042
[3] García Muñoz et al. 2014, A&A, 566, L1, https://doi.org/10.1051/0004-6361/201423531
[4] Luginin et al. 2016, Icarus, 277, 154, https://doi.org/10.1016/j.icarus.2016.05.008
[5] Lee et al. 2017, AJ, 154, 44, https://doi.org/10.3847/1538-3881/aa78a5
[6] Esposito, 1980, JGR, 85, 8151, https://doi.org/10.1029/JA085iA13p08151
[7] Molaverdikhani et al. 2012, Icarus 217, 648–660, http://dx.doi.org/10.1016/j.icarus.2011.08.008
[8] Encrenaz et al. 2019, A&A, 623, A70, https://doi.org/10.1051/0004-6361/201833511
[9] Marcq et al. 2020, Icarus, 252, 335:113368, https://doi.org/10.1016/j.icarus.2019.07.002
How to cite: Lee, Y. J., García Muñoz, A., Yamazaki, A., Yamada, M., Watanabe, S., and Encrenaz, T.: Analysis of Venusian UV phase curves acquired by the UV camera onboard Akatsuki, Europlanet Science Congress 2020, online, 21 Sep–9 Oct 2020, EPSC2020-667, https://doi.org/10.5194/epsc2020-667, 2020.
The Venus cloud consists of a main cloud deck at 47 – 70 km, with thinner hazes above and below. The upper haze on Venus lies above the main cloud surrounding the planet, ranging from the cloud top (70 km) up to as high as 90 km.
The Solar Occultation in the InfraRed (SOIR) instrument onboard Venus Express (ESA) was designed to measure the Venusian atmospheric transmission at high altitudes (65 – 220 km) in the infrared wavelength range (2.2 – 4.3 µm) with a high spectral resolution. In Takagi et al. (2019), the optical properties of Venus’s haze layer above 90 km have been investigated using SOIR observations. Vertical and latitudinal profiles of the extinction coefficient, optical thickness, and mixing ratio of aerosols are retrieved.
A new cloud model was constructed based on the results of Takagi et al. (2019). In this presentation, I will show the results of a radiative transfer calculation (in the near-infrared region) that incorporates a new cloud model and discuss themeteorological some changes that contribute to cloud variation. Furthermore, I will introduce Venus observation plan using the 1.6 m Pirka telescope and Multi-Spectral Imager (MSI) [Watanabe et al., 2012] mounted on the Cassegrain focus of the telescope at the Nayoro Observatory of Hokkaido University.
How to cite: Takagi, S.: The variation of Venus cloud investigated from SOIR onboard Venus Express, Europlanet Science Congress 2020, online, 21 Sep–9 Oct 2020, EPSC2020-737, https://doi.org/10.5194/epsc2020-737, 2020.
Atmospheric gravity waves are thought to play crucial roles in transporting momentum and energy in planetary atmospheres. They are frequently observed as localized quasi-monochromatic wave packets in cloud images, while the vertical structures of the wave packets have not been investigated. The wavelengths and the packet lengths should reflect the generation processes of the respective wave packets. Though wave packets are thought to propagate independently, they are superposed on each other to induce an unstable field. The statistical characteristics of wave packets need to be known to understand the roles of the waves in the development of the atmospheric structure.
We study the characteristics of gravity wave packets in Venus’s atmosphere using high vertical resolution temperature profiles obtained by Venus Express and Akatsuki radio occultation experiments with radio holographic methods (Imamura et al. 2018). Localized disturbances are extracted by applying wavelet transform to the vertical temperature distributions. The analysis showed that (1) wave packets having different wavelengths are overlapped with each other, (2) each wave packet typically includes <3 cycles, (3) waves with vertical wavelengths of ~1 km are frequently seen,(4) individual wave packets are hardly saturating in isolation, while saturation occurs as a result of superposition of wave packets, and (4) short-vertical wavelength waves are more frequently observed at lower altitudes.
How to cite: Imamura, T., Mori, R., Ando, H., Peralta, J., Häusler, B., Pätzold, M., and Tellmann, S.: Wavelet analysis of gravity waves on Venus using radio occultation temperature profiles, Europlanet Science Congress 2020, online, 21 Sep–9 Oct 2020, EPSC2020-639, https://doi.org/10.5194/epsc2020-639, 2020.
We present new measurements of zonal and meridional wind velocities at Venus cloud-tops (~70 km) based the Doppler velocimetry method.
Venus is usually referred to as Earth’s twin due to its similarities, namely the mass, radius, density and bulk chemical composition. However, a retrograde and slow rotation of the planet (a day is longer than a year), a dense atmosphere with high concentration of CO2 and a dynamic circulation of high speed winds in a superrotational state are some of the characteristics make Venus a unique and very distinctive planet. The measure of both wind circulations at cloud top is essential to our understanding of the Venus’ atmospheric circulation and to constrain the dynamics that maintain the superrotational state. The study of Venus’ atmosphere can be a fundamental key in our understanding of atmospheric dynamics and evolution of any the so-called Earth-like planet, including Earth itself.
The observations were carried out between 25 and 29 March 2015, at the Echelle SpectroPolarimetric Device for the Observation of Stars (ESPaDOnS) at Canada-France-Hawaii Telescope (CFHT), in Mauna Kea, Hawaii. The spectrograph provides spectra from 370 to 1050 nm, with a resolution of up to 81000.
The Doppler velocimetry method used in this work was initially developed by Widemann et al. (2008) and further improved and fine-tuned by Machado et al. (2012, 2014). The technique has proven to be a reference on the retrieval of zonal and meridional wind at Venus’ cloud top, with both long slit and fibre fed spectrographs, as shown in Machado et al. (2012) (UVES/VLT), Machado et al. (2014, 2017) (ESPaDOnS/CFHT) and Gonçalves et al. (2020) (HARPS-N/TNG). A detailed description of the method can be found in Machado et al. (2014, 2017).
The method uses visible Fraunhofer lines scattered by Venus’ cloud tops. The Doppler shift measured in solar light scattered on Venus dayside is the result of two instantaneous motions: (1) a motion between the Sun and Venus upper clouds particles, which scatter incoming radiation in all directions including the observer’s (this Doppler velocity is minimal near Venus sub-solar point); (2) a motion between the observer and Venus clouds, resulting from the topocentric velocity of Venus cloud particles in the observer’s frame (this effect is minimal near Venus sub-terrestrial point). The measured Doppler shift is the combined effect of these instantaneous motions.
At half-phase angle (HPA), these two effects cancel out for the zonal component of the wind field, as the relative velocities of particles toward the source of incoming radiation and towards the observer cancel each other out. Along all points lying along this meridian we assume that the retrieved Doppler velocities cannot be attributed to a zonal component, thus, a non-zonal wind regime, such as meridional wind flow, should explain the Doppler shifts observed along the HPA meridian. The high precision of this method in the retrieval of meridional wind as shown to be of the same order of meridional winds from space observations (Gonçalves et al., 2020).
These new results provide new insights on (1) daily and spatial variability of zonal wind, (2) meridional wind profile and variability constrain, (3) long term analysis of zonal wind, (4) consistency of Doppler velocimetry method.
Aknowledges:
We acknowledge support from the Portuguese Fundação Para a Ciência e a Tecnologia (ref. PD/BD/ 128019/2016 and ref. PTDC/FIS-AST/29942/2017) through national funds and by FEDER through COMPETE 2020 (ref. POCI-01-0145 FEDER-007672).
References:
- Gonçalves R., Machado P., Widemann T., Peralta J., Watanabe S., Yamazaki A. et al., Venus’ cloud top wind study: Coordinated Akatsuki/UVI with cloud tracking and TNG/HARPS-N with Doppler velocimetry observations. Icarus, Volume 335, https://doi.org/10.1016/j.icarus.2019.113418, 1 January 2020.
- Machado P., Luz D., Widemann T., Lellouch E., Witasse O., Characterizing the atmospheric dynamics of Venus from ground-based Doppler velocimetry. Icarus, vol. 221, p. 248-261, 2012.
- Machado P., Widemann T., Luz D., Peralta J., Wind circulation regimes at Venus’ cloud tops: Ground-based Doppler velocimetry using CFHT/ESPaDOnS and comparison with simultaneous cloud tracking measurements using VEx/VIRTIS in February 2011. Icarus, vol. 243, p. 249-263, 2014.
- Machado P., Widemann T., Peralta J., Gonçalves R., Donati J., Luz D., Venus cloud-tracked and Doppler velocimetry winds from CFHT/ESPaDOnS and Venus Express/VIRTIS in April 2014. Icarus, vol. 285, p. 8-26, 2017.
- Widemann T., Lellouch E., Donati J.F., Venus Doppler winds at cloud tops observed with ESPaDOnS at CFHT. Planetary and Space Science, vol. 56, p. 1320-1334, 2008.
How to cite: Gonçalves, R., Machado, P., and Widemann, T.: Venus' cloud top wind study: new Doppler velocimetry measurements, Europlanet Science Congress 2020, online, 21 Sep–9 Oct 2020, EPSC2020-307, https://doi.org/10.5194/epsc2020-307, 2020.
Abstract
Structure of the planetary scale wave, which has been studied for over decades since its discovery in 1980s, is yet to be shrouded in mystery. To clarify this, images by cameras would definitely be necessary. Our team has been assimilating data with AFES LETKF Data Assimilation System for Venus (ALEDAS-V): the first data assimilation system for the Venusian atmosphere, as a pre-experiment before executing the mission. Results show that you can successfully reproduce 4-day planetary scale wave when assimilating data of wind velocity of latitude S15°- N15° every 6 hours at an altitude of 70 km. This discovery will contribute not only to a mission to observe wind velocity of Venus, but also to proposal regarding missions for further understanding of atmospheric structure on other planets, in the future.
The planetary scale wave, which is considered as 4-day “equatorial Kelvin wave” is existing at the cloud top in the equatorial region on the Venus atmosphere [1,2]. The equatorial Kelvin wave is pointed out to have a possibility of contributing to generation and maintenance of what is called “Super Rotation”: the wind circulating Venus 60 times faster than the speed of Venusian rotation [3]. However, the equatorial Kelvin wave has not been simulated in any Venusian atmospheric General Circulation Model (VGCM) in the world. We have so far developed AFES-Venus; Atmospheric GCM for the Earth Simulator for Venus, and ALEDAS-V; AFES LETKF Data Assimilation System for Venus, using LETKF; Local Ensemble Transform Kalman Filter, for the first time in the world [4,5]. In this study, we made an observation data regarding the speed of wind, by varying conditions such as altitude, latitudinal range, and frequency of observations, assuming observations with various wavelength cameras. We created the idealized observation data from CCSR/NIES Venus AGCM [6], in which the equatorial Kelvin wave is reproduced at ~70 km by 5.5-day wave forcing from the lowest level (~30 km).
AFES-Venus solves dry 3-D Primitive equation on sphere. The physical parameters are based on Venus. The latitude-longitude grids (128 times 64) with 60 vertical layers are used. Solar heating is based on Tomasko (1980) and Crisp (1989), and radiative process is simplified by Newtonian cooling. The simulation starts from zonal wind assuming super rotation and spin up for 4 Earth years. ALEDAS-V uses the LETKF [7] to produce an improved estimate (called analysis) by combining observations and short time ensemble forecasts of AFES-Venus. The number of ensemble members is 31. Assimilation cycle is 6 hourly interval. Observation period and error are set to 1 month and 3 m/s, respectively. We first assimilated the wave observation at several altitudes and different frequency, however, the 4-day wave was not perfectly reproduced. Therefore, we conducted sensitivity experiments of observational domain at an altitude of 70 km, where the wave was mostly reproduced. In this experiment, observation with ultraviolet wavelength camera on Akatsuki for example, is assumed to be used for observations.
We have been conducting various cases of experiments, though, we will show the results partially here.
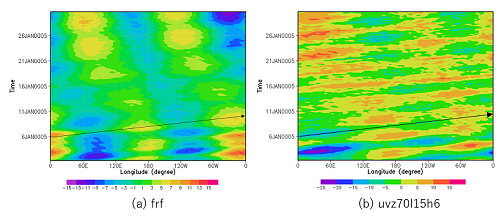
Figure 1: Longitude-time cross sections of wind at the equator at 70 km (deviations from time averages)
(a): free-run-forecast, where data is not assimilated
(b): horizontal winds data assimilated in latitudes of S15°- N15°, every 6 hours at 70 km
Figure.1 shows Longitude-time cross section of deviation of zonal wind from its time average at the equator at altitude of 70 km. Black arrows refers 4-day waves, and it is approximately 4-days from bottom-left to upper-right of the arrow. In spite of the vague expression in (a), 4-day wave is apparent in (b). The 4-day wave was reproduced by data assimilation.
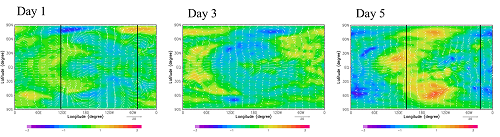
Figure 2: Time variations of temperature (color) and horizontal winds (vector) at 70 km.
Horizontal winds data is assimilated in latitudes of S15°- N15°, every 6 hours at 70 km.
Figure. 2 is time variations of temperature and horizontal winds at an altitude of 70 km. In this figure, high-pass filter with 10-day running mean subtracted is drawn. The black lines in the images characterize borders between contrasting vectors. The locations of two lines in Day 1 and Day 5 are almost the same, respectively. Therefore, it is explicit that 4-day wave is successfully reproduced.
Our team also conducted several other experiments and analyzed their results. By drawing latitude-longitude cross section of averaged zonal wind and temperature, we found that the velocity of wind at 65 km – 70 km at S45°- N45° is contrasting by assimilating different latitudenal range data. In another experiment, where we drew time-altitude cross section of wind at the equator, we confirmed that 4-day wave was apparent only when assimilating data. Finally, we investigated latitudinal dependency and observation frequential dependency with root-mean-square-deviation. From these, we learned that there is a strong jet in mid-latitude and also reinforced our hypothesis of the best observation latitude.
We sought the reproduction of 4-day wave in Venus atmosphere by assimilating data of an idealized observation with ALEDAS-V. And we discovered that under the following conditions, we can expect to reproduce 4-day wave successfully, using ultraviolet wavelength cameras. First, the altitude of assimilating data would be better to set at 70 km. Also, the most potential frequency for data assimilation would be once in 6 hours, with latitude between S15°- N15°. Our research has an important roll as pre-investigation before executing an actual mission, thus we will carry on a further research to contribute solving the enigma of Venus.
Acknowledgements
This study was conducted under the joint research project of the Earth Simulator Center and supported by the Japan Science and Technology Agency.
References
[1] A.D. Del Genio and W.B. Rossow, Icarus, 1982
[2] A.D. Del Genio and W.B. Rossow, J. Atmos. Sci., 1990
[3] M. Yamamoto et al., J. Atmos. Sci., 1997
[4] H. Ando et al., Nature Communications, 2016
[5] N. Sugimoto et al., Scientific Reports, 2017
[6] M. Yamamoto et al., Icarus, 2012
[7] T. Miyoshi and S. Yamane, Mon. Wea. Rev., 2007
How to cite: Shirasaka, M., Sugimoto, N., Fujisawa, Y., Hosono, A., Abe, M., Ando, H., Takagi, M., and Yamamoto, M.: Horizontal winds assimilation to reproduce equatorial Kelvin wave in the Venus atmosphere, Europlanet Science Congress 2020, online, 21 Sep–9 Oct 2020, EPSC2020-33, https://doi.org/10.5194/epsc2020-33, 2020.
The main Venus clouds, covering the entire planet between approx. 50 and 70 km altitude, are believed to consist mostly of liquid sulfuric acid. Below the clouds, the temperature is high enough to evaporate those droplets into gaseous sulfuric acid forming a haze layer which extends to altitudes as deep as 35 km. H2SO4(g) is the main absorber of radio waves as was observed in Mariner, Pioneer Venus, Magellan and Venera radio occultation measurements. Radio wave absorption measurements can be used to derive the amount of H2SO4 as well as to estimate upper limits of SO2 in Venus’ atmosphere. The radio science experiment VeRa onboard Venus Express probed the atmosphere of Venus between 2006 and 2014 with radio signals at 13 cm (S-band) and 3.6 cm (X-band) wavelengths. Thanks to the orbit of VEX, a wide range of latitudes and local times was covered so that a global picture of the H2SO4(g) ditribution was obtained. We present H2SO4(g) profiles as well as upper limits of sulfur dioxide near the cloud base derived from the X-band radio signal from the entire Venus Express mission. More than 600 H2SO4(g) profiles show the global sulfuric acid vapor distribution covering the northern and southern hemisphere on the day- and night side of the planet. A distinct latitudinal H2SO4(g) and SO2 variation and a southern northern symmetry are clearly visible. Observations over 8 years allow to study also long-term variations. Indications for temporal H2SO4(g) and SO2 variations are found, at least at northern polar latitudes. The results shall be compared with observations retrieved by other experiments onboard Venus Express. Additionally, the observed H2SO4(g) distribution will be compared with results obtained from a mass transport model.
How to cite: Oschlisniok, J., Häusler, B., Pätzold, M., Tellmann, S., and Bird, M.: Sulfuric acid vapor and sulfur dioxide in the atmosphere of Venus as observed by VeRa, Europlanet Science Congress 2020, online, 21 Sep–9 Oct 2020, EPSC2020-139, https://doi.org/10.5194/epsc2020-139, 2020.
Abstract
Feasibility of radio occultation measurement (RO) among small satellites is investigated by observing system simulation experiment (OSSE) of the Venus data assimilation system in two test cases introducing real orbits. One observes cold collar in polar region. The other observes thermal tides in equatorial region. The reproducibility of the cold collar or thermal tides is investigated by several types of orbits. Results suggests that the cold collar is successfully reproduced with two or three satellites. In addition, zonal wind can be improved by temperature assimilation of the thermal tides with two satellites. Therefore, RO among small satellites would be promising to reproduce global phenomena in the Venus atmosphere.
1. Introduction
Venus atmosphere has a global, thick cloud cover at about 48–70 km altitude. Therefore, it is very difficult to observe under the cloud by the images. One of the most useful methods to obtain vertical temperature profiles is RO. For Earth, daily observations have been performed by GNSS (Global Navigation Satellite System). However, Venus has been observed only between one satellite, e.g., Venus Express or Akatsuki [1], and Earth. For multiple satellites, by transmitting and receiving radio waves between them, more observations, multiple points and better time resolution, could be obtained. In the previous study, we have shown that RO among small satellites can reproduce the cold collar with fixed observational points [2]. In order to check feasibility, however, we have to consider realistic orbits of flying multiple satellites around Venus.
So far, we have developed Venus atmospheric general circulation model (AGCM) named AFES-Venus (AGCM for the Earth Simulator for Venus) [3]. Recently, using the local ensemble transform Kalman filter (LETKF) [4], we have succeeded in developing the AFES LETKF data assimilation system for Venus (ALEDAS-V) [5]. In this study, we performed OSSE assuming RO among small satellites in two test cases with real orbits targeting the cold collar and thermal tides.
2. Experimental setting
AFES-Venus solves dry 3-D Primitive equation on sphere. The physical parameters are based on Venus. The latitude-longitude grids (128 times 64) with 60 vertical layers are used. The simulation starts from idealized super rotation and spin up for 4 Earth years. Reproduced zonal wind is in good agreement with observations [6]. ALEDAS-V uses the LETKF [4] to produce an improved estimate (called analysis) by combining observations and short time ensemble forecasts of AFES-Venus. The number of ensemble members is 31. Assimilation cycle is 6 hourly interval. Observational errors and inflation are set to 3.0 K and 10%, respectively. Details are described in [2, 5].
Two experiments are conducted; one is evaluated by the cold collar (experiment 1), and the other is evaluated by the thermal tides (experiment 2). Idealized temperature observations at 40-90 km are prepared by the GCMs assuming RO among small satellites. Experiment 1 uses data from IPSL VGCM because the cold collar is more realistically reproduced [7]. Note that temperature bias between IPSL VGCM and AFES-Venus is corrected. Experiment 2 uses data from AFES-Venus itself but experimental settings are different. Observation points are based on real orbits; Experiment 1 covers polar region and experiment 2 does equatorial region. They are assimilated to AFES-Venus by ALEDAS-V and results are compared with frf (free run forecast). The reproducibility of the cold collar or thermal tides is investigated by several orbits.
3. Results
Figure 1 shows the temperature distributions at 30-90°N at ~66 km in experiment 1. Four situations are considered: (a) frf and (b,c,d) has different orbits. p1, p2 and p3 indicate each pair of satellites. Cold collar is most clearly reproduced for (d) in which all 3 satellites proceed RO.

Figure 1: Temperature distributions at ~66 km (at 30-90°N seen from the north pole): (a) frf, (b) 1 pair of satellites (p1), (c) 2 pairs (p1 and p3), and (d) 3 pairs (p1, p2 and p3).
Figure 2 shows latitude-height cross sections of zonal wind (contour) and difference of zonal wind between frf and the Qt8 cases (color) in which the solar heating is reduced to 80% compared with that used in frf. The 4 types of orbits are considered. The zonal wind above the cloud top (~80 km) is significantly decelerated in (d). It is suggested that temperature observations of the thermal tides can improve zonal wind.
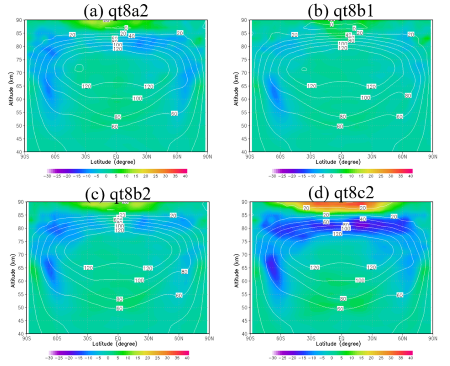
Figure 2: Latitude-height cross sections of zonal wind (contour) and difference of zonal wind between frf and the Qt8 cases (color). 4 types of orbits are shown: a2 (a), b1 (b), b2 (c), and c2 (d). c2 has most observations, following b2, b1 and a2.
Summary and Conclusions
In the present study, we have checked feasibility of the Venus future mission of RO among small satellites by introducing real orbits. In experiment 1, the cold collar is reproduced with 2 or 3 satellites observing polar region. In experiment 2, zonal wind is improved by the temperature observations of the thermal tides in equatorial region. Results suggest that RO with two or three small satellites would be promising to reproduce global phenomena. Furthermore, it is also suggested that this kind of observing system simulation experiment would be very useful to design future missions.
Acknowledgements
This study and supported by the Japan Science and Technology Agency (JST).
References
[1] Ando, H. et al.: Thermal structure of Venus atmosphere from sub-cloud region to the mesosphere observed by radio occultation, Scientific Rep., 2020.
[2] Sugimoto, N. et al.: Observing system simulation experiment for radio occultation measurements of the Venus atmosphere among small satellites, Journal of JSCE A2: Applied Mechanics, 2019.
[3] Sugimoto, N. et al.: Baroclinic instability in the Venus atmosphere simulated by GCM, J. Geophys. Res., Planets, 2014.
[4] Miyoshi, T. and S. Yamane: Local ensemble transform Kalman filtering with an AGCM at a T159/L48 resolution. Mon. Wea. Rev. 135, 2007.
[5] Sugimoto, N. et al.: Development of an ensemble Kalman filter data assimilation system for the Venusian atmosphere, Scientific Rep., 2017.
[6] Sugimoto, N. et al.: Waves in a Venus general circulation model, Geophys. Res. Lett., 2014.
[7] Garate-Lopez, I and S. Lebonnois: Latitudinal variation of clouds’ structure responsible for Venus’ cold collar, Icarus, 2018.
How to cite: Hosono, A., Fujisawa, Y., Sugimoto, N., Abe, M., Kikuchi, Y., Yamamoto, T., Kawabata, Y., Ikari, S., Ando, H., Takagi, M., Garate Lopez, I., Lebonnois, S., and Ao, C.: Observing system simulation experiment for radio occultation among small satellites introducing real orbits of the Venus atmosphere, Europlanet Science Congress 2020, online, 21 Sep–9 Oct 2020, EPSC2020-34, https://doi.org/10.5194/epsc2020-34, 2020.
Instrument description
The VenSpec-U instrument is a dual channel UV spectral imager (low and high spectral resolution channels, “LR” and “HR” hereafter), part of the VenSpec spectrometer suite on board the proposed Venus orbiter EnVision. Each channel consists of an entrance baffle, an objective composed of two lenses and a stop diaphragm, and a spectrometer composed of a slit and a toroidal holographic grating. It also includes s shortpass filter to reject the wavelengths above the higher limit of both channel bands and a zero-order trap to avoid straylight due to internal reflexions of the grating zero-order. The optical layout is presented in Figure 1. Both LR and HR slits are parallel and the optical layout is such that both channels have the same instantaneous field of view (FoV), allowing simultaneous observations and calibrations. Each slit image is then spectrally dispersed by its respective toroidal holographic grating and is formed on a shared CMOS back-side illuminated detector.
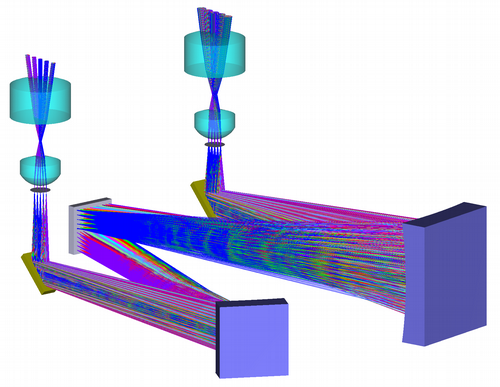 |
Figure 1: VenSpec-U optical layout overview, with the HR and LR channels respectively on the left and on the right. |
The narrow-slit axis of the detector contains the spectral information, whereas the long-slit axis contains the spatial information along the 22.5° FoV of each slit. The spectra of LR and HR channels are dispersed one above the other on the focal plane. The remaining spatial direction is provided through orbital scrolling (“pushbroom” strategy). Binning on the spatial axis is performed on the detector. The detector will be controlled such that the integration time and the binning scheme is adjusted independently (and simultaneously) for each channel giving high flexibility and providing parameters for the optimisation of each acquisition.
Instrument Performance
According to our forward model based on HST-STIS [Jessup et al., 2015] and SPICAV-UV heritage [Marcq et al., 2020], this shall be sufficient to measure the targeted species (SO, SO2, UV absorber) with a relative accuracy better than 25%. These measurements shall allow to characterize variability of Venus cloud top on temporal scales ranging from hours to years and spatial scales ranging from a few kilometers to planetary scale in relation to the climate and/or present day volcanic activity of Venus.
Bibliography
- K. L. Jessup et al., Coordinated Hubble Space Telescope and Venus Express Observations of Venus’ upper cloud deck, Icarus 258, 2015
- E. Marcq et al., Climatology of SO2 and UV absorber at Venus’ cloud top from SPICAV-UV nadir dataset, Icarus 335, 2020
How to cite: Marcq, E., Guignan, G., Lustrement, B., Montmessin, F., Lasue, J., Bézard, B., Vandaele, A. C., Helbert, J., Widemann, T., Wilson, C., and Ghail, R.: Monitoring Venus cloud top: the VenSpec-U spectrometer on board ESA EnVision, Europlanet Science Congress 2020, online, 21 Sep–9 Oct 2020, EPSC2020-622, https://doi.org/10.5194/epsc2020-622, 2020.
Please decide on your access
Please use the buttons below to download the presentation materials or to visit the external website where the presentation is linked. Regarding the external link, please note that Copernicus Meetings cannot accept any liability for the content and the website you will visit.
Forward to presentation link
You are going to open an external link to the presentation as indicated by the authors. Copernicus Meetings cannot accept any liability for the content and the website you will visit.
We are sorry, but presentations are only available for users who registered for the conference. Thank you.