Oral presentations and abstracts
This session welcomes presentations on all aspect of the Venus system including interior, surface, atmosphere and ionosphere. We welcome presentations based on past or current observations, theory and modelling, as well as presentations related to future instruments and missions including the ESA-NASA proposed EnVision Venus orbiter and NASA Discovery Venus missions.
Session assets
How the super-rotation of the Venusian atmosphere is maintained is an outstanding question of the Venus science and geophysical fluid dynamics. We tackled it by using data from Akatsuki. Prior to that, we revisited the meridional circulation by using past observational data: downward solar flux from entry probe and satellite-based radiation observation. With a very simple assumption, we obtained a meridional circulation consistent with the earlier studies based on radiative transfer computation. The result allowed us to order-estimate the eddy angular-momentum forcing needed to maintain the present super-rotation. We derived the eddy forcing by using cloud-tracking winds and thermal infrared data from Akatsuki. In particular, we focused on the pivotal question on the maintenance of the presentation, which is how the angular momentum (per unit mass) is supplied at its peak around the equatorial cloud top to compensate the deceleration by the meridional circulation. It was revealed that the thermal tides provide it, acting to accelerate the super-rotation, through both the horizontal and the vertical angular-momentum transport. Other waves and large-scale horizontal turbulence are found to counteract it to a weaker degree, in contrast to the earlier expectation from the classical Gierasch-Rossow-Williams mechanism. This study provided a number of by-products, such as the detection of turbulent motion and spectra of wind disturbances.
This study was published recently as Horinouchi et al. 2020, Science, 368 (6489), 405-409 and its online supplementary material.
How to cite: Horinouchi, T., Hayashi, Y.-Y., Watanabe, S., Yamada, M., Yamazaki, A., Kouyama, T., Taguchi, M., Fukuhara, T., Takagi, M., Ogohara, K., Murakami, S., Peralta, J., Limaye, S. S., Imamura, T., Nakamura, M., Sato, T. M., and Satoh, T.: How waves and turbulence maintain the super-rotation of Venus' atmosphere – results from Akatsuki, Europlanet Science Congress 2020, online, 21 Sep–9 Oct 2020, EPSC2020-303, https://doi.org/10.5194/epsc2020-303, 2020.
- An atmospheric internal gravity wave is an oscillatory disturbance on an atmospheric layer in which the buoyancy of the displaced air parcels acts as the restoring force. As such, it can only exist in a continuously stably stratified atmosphere, that is, a fluid in which the static stability is positive and horizontal variations (within the atmospheric layer) in pressure are negligible when compared to the vertical variations (in altitude) [Gilli et al. 2020; Peralta et al. 2008].
- These waves represent an efficient transport mechanism of energy and momentum through the atmosphere which can dissipate at different altitudes, influencing the atmospheric circulation of several layers in the atmosphere. This dissipation or wave breaking can dump the transported momentum and energy to the mean flow, contributing to an acceleration, thus significantly altering the thermal and dynamical regime of the atmosphere [Alexander et al. 2010].
- We present here results on the detection and characterisation of mesoscale waves on the lower clouds of Venus using data from the Visible Infrared Thermal Imaging Spectrometer (VIRTIS-M) onboard the European Venus Express space mission and from the IR2 instrument onboard the Venus Climate Orbiter (Akatsuki) japanese space mission. We used image navigation and processing techniques based on contrast enhancement and geometrical projections to characterise morphological properties of the detected waves such as horizontal wavelength, packet length and width, orientation and relative optical thickness drop between crests and troughs, as further described in [Peralta et al. 2018]. Additionally, phase velocity and trajectory tracking of wave-packets was also performed. We combined these observations to derive other properties of the waves such as vertical wavelength of detected packets. Our observations include 13 months worth of data from August 2007 to October 2008, when the VIRTIS-IR channel became unable to provide data, and all the available data set of IR2 which comprises images from January to November of 2016. Each image was analysed "by eye" and characterisation was manually performed with tools from the same software described in [Peralta et al. 2018].
- We characterised almost 300 wave-packets across more than 5500 images over a broad region of Venus' globe and our results show a wide range of properties and are not only consistent with previous observations [Peralta et al. 2008] but also expand upon them, taking advantage of two instruments that target the same cloud layer of Venus across multiple time periods.
Acknowledgements
This research is supported by the University of Lisbon through the BD2017 program based on the regulation of investigation grants of the University of Lisbon, approved by law 89/2014, the Faculty of Sciences of the University of Lisbon and the Portuguese Foundation for Science and Technology FCT through the project P TUGA PTDC/FIS-AST/29942/2017. We also acknowledge the support of the European Space Agency and the associated funding bodies Centre National d’Etudes Spatiales (France) and Agenzia Spaziale Italiana (Italy) as well as the full team behind the VIRTIS instrument, Venus Express space mission and the PSA archives. Additionally, we acknowledge the support and work of the entire Akatsuki team. The first author also acknowledges the full support of Japan Aerosapce Exploration Agency (JAXA) for enabling a short internship in their facilities which greatly contributed to this work.
References
[1] M.J. Alexander et al. Recent developments in gravity-wave effects in climate models and the global distribution of gravity-wave momentum flux from observations and models. Royal Meteorological Society, 2010.
[2] G. Gilli et al., Impact of gravity waves on the middle atmosphere of mars: a non-orographic gravity wave parameterization based on global climate modeling and MCS observations. Journal of Geophysical Research - Planets, 2020.
[3] J. Peralta et al. Characterization of mesoscale gravity waves in the upper and lower clouds of venus from vex-virtis images. Journal of Geophysical Research, 113, 2008. doi: 10.1029/2008JE003185.
[4] J. Peralta et al. Analytical solution for waves in planets with atmospheric superrotation - I: acoustic and inertia-gravity waves. The Astrophysical journal, supplement series, 517 213:17, 2014. doi: 10.1088/0067-0049/213/1/17.
[5] J. Peralta et al. Nightime winds at the lower clouds of venus with akatsuki/ir2: Longitudinal, local time and decadal variations from comparison with previous measurements. Astrophysical Journal Supplement Series, 2018. URL: arXiv:1810.05418v2.
How to cite: Silva, J., Machado, P., Peralta, J., and Brasil, F.: Characterising atmospheric gravity waves on the lower cloud of Venus - A systematic study, Europlanet Science Congress 2020, online, 21 Sep–9 Oct 2020, EPSC2020-281, https://doi.org/10.5194/epsc2020-281, 2020.
In this work we have produced global maps of Venus nightside atmosphere using the complete infrared dataset of VIRTIS mapping channel onboard Venus Express between 2006 and 2008. Despite the local variability and high dynamics of the clouds, the accumulation of data over several years allowed us to obtain a global mean state of the atmosphere, where we can observe the average structure of the clouds from equator to the polar regions with a high symmetry north/south even for the local time dependencies.
We have first obtained a global view of the nightside cloud opacity in the lower clouds mapping the integrated radiance in the infrared atmospheric windows around 1.74 μm and 2.3 μm (left maps in Figure 1). The radiance measured around these wavelengths originate below the cloud layer and both bands reflect the opacity of the lower cloud layer (44-48 km altitude), with common trends and high symmetry between the north and south hemispheres. Despite the common elements, the bands 1.74 and 2.3μm behave very differently with respect to the particle size, therefore the ratio between them provides an indirect estimation of the particle size distribution for these clouds, which is especially evident near the polar regions and also around the mid-latitude cloud belt (middle maps in Figure 1). We have then produced maps of the brightness temperatures in the thermal region around 3.8 μm and 5.0 μm, which provide a direct indication of the temperatures at the top of the clouds (60–70 km altitude) and the cooling with local time visible in both hemispheres (right maps in Figure 1).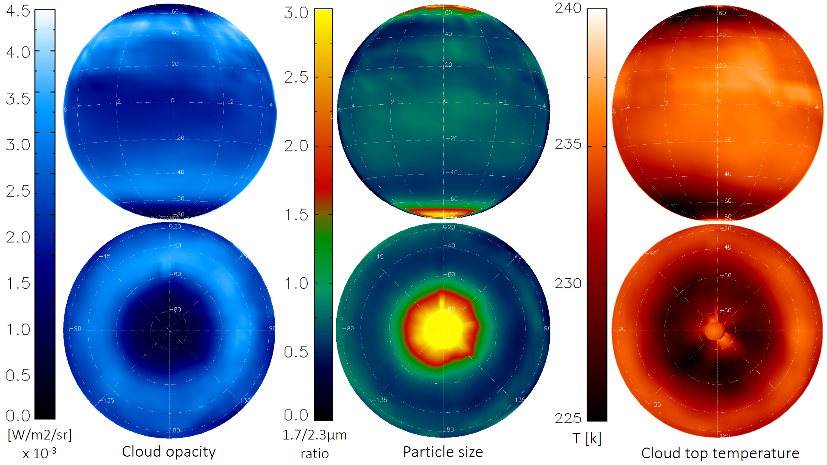
Figure 1: Maps of Venus nightside atmosphere. Top maps represent latitude and local time (evening on the right, midnight in the center, morning on the left). Bottom maps are centered at the south pole and distributed with longitude. Left: Cloud opacity (inverse of the integrated radiance at 1.74μm, high opacity regions in both poles are dark due to the low radiance, mid-latitude clouds have highest radiance and lowest opacity). Middle: Particle size (ratio of the integrated radiance at 1.74 and 2.3μm, bright areas in both poles indicate larger particle sizes, mid-latitude cloud belt has smallest particle sizes). Right: Cloud top temperature (thermal brightness measured at 3.8μm, cold collar evening-morning cooling is visible and symmetric in both hemispheres).
These maps provide a global view of the global atmospheric dynamics at various altitudes, showing the main regions of the planet and the main characteristics in line with the latest general circulation models of Venus. The equatorial region shows a uniform cloud opacity and particle size, with no significant local time variations throughout the night except for the gradual temperature cooling of the cloud tops from evening to morning. The mid-latitude cloud belt extends uniformly over the night with the lowest opacity and lowest particle size distribution for both hemispheres, with an interesting asymmetry as the Northern hemisphere seems to have lower opacity and relative particle sizes. Towards the polar regions, the cold-collar appears with highest opacity and particle sizes, with a clear evening-to-morning cooling that had already been reported separately for the North and South hemispheres, and is now shown simultaneously providing a more global view of the atmospheric symmetry.
Reference publication: "Global maps of Venus nightside mean infrared thermal emissions obtained by VIRTIS on Venus Express". ICARUS, Volume 343, June 2020, 113683, https://doi.org/10.1016/j.icarus.2020.113683
How to cite: Cardesin-Moinelo, A., Piccioni, G., Migliorini, A., Grassi, D., Cottini, V., Titov, D., Politi, R., Nuccilli, F., and Drossart, P.: Venus nightside atmosphere maps: cloud opacity, particle size and cloud top temperature seen by VIRTIS/Venus Express, Europlanet Science Congress 2020, online, 21 Sep–9 Oct 2020, EPSC2020-142, https://doi.org/10.5194/epsc2020-142, 2020.
The spatial and temporal structures of "Enormous Cloud Cover" (ECC), seen in 2.26- and 1.735-µm Venus' night-side images acquired by Akatsuki/IR2, are investigated. The data were acquired on 18th and 27th August 2016 and have been processed newly-developed "Restoration by Deconvolution" (RD) method that effectively removes contaminating light spread from the intense day crescent. Spectral radiances are compared between ECC and "seemingly normal" area (BC = Background Clouds). Attenuation by ECC is stronger at 2.26 µm (~70 to 80 %) than at 1.735 µm (~50 %) due primarily to lower single-scattering albedo of cloud particles at 2.26 µm. Detailed radiative-transfer analyses suggest the followings:
A possible scenario to explain these observational characteristics, strong upwelling region near the western end (front of propagating feature), pushing H2SO4 vapor to condensate in high altitudes. After the region of strongest upwelling propagates away, the cloud particles gradually sediment or are pulled back by downwelling motion of atmosphere.
Details of data analysis, interpretation of phenomena with comarison to numerical simulations will be presented.
How to cite: Satoh, T., Vun, C. W., Horinouchi, T., and Sato, T. M.: Structure of enormous cloud cover seen in Venus' night-side by Akatsuki/IR2, Europlanet Science Congress 2020, online, 21 Sep–9 Oct 2020, EPSC2020-558, https://doi.org/10.5194/epsc2020-558, 2020.
Lightning produces an extremely low frequency (ELF) radio wave that propagates along magnetic field lines to higher altitudes in the ionosphere. Venus lacks an intrinsic magnetic dipole, so the interplanetary magnetic field (IMF) drapes around the planet forming a comet-like tail. The IMF induces currents in the ionosphere that generate an opposing field. The field lines tend to be nearly horizontal to the surface around much of the planet, except in the tail where it is more radial. There must be a dip to the field in order for waves to be guided to higher altitudes on the dayside. Therefore, a wave on the dayside is less likely to enter the ionosphere at the zenith of its source and more likely to enter at angles towards the horizon, where the field lines and wave path are more aligned.
The dual fluxgate magnetometer onboard Venus Express (VEX) was able to detect ELF signals up to 64 Hz at various altitudes throughout the mission. We searched all available data within the ionosphere for lightning-generated whistler-mode waves. These waves are right-handed, circularly-polarized waves and propagate along the magnetic field. With a complete set of whistler observations, we can then calculate the Poynting flux of the waves. The Poynting flux requires the three components of both the wave electric field and magnetic field. Unfortunately, VEX did not have a means of measuring the electric field, but we can infer it if we know the phase velocity of the wave. In order to calculate the phase velocity, we need to employ the Venus International Reference Atmosphere model of electron density since VEX did not have any measurements coincident with whistler observations .
The mission was in orbit from 2006-2014 and in that time there were nearly 7 cumulative hours of whistler observations below 400 km. In some cases, there was continuous activity for over a minute, implying a connection to an electrical storm below. These signals were most frequently seen when the spacecraft was at ~250 km altitude. Most signals were observed within 200-350 km altitude with a rate of ~3% of the time the spacecraft spent at these altitudes. It should be noted that due to the polar orbit of Venus Express, the lowest latitude of a detection was ~50°.
The VEX mission spanned almost one solar cycle, so we can compare observations during the solar minimum and maximum periods. Because the ionosphere becomes strongly magnetized during solar minimum, detection rates are about twice as high compared to solar maximum. The Poynting flux during solar maximum shows a decrease with increasing altitude, providing further evidence that the waves were generated below the ionosphere. This conclusion is less clear during solar minimum. A large sample of case studies are left for future work to highlight features that might be lost to statistical averaging.
Pioneer Venus (PVO) was able to detect the electric component of lightning-generated waves at 100 and 700 Hz, but on the nightside and at lower latitudes in contrast to the North polar orbit of VEX. The improved capability of VEX over PVO has greatly increased our knowledge of Venus lightning. The Indian Space Agency (IRSO) has announced plans for a future Venus orbiter at low latitudes. If a lightning oriented investigation were included, their data would be very complementary to previous studies.
How to cite: Hart, R., Russell, C., Pabari, J., and Zhang, T.: The Strength of Lightning on Venus Inferred from Ionospheric Whistler-Mode Waves, Europlanet Science Congress 2020, online, 21 Sep–9 Oct 2020, EPSC2020-483, https://doi.org/10.5194/epsc2020-483, 2020.
In the absence of global plate tectonics, mantle convection and plume-lithosphere interaction are the main drivers of surface deformation on Venus. Whether Venus is geologically active today remains in question: the apparent young surface age and random distribution of impact craters on the planet, initially ascribed as resulting from a global resurfacing event 500-700 Myr ago1,2,3, can also be explained by equilibrium processes, suggestive of ongoing regional resurfacing4,5. Moreover, recent studies have identified active hotspots6,7,8,9 and young individual lava flows10 on the planet.
Among documented tectonic structures, circular volcano-tectonic features known as coronae are perhaps the clearest surface manifestations of mantle plumes and may hold clues to the global Venusian tectonic regime. Coronae are characteristic quasi-circular volcano-tectonic features that are abundant on the Venusian surface and generally associated with volcanism, topographic relief, and concentric or radial faulted patterns9,11,12 (left panels of Fig. 1). They feature a wide range of sizes and morphology but typically display an annulus of closely spaced concentric fractures and/or ridges superimposed on a raised rim, with a central relief ranging from domes to depressions12. The exact processes underlying their development and the reasons for their diverse morphologies remain controversial.
We conducted a systematic 3D numerical study of plume-lithosphere interaction that links the morphological diversity of large coronae to lithospheric structure and provide guidance for identifying which coronae are currently active. The morphology of at least thirty-seven coronae, dominantly located in a region covering Themis Regio, Lada Terra, and Alpha Regio, is consistent with present-day activity. We thereby provide evidence for widespread plume activity on the planet. The work presented here has just been published in Nature Geoscience13. 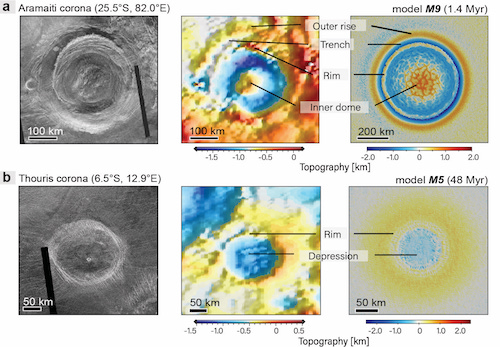
Fig 1. Venusian coronae (left), their topographic signatures (middle) and comparison with numerical models (right)13
3D numerical experiments of coronae formation
We ran 3D high-resolution thermomechanical numerical simulations of impingement of a thermal mantle plume into the Venusian lithosphere to assess the origin and diversity of large Venusian coronae. We systematically varied plume size and temperature, the lithospheric strength and crustal thickness in the models. Our results reveal four regimes of plume-lithosphere interactions underlying corona development at the surface (Figure 2): (1) lithospheric dripping, (2) short-lived subduction, (3) embedded plume, and (4) plume underplating. The ratio of plume buoyancy over lithospheric strength majorly controls these dynamic regimes. This found dependency of plume-lithosphere dynamics on plume buoyancy and lithospheric configuration is key for future studies on plume-lithosphere interactions on Venus or (early) Earth.
During the first three plume-lithosphere interaction scenarios (regimes (1)-(3)), plume penetration and spreading induce crustal thickness variations that eventually lead to a final topographic isostasy-driven topographic inversion that turns circular trenches surrounding elevated interiors into raised rims surrounding inner depressions.
Reasons behind the morphological diversity of coronae
The temporal evolution of the topographic profiles of the modelled coronae show that different corona morphologies represent not only different styles of plume-lithosphere interactions, but also different stages in evolution. Coronae with rims and/or trenches are only produced by mantle plumes that (partially) penetrate into the Venusian lithosphere. The common occurrence of coronae displaying rims on Venus suggests that most plumes that formed coronae were able to penetrate at least partially into the lithosphere. In addition, for coronae formed by a penetrative mantle plume, we are able to distinguish active from inactive structures: active coronae feature an outer trench and rise that imply ongoing suction above downwards-moving lithospheric material, as well as elevated interior supported by plume buoyancy. By contrast, inactive coronae show an inverted topographic profile with an outer rim and an inner depression linked to a thinned lithosphere.
Observational evidence for coronae activity and implications for Venus' geodynamics
We evaluated the possibility of present-day corona activity by systematically analysing the surface topography of large coronae on Venus. Each corona is labelled as currently “active” if it features a clear outer rise and trench, “inactive” if no outer rise but a rim and inner depression is evident, or“unclassified” if the presence of these features is ambiguous. We found expressions of current activity on thirty-seven coronae on Venus (including Artemis Corona, Fig. 1a), whereas thirty-five other coronae were marked “inactive” (including Thouris Corona, Fig. 1b). The remaining coronae are marked “inconclusive”, either because their topography was not well resolved by the dataset, presented ambiguous features, or was markedly different from that obtained in our models. 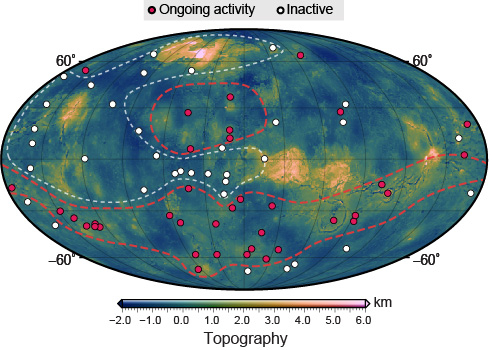
Fig 2. Global distribution of coronae identified as inactive (white circles) or showing ongoing plume activity (red circles)13
Our study presents new evidence for recent tectonic and magmatic activity in the lithosphere Venus, complementing other indications of such activity6,8,10,15,16. Coronae activity spanning a variety of surface ages implies a gradual resurfacing behavior of Venus, akin to Earth-like volcanic and interior processes4,5. Moreover, the global arrangement of active coronae (Fig. 2) suggests a large-scale organization of tectono-magmatic activity on the planet, with a broad active region covering Themis Regio, Lada terra, and Alpha Regio, as well as Eistla Regio, in contrast to regions where large active coronae are absent (around Beta and Phoebe Regiones). Finally, our suggested regions of extensive recent corona activity may serve as interesting targets for detailed investigation by future spacecraft missions.
References
1. Turcotte, D.L. (1993) J. Geophys. Res. 98, 17061-17068
2. Strom, R.G. et al. (1994) J. Geophys. Res. 99, 10899-10926
3. Romeo, L. (2013) Planetary and Space Science 87, 157-172
4. Herrick, R.R., & Rumpf, M. E. (2011) J. Geophys. Res. 116, E2
5. Bjonnes, E.E. et al. (2012) Icarus 217, 451-461
6. Smrekar, S.E. et al. (2010) Science 30, 605-608
7. Phillips, R.J. et al. (1991) Science 252, 651-658
8. Stofan, E.R. et al. (1995) J. Geophys. Res. 100, 23317-23327
9. Stofan, E.R. et al. (1992) J. Geophys. Res. 97, 13347-13378
10. Filiberto J. et al. (2020) Science Adv. 6, eaax7445
11. Stofan, E.R. et al. (1991) J. Geophys. Res. 96, 20933-20946
12. Roberts, K. and Head, J. W. (1993) Geophys. Res. Let. 20, 1111-1114
13. Gülcher, A.J.P. et al. (2020) Nat. Geosci., https://doi.org/10.1038/s41561-020-0606-1
14. Gerya, T.V. (2014) Earth Planet. Sci. Lett. 391, 183-192
15. Sandwell, D.T., & Schubert, G. (1992) Science 5071, 766-770
16. Zampa, L.S. et al. (2018) Planetary and Space Science 157, 48-62
How to cite: Gülcher, A., Gerya, T., Montési, L., and Munch, J.: Widespread ongoing plume activity on Venus revealed by variations in the morphology of large coronae, Europlanet Science Congress 2020, online, 21 Sep–9 Oct 2020, EPSC2020-52, https://doi.org/10.5194/epsc2020-52, 2020.
Venus today presents no large-scale network of subduction and accretion ridges, which is the signature of plate tectonics on Earth. On the other hand, Venus relatively young surface points towards either a quite recent catastrophic renewal of the whole planet surface (« episodic subduction regime »), or the continuous renewal of small areas of the planet for exemple by volcanism.
Unique to Venus, coronae are circular features from 50 to 2600 km in diameter. The largest ones have been attributed to mantle plumes. Close inspection of Magellan’s data revealed that subduction features are also encountered on part of their rim (McKenzie et al, 1992 ; Sandwell and Schubert, 1992, 1995). Recent modeling has shown that plumes could indeed induce roll-back subduction around segments of an expanding coronae. Artemis coronae is the largest coronae on Venus and shows both plume and subduction features that are well explained by the plume-induced subduction mechanism (Davaille et al, 2017). Scaling laws then predict a slab roll-back (and therefore a coronae expansion) velocity between 1 and 10 cm/yr. If the coronae has been expanding, then we should expect the existence of an accreting ridge system inside the coronae, equivalent to the Earth’s mid-ocean ridges developing in back-arc basins. Artemis interior indeed also presents a prominent ridge system (Sandwell and Schubert, 1992 ; Brown and Grimm, 1996 ; Spencer, 2001 ; Hansen, 2002), but its lateral tortuosity is much more prononced than on Earth (fig.1).
Using laboratory experiments, we recently showed that the shape of an accretion ridge is governed primarily by the axial failure parameter ΠF, which depends on the spreading velocity, the mechanical strength of the lithospheric material and the axial elastic lithosphere thickness (Sibrant et al, 2018). Experiments with the largest ΠF presented quite unstable ridge axis with a large lateral sinuosity, long transform faults, and the formation of numerous microplates. These microplates rotate along the transforms before getting incorporated in the main plate on one side of the ridge axis or the other. There, they appear as blocks whose main fabric is either concentric or rotated compared to the main plate’s.
On a planet, this regime occurs for high spreading velocity and/or low axial elastic thickness. For the Earth, it would require spreading velocities greater than 30 cm/yr. But on Venus, where the surface temperature is about 500°C higher, and therefore the elastic thickness on the ridge axis is smaller than on Earth, spreading velocities between 1 and 10 cm/yr would suffice. The scaling laws derived from the laboratory experiments further predict a tortuosity of the ridge axis comparable to what is observed inside Artemis coronae (fig.1). Furthermore, guided by the experiments, we are tempted to identify two long transform faults on each side of Britomartis, as well as a number of rotated blocks or microplates. However, the resolution of Magellan data is not sufficient to be sure of our interpretation. There is an urgent need for better resolution and better coverage of Venus topography, that a mission such as VERITAS could provide.
How to cite: Davaille, A. and Smrekar, S.: Ridge Dynamics in the expanding Artemis Coronae: axis sinuosity, transform faults, and microplates., Europlanet Science Congress 2020, online, 21 Sep–9 Oct 2020, EPSC2020-386, https://doi.org/10.5194/epsc2020-386, 2020.
Understanding the divergent evolution of Venus and Earth is a fundamental problem in planetary science. Although Venus today has a hot, dry atmosphere, recent modeling suggests that Venus may have had a clement surface with liquid water until less than 1 billion years ago [1]. Venus today has a nearly stagnant lithosphere. However, Ishtar Terra’s folded mountain belts, 8-11 km high, morphologically resemble Tibet and the Himalaya mountains on Earth and apparently require several thousand kilometers of surface motion at some time in Venus’s past. Loss of liquid surface water increases the coefficient of friction in fault zones, favoring a transition from an early mobile lithosphere to a present-day stagnant lithosphere [2]. Solar-driven climate evolution could contribute to a prolonged epoch of water loss on Venus and may be the ultimate cause of the divergent evolution of both the climate history and the interior dynamics of Venus and Earth.
In addition to being a problem of first-order importance for Solar System evolution, understanding the divergent evolution of Venus and Earth is also important for understanding the temporal and spatial distribution of habitable environments in the Solar System. Understanding the evolution of Venus is also a key test for models that interpret Earth-sized exoplanets. Testing evolutionary hypotheses requires interpreting clues that were left behind in both the isotopic composition of the Venus atmosphere and in the rock record of the Venus surface. Although several mission concepts are currently competing for possible flights to Venus, only the Deep Atmosphere Venus Investigation of Noble gases, Chemistry, and Imaging Plus (DAVINCI+) mission [3] can examine both the atmospheric isotopic record and the rock record of Venus. DAVINCI+ is therefore a compelling choice for selection in the current NASA Discovery Program Phase A competition.
DAVINCI+ includes an atmospheric entry probe and a carrier spacecraft (Figure 1). The probe measures atmospheric composition using a mass spectrometer and tunable laser spectrometer, performs descent imaging, and measures atmospheric structure. Following completion of the probe mission, the carrier spacecraft enters Venus orbit and images the Venus surface in the 1 micron atmospheric window. This payload is ideally suited for testing models of Venus evolution.

Figure 1: The DAVINCI+ entry probe studies the atmosphere while imaging the Alpha Regio landing site. Afterward, the carrier probe performs infrared imaging of selected targets from orbit.
The History of Water: Isotopic Record
Pioneer Venus measured the D/H value of an H2SO4 cloud droplet at ~55 km as 157±30 times the terrestrial value, which was interpreted as the signature of escape of water from the Venus atmosphere [4]. Terrestrial spectroscopy produced a similar range, whereas Venus Express measured a value up to three times larger between 70-90 km [5]. The large value relative to Earth shows that Venus lost a substantial amount of water, but the large uncertainty and the lack of data below the clouds makes it difficult to quantitatively model the history of water loss [6]. DAVINCI+ will measure D/H to high precision from above the clouds down to the surface, greatly improving our ability to interpret the history of water loss on Venus. In addition, the abundance and isotopic ratios of Xe and Kr, together with the Kr/Ar and Xe/Ar ratios, which DAVINCI+ will measure with high precision, will be instrumental in revealing whether Venus and Earth formed in the same way and how their climates diverged.
The History of Water: Rock Record
A key but poorly answered question is the extent to which Venus has produced granitic or felsic (SiO2-rich) volcanism. Small amounts of felsic magma can be generated by lithospheric processes [7], but large amounts of felsic material requires the presence of water in the melting zone [8], as in terrestrial subduction zones. Tessera, which are regions of old, thick, highly tectonized crust, are widely accepted as the most likely location for felsic material on Venus. Venus Express observations suggest that tessera in Alpha Regio has a felsic composition [9].
DAVINCI+ will explore the presence and distribution of felsic rock in two ways. Comparison of the reflectivity at 1 micron and in panchromatic descent images at the Alpha Regio landing site will test the presence of felsic rock at patch sizes much smaller than can be observed from orbit. Descent imaging will also explore the landing zone geomorphology, and stereo topography will enable quantitative modelling of faulting and folding. Orbital imaging in the 1 micron atmospheric window will test for the presence of felsic rock in other tessera, including Tellus Regio, Fortuna Tessera, Maxwell Montes, Ovda Regio, and Thetis Regio. Our approach is similar to VIRTIS on Venus Express [9] but focuses on regions in the northern hemisphere and near the equator that were not imaged by VIRTIS.
The History of Volcanism: Isotopic Record
Volcanic outgassing releases radioactive decay products such as 40Ar and 4He to the atmosphere. DAVINCI+ measurements of their atmospheric abundance can be used to estimate volcanic outgassing over time. 40Ar provides an integrated record of volcanism over Venus history. Because 4He escapes from the atmosphere to space, its atmospheric abundance constrains geologically recent (last billion years) volcanism. Existing measurements of 40Ar and 4He are too imprecise to strongly constrain the volcanic history of Venus [10] but will be measured with much greater accuracy by DAVINCI+. Because DAVINCI+ will constrain the history of both water and volcanism on Venus, it will provide new insights into the feedbacks that shaped the divergent evolution of Venus and Earth.
References
[1] Way and Del Genio, JGR 125, e2019JE006276, 2020. [2] Weller and Kiefer, JGR 125, e2019JE005960, 2020. [3] Garvin et al., LPSC 51, abstract 2599, 2020. [4] Donahue et al., Science 216, 630-633, 1982. [5] Bertaux et al., Nature 450, 646-649, 2007. [6] Donahue et al., Venus II, 385-414, 1997. [7] Elkins-Tanton et al., JGR 112, E04S06, 2007. [8] Campbell and Taylor, GRL 10, 1061-1064, 1983. [9] Gilmore et al., Icarus 254, 350-361, 2015. [10] Namiki and Solomon, JGR 103, 3655-3677, 1998.
How to cite: Kiefer, W. S., Garvin, J., Arney, G., Atreya, S., Campbell, B., Cottini, V., Filiberto, J., Getty, S., Gilmore, M., Grinspoon, D., Izenberg, N., Johnson, N., Lorenz, R., Malespin, C., Ravine, M., Webster, C., and Zahnle, K.: Venus, Earth's divergent twin?: Testing evolutionary models for Venus with the DAVINCI+ mission, Europlanet Science Congress 2020, online, 21 Sep–9 Oct 2020, EPSC2020-534, https://doi.org/10.5194/epsc2020-534, 2020.
VERITAS is a proposed Discovery mission concept, currently in Step 2 (Phase A), and would launch in 2026. VERITAS addresses one of the most fundamental questions in rocky planetary evolution: why did twin planets follow different evolutionary paths? Venus’ hot lithosphere may be a good analog for early Earth, and could be responsible for the apparent lack of plate tectonics. Determining the factors that lead to the initiation of plate tectonics would inform our predictions for rocky Earth-sized exoplanets. VERITAS answers key questions about Venus’ geologic evolution and searches for current activity and evidence for past or present water.
Payload: VERITAS carries two instruments and conducts gravity science. The VISAR X-band [Hensley et al., this meeting] measurements include: 1) a global digital elevation model (DEM) with 250 m postings, 5 m height accuracy, 2) Synthetic aperture radar (SAR) imaging at 30 m horizontal resolution globally, 3) SAR imaging at 15 m resolution > 20% of the surface and 4) surface deformation from RPI at 2 mm precision for at least 12 targeted, potentially active areas. VEM [Helbert et al., this meeting] would produce surface coverage of most of the surface in 6 NIR bands located within 5 atmospheric windows and of 8 atmospheric bands for calibration and water vapor measurements. VERITAS would use Ka-band uplink and downlink to create a global gravity field with 3 mgal accuracy / 160 km resolution.
Science: VERITAS looks for the chemical fingerprint of past water in the form of low Fe, high Si rock in the tessera plateaus [Dyar et al. submitted, 2020; Helbert et al., submitted, 2020] and for present day volcanic outgassing of volatiles in the form of near surface water outgassing due to recent or active volcanism.
VERITAS uses a variety of approaches to search for present day activity, including 1) tectonic and volcanic cm-scale surface deformation, 2) chemical weathering, 3) thermal emission from recent or active volcanism, 4) topographic or surface roughness changes, and 5) comparisons to past mission data sets.
VERITAS constrains rocky planet evolution via: 1) examining the origin of tesserae plateaus -possible continent-like features, 2) assessing the history of volcanism, 3) looking for evidence of prior tectonic or impact features buried by volcanism, and 4) determining the origin of tectonic features such as huge arcuate troughs that have been compared to Earth’s subduction zones.
VERITAS gravity data (resolution 160 km, 3x better than avg. Magellan resolution), would enable estimation of elastic thickness (a proxy for thermal gradient) and determination of core size [Mazerico et al. Fall AGU 2019].
Conclusions: VERITAS would create a rich data set of high-resolution topography, imaging, spectroscopy, and gravity. These co-registered data would be on par with those acquired for Mercury, Mars and the Moon that have revolutionized our understanding of these bodies. In addition to answering fundamental science questions, VERITAS’ data would motivate further Venus missions. Active surface deformation would promote a seismic mission. Accurate topography plus surface rock type would optimize targeting of surface or areal missions.
Acknowledgements: A portion of this research was conducted at the Jet Propulsion Laboratory, California Institute of Technology, under contract with NASA. The information presented to about the VERITAS mission concept is pre-decisional and is provided for planning and discussion purposes only.
How to cite: Smrekar, S., Dyar, D., Helbert, J., Hensley, S., Nunes, D., and Whitten, J.: VERITAS (Venus Emissivity, Radio Science, InSAR, Topography And Spectroscopy): A Proposed Discovery Mission , Europlanet Science Congress 2020, online, 21 Sep–9 Oct 2020, EPSC2020-447, https://doi.org/10.5194/epsc2020-447, 2020.
Abstract
Synthetic aperture radars provide the only viable means for obtaining high resolution images of the surface of Venus. The NASA Magellan mission in the early 1990s obtained the best resolution imagery and topography of the surface of Venus and these data are the foundations for many of the scientific advances in Venus science in the last decades. Mixed with these new scientific insights gained with the Magellan data new questions have arisen and old fundamental questions like how did Venus and Earth evolve so differently require a fresh look at the surface of Venus. The Venus Interferometric Synthetic Aperture Radar (VISAR) is part of the proposed VERITAS mission, that would launch in 2026, and is designed to provide that fresh look and generate high resolution imagery and topography of the surface.
VERITAS is one of four candidate NASA Discovery 2019 missions being studied for an eventual NASA selection in the Spring of 2021. VERITAS would carry, VISAR an X-band interferometric radar provided by NASA/JPL with contributions from ASI and DLR. VISAR would operate from an orbit that is between 180 and 255 km in altitude at a look angle of 30˚.
During the roughly 16 orbits per day VISAR would collect data on both ascending and descending passes for 11 orbits and then the spacecraft is turned to Earth to downlink the acquired data. VERITAS plans to operate for 4 Venus sidereal days or cycles (243 days) and by shifting the downlink gaps between imaging cycles global coverage is possible.
VISAR design was motivated by two primary mission objectives, (1) to obtain global imagery of finer resolution than the Magellan radar and (2) to obtain global topographic measurements of comparable spatial resolution and accuracy available at other terrestrial bodies in the solar system. In order to obtain high accuracy uniform quality topographic data we selected single pass radar interferometry like that used by SRTM and Tandem-X to map the Earth [4], to provide the desired topography measurements. VISAR has been designed to achieve 5 m elevation accuracy with a spatial resolution of 250 m making it comparable to or better than terrestrial planet topography data except for the Earth.
VISAR is an X-band (7.9 GHz) vertical polarization single pass radar interferometer with two 3.9×0.6 m antennas separated by an interferometric baseline of 3.1 m as shown in Figure 1. The radar operates with a look angle of 30˚ which is balance between radar losses and minimizing shadow and layover gaps in the topographic data. Operating with a transmit bandwidth of 20 MHz VISAR has a range resolution of 7.5 m and has an azimuth resolution of 2.1 m. Radar imagery of 30 m spatial resolution with approximately 25 looks is acquired globally and magery with 15 m resolution and 7 looks is acquired for about 20% of the planet Radar interferograms with a spatial resolution of 250 m (a 125 m options is being studied) and 1800 looks are generated onboard to reduce data volume. Raw data can be downlinked to support repeat pass radar observations.

Figure 1. VISAR flight configuration and observing geometry are optimized for InSAR DEM acquisition with baseline separation B = 3.1 m.
The expected elevation mapping accuracy of the VISAR instrument is shown in Figure 2 based a comprehensive model to evaluate radar performance [5], [6]. The number of looks represents the number of observations from ascending and descending passes acquired over the 4 cycles. Backscatter contributions to SNR and attenuation losses are factored in the overall performance computation. Phase noise limited elevation accuracy (in blue) is compared to elevation accuracy before and after correcting for residual tilts and biases using radar tie points in overlapping image strips (red and green).
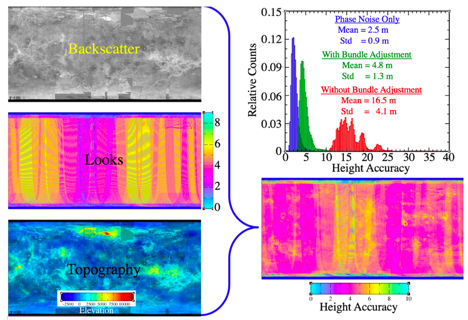
Figure 2. Performance model for VISAR shows that it has an elevation measurement accuracy of 5 m at 250 m spatial resolution.
VISAR would also collect repeat pass radar data for 12-15 targeted 200×200 km sites. Deformation accuracy is limited by atmospheric variations between observations, mostly due to SO2 variations, which at 50 m posting is about 1.5 cm. These data would be the first deformation interferometry at another planet.
VISAR is a proposed radar system that is leveraging advances in radar technology and imaging techniques in interferometry since Magellan to provide greatly improved data products for the study of Venus.
Acknowledgements
A portion of this research was conducted at the Jet Propulsion Laboratory, California Institute of Technology, under contract with National Aeronautics and Space Administration. The information presented about VERITAS is pre-decisional and is provided for planning and discussion purposes only.
References
[1] R. S. Saunders, et al, , Magellan Mission Summary. Journal of Geophysical Research, 97:13,06713,09, 1992.
[2] P. G. Ford and G. H. Pettengill, Venus Topography and Kilometer-Scale Slopes, J. Geophys. Res., 97, E8, 13,103-13,114 (1992).
[3] Leberl, F. W., Thomas, J. K., and Maurice. K. E., Initial Results From The Magellan Stereo Experiment, Journal of Geophysical Research, VOL. 97, NO. E8, pp. 13,675-13,689, August 25, 1992.
[4] Farr, T. G., Paul A. Rosen, Edward Caro, Robert Crippen, Riley Duren, Scott Hensley, Michael Kobrick, Mimi Paller, Ernesto Rodriguez, Ladislav Roth, David Seal, Scott Shaffer, Joanne Shimada, Jeffrey Umland, Marian Werner, Michael Oskin, Douglas Burbank, and Douglas Alsdorf, The Shuttle Radar Topography Mission, Rev. Geophys., 45, RG2004, 2007
[5] S. Hensley, J. Martin, S. Oveisgsharan, X. Duan, and B. A. Campbell, "Radar Performance Modeling for Venus," VEXAG Meeting, Applied Physics Laboratory, 2018.
[6] Scott Hensley, A Combined Methodology for SAR Interferometric and Stereometric Error Modeling, Radar Conference, 2008
How to cite: Hensley, S., Smrekar, S., Perkovic-Martin, D., Campbell, B., and Mastrogiuseppe, M.: VISAR: Taking A Fresh Look at the Surface of Venus, Europlanet Science Congress 2020, online, 21 Sep–9 Oct 2020, EPSC2020-513, https://doi.org/10.5194/epsc2020-513, 2020.
If Venus were a newly discovered exoplanet, it would be one of the most Earth-like yet identified. Its similarity in size, bulk density and cloud top temperatures give no clue to the hellish temperatures at its surface. Venus hosts an array of geological features as complex as Earth, but without its organisation, and sustains a chemically reactive atmosphere, but without life. Proposed in response to ESA’s M5 call, with enabling support from NASA, EnVision is currently in Phase A study for the next medium-class mission opportunity proceeding towards a final mission selection in summer 2021 for a launch in 2032. Here we discuss the science questions motivating the mission in more detail. Building on discoveries from Magellan, Venus Express and Akatsuki, EnVision will focus on three overarching questions:
- Is Venus geodynamically active?
- How did Venus arrive at its current state?
- How does the Venus climate work and how do the interior, surface and atmosphere interact?
1 – Is Venus geodynamically active?
Venus should be geologically active today and its globally young surface implies extensive volcanic resurfacing, but whether this happened in episodic global events or in a continuous process of small-scale resurfacing is uncertain. Constraining the rate of volcanic and tectonic activity can reveal whether Venus occupies one of these end members, or lies somewhere on the spectrum between.
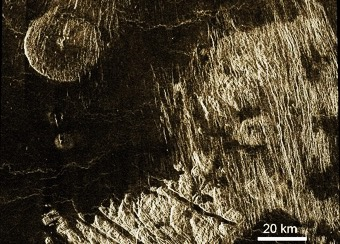
Magellan radar image mosaic of a 550 km wide region of Lada Terra (47°S, 25°E) showing a system of radar-bright and dark lava flows breaching a ridge belt and ponding in a large radar-bright deposit covering 100,000 km². Ammavaru, the source caldera, lies 300 km to the west (JPL/Caltech).
Understanding the tectonic regime driving resurfacing and heat loss is as important as knowing the rate of activity. The surface appears partitioned into areas of low strain bounded by narrow high strain margins. The abundance of steep slopes and landslides implies active uplift in these high strain areas, but existing data provide no constraint on the frequency of landslides or rates of tectonic movement. Are the low strain regions actively created and destroyed, like Earth’s oceanic plates, or simply mobilised locally? What is the significance of the global network of elevated rift systems and linear lowland wrinkle-ridged plains? Unique to Venus are coronae, quasi-circular volcano-tectonic features, typically 100–500 km across. Are they the surface expression of plumes, or magmatic intrusions, or subduction zones?
The processes of weathering, mass wasting and aeolian transport are critical for understanding both the geological history and climatic evolution of Venus. Venus Express found anomalously high IR emissivities near suspected active volcanoes, interpreted as fresh, unweathered lava flows, but both their mineralogy and the weathering processes involved are unknown. Magellan detected several, probably impact-related, dune fields at the limit of its resolution, and found indirect evidence for globally distributed smale-scale ripples.
2 – How Did Venus Arrive at its Current State?
The cratering record reveals that the Venus surface is, on average, under 1 Ga old. While some areas are likely active today, other regions, e.g. the tessera highlands, may be considerably older. Magellan data imply a variety of age relationships and long-term activity, with a non-random association between geological features and elevation, e.g. the uplands are consistently more deformed than the lowlands. Impact craters themselves show alteration to dark floors, perhaps from airfall deposits or magmatic resurfacing.
Densely fractured plains (right) abutting tessera (bottom); both are embayed by younger plains (dark areas). A steep-sided volcanic dome (upper left) may be the source of the plains or unrelated to them, and older or younger than the tesserae. Magellan image at 46°N, 360°E, after Basilevsky and McGill (2007).
Constraining the history is critical to understanding not only when and how resurfaced, but whether that activity has changed systematically through time. Were the plains formed in a short period by massive outpourings or by many thousands of small flows over their entire history? Or did many different mechanisms – including sedimentary processes – operate at different times and places? Globally, Venus exhibits perhaps even more tectonic deformation than Earth: what is its role in resurfacing the planet and have the regimes of tectonic deformation changed over time? How did tesserae, especially, accumulate their extraordinary degree of deformation?
The interior of Venus is probably Earth-like, but not the same; its core size is poorly constrained by Magellan gravity data. These data are consistent with an organised pattern of mantle convection but lack the resolution necessary to connect it with geological-scale features.
3 - How does the Venus climate work and how do the Interior, Surface and Atmosphere Interact?
How and why the atmospheres of two Earth-like planets evolved so differently is one of the many compelling reasons to study Venus, directly addressing the question of how our own world became habitable. Understanding its evolution depends on knowing the exchanges between its interior, surface and space.

The lower/middle clouds of Venus as imaged by Akatsuki IR2 camera. Dark areas represent thicker clouds, which may represent volcanic plumes of ash or sulphate particulates. (JAXA/ISAS/DART/Damia Bouic)
Models suggest that the clouds are maintained by a constant input of H2O and SO2, both of which vary considerably, perhaps because of volcanic emissions. Elevated D/H ratios indicate the loss of early oceans, but the ‘starting’ mantle D/H ratio is unknown. Identification of granites in the ancient highlands would support this inference, but the direct detection and characterisation of volcanic volatiles is key to inferring past climate evolution.
Beyond the specific investigations outlined above, however, the most important unknown factor in determining the present day state of Venus and its atmosphere, and how it arrived at that state, is the interaction between the interior, surface and atmosphere: the whole being more than the sum of the parts.
References
Basilevsky and McGill (2007), Surface evolution of Venus, in Exploring Venus as a Terrestrial Planet, Geophysical Monograph Series 176, edited by L. W. Esposito, E. R. Stofan and T. E. Cravens, pp. 23-43, American Geophysical Union, Washington, DC
How to cite: Ghail, R., Wilson, C., Widemann, T., Titov, D., Ansan, V., Bovolo, F., Breuer, D., Bruzzone, L., Campbell, B., Dumoulin, C., Helbert, J., Hensley, S., Kiefer, W., Komatsu, G., Le Gall, A., Marcq, E., Mason, P., Robert, S., Rosenblatt, P., and Vandaele, A. C.: The science goals of the EnVision Venus orbiter mission, Europlanet Science Congress 2020, online, 21 Sep–9 Oct 2020, EPSC2020-599, https://doi.org/10.5194/epsc2020-599, 2020.
Introduction:
VenSpec-H (Venus Spectrometer with High resolution), part of ESA’s EnVision M5 mission to Venus, is currently in Phase A (started in January 2019) in which the feasibility of the instrument is studied. The instrument successfully passed the mid-term mission consolidation review (May 2020). The mission selection review by ESA is planned beginning 2021.
Scientific objectives:
EnVision aims at the investigation of the geo-logical activity on Venus and its relationship with the atmosphere, in order to understand how Venus and Earth could have evolved so differently.
The VenSpec suite consists of VenSpec-H and two other instuments, VenSpec-M, an IR mapper, and VenSpec-U, a UV spectrometer. The overall scientific objective of this suite is to search for temporal variations in surface temperatures and tropospheric concentrations of gases indicative for volcanic eruptions. Additionally, the study of surface-atmosphere interactions and weathering by mapping surface emissivity and tropospheric gas abundances is also part of the mission.
The goal of the VenSpec-H instrument is to target different molecular species related to volcanism and surface changes on Venus. The measurement of the H2O and HDO constituents of the Venus’ atmosphere, as well as the probing of H2O, HDO, CO, OCS, SO2 in a 30 – 40 km altitude range is planned on the nightside and above the cloud top on the dayside. Several spectral windows are used to monitor these constituents in the range of 1 to 2.5 µm. VenSpec-H works in a nadir viewing geometry.
Instrument design:
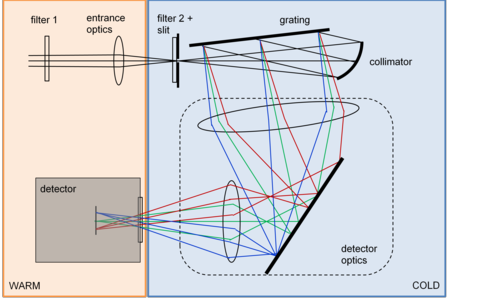
VenSpec-H is a spectrometer, hence, the heart of the instrument consists of a spectrometer section where the incoming uniform light is diffracted into its spectral components. This section is cooled down to approximately -45 °C in order to suppress as much as possible the thermal background. This is achieved by means of a large dedicated radiator. The warm baseplate is kept around 0 °C (by means of a small warm section radiator). The warm baseplate is mounted to the spacecraft deck using three kinematic feet.
The diffracting element in VenSpec-H is an echelle grating. The incoming light is first rendered parallel on a parabolic mirror before it hits the grating. The parallel light diffracted from the grating is focused by a dedicated optical system towards the detector.
The cold spectrometer section is preceded by a warmer band selection section. It is a combination of a filter wheel and a butcher’s block of two horizontal filters (on top of the spectrometer entrance slit).
The spectrometer section is followed by the detector section. The detector is an Integrated Dewar Detector Cooler Assembly (IDDCA). The dewar window sits in the exit aperture of the spectrometer section. The Focal Plane Array (FPA) is located a bit further in the focal plane of the spectrometer exit optics. The FPA is cooled by means of a cryocooler.
Preliminary optical and thermal analysis and modelling has been performed.
The instrument design relies partly on heritage from the NOMAD instrument, which is a spectrometer suite on board ESA’s Trace Gas Orbiter (TGO) satellite, a part of the ExoMars 2016 mission.
Ongoing tests:
Currently, thermo-mechanical prototyping work is performed using the facilities at BIRA-IASB, in order to prove the feasibility of some critical systems. One of the most critical elements in the VenSpec-H design is the cold section and its interconnection to a warm support structure. Several tests are planned.
In a first series of tests, the thermal conductivity is investigated by using different types of feet. Using a fixed cold temperature at one side, and knowing heat injection at other side, a ΔT can be determined.
In a second series of tests, the mounting mechanism of the cold section onto the warm section using a fixed connection on one side and a gliding pin on the other side, is tested. For this, an instrument prototype (including mass dummies for optical elements) is used, keeping the cold section at -25°C, while the warm base plate is at +20°C, the retraction and dilatation of the cold section is measured using capacitive sensors.
The different results obtained during these tests will be presented at the conference.
Acknowledgements:
This work has been performed with the support of the Belgian Science Policy Office (BELSPO), with the financial and contractual coordination by the ESA Prodex Office.
How to cite: Vanhamel, J., Vandaele, A.-C., Neefs, E., Robert, S., Jacobs, L., Berkenbosch, S., Thomas, I., Beeckman, B., Moelans, W., Lesschaeve, S., Algoedt, A., De Vos, L., and Vaughan, M.: Design and Development of the VenSpec-H Instrument, Europlanet Science Congress 2020, online, 21 Sep–9 Oct 2020, EPSC2020-535, https://doi.org/10.5194/epsc2020-535, 2020.
Introduction
Future exploration of Venus with state-of-the-art instruments can significantly improve our knowledge of the planet. Following this objective, EnVision is selected as one of the three candidates for the ESA’s Cosmic Vision M5 missions, with the goal of understanding the evolution of surface and interior, present-day geological activity and the climate of Venus. Subsurface Radar Sounder (SRS) onboard EnVision, is a nadir-looking low-frequency radar capable of profiling the shallow subsurface of Venus. SRS aims to support the understanding of the geological history of Venus by searching for subsurface dielectric interfaces characterizing structural and compositional discontinuities. The ability of SRS in extracting valuable scientific information depends on the properties of the geological targets and the instrument parameters. The current phase A of SRS design addresses the complex task of characterizing the target properties despite the large uncertainty on them. Thus, for understanding their detectability, a structured simulation strategy is developed considering many different possible target hypotheses.
This paper presents the simulation results and analysis of the SRS capability to detect three subsurface targets - buried craters, tesserae and lava flows. This is done considering the baseline design parameters of SRS (9 MHz central frequency, 6 MHz bandwidth) and a set of assumptions on the expected dielectric properties (real permittivity ε, loss tangent tanδ, and contrast Δε) of basalts at Venus temperatures [1]. For generating the target geo-electrical models of the crater and tessera, 75 m resolution Magellan stereo DEMs [2] are used. Their radargrams are simulated using a multi-layered coherent radargram simulator (MRS) [3] (processed for range compression and unfocussed SAR and do not contain noise). For the lava flows, DEMs are not available. Thus, Mars-analog lava flow radargrams acquired by SHARAD have been reprocessed to simulate the fully processed SRS radargrams using analog-based simulation approach [4].
Buried Crater
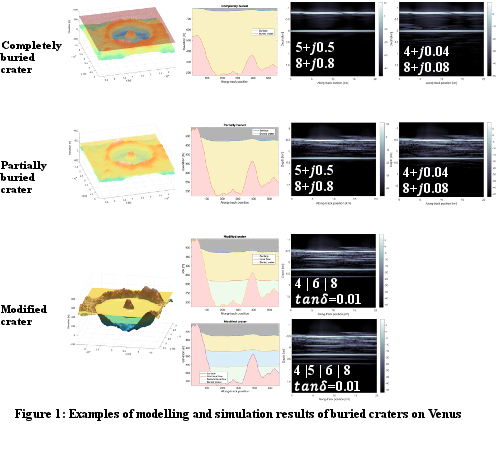
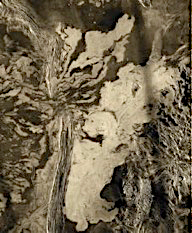
Craters on Venus are modified volcanically or tectonically, even to the extent of being completely buried without any surface expression. EnVision will determine the nature and thickness of post-impact infilling as indicators of relative surface age and modification history. SRS will support this goal by searching for buried impact craters and stratigraphic horizons representing different phases of resurfacing in the modified craters. For this target, the DEM of a Venus crater is modelled as embayed by one or more smooth overlying interfaces, resulting in the three possible scenarios (Fig.1): (1) completely buried, (2) partially buried, and (3) modified in multiple episodes. The dielectric permittivity values of the target layers are selected assuming that the deeper layers have higher real permittivity, owing to compaction to a higher density. For the completely buried scenario, the crater is clearly detectable when tanδ<0.1, while for the other two cases, the subsurface interfaces are detectable for tanδ∈[0.1-0.01]. The surface also contains the rim of the buried crater, which contributes to off-nadir clutter. Furthermore, for the modified crater, the different episodes of embayment are also clearly distinguishable.
Tessera
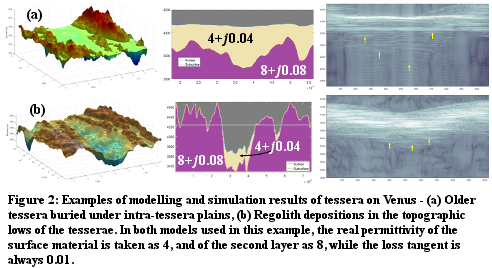
The tessera highlands may preserve the oldest terrains on Venus and record a complex geological history. The investigation of tesserae will be supported by searching for subsurface interfaces beneath the different tessera terrains to constrain their formation models. SRS will explore the detectability of the two hypotheses shown in Fig.2: (a) the continuity of the exposed tessera units partially buried beneath the intra-tessera plains, and (b) the presence of sediments (or in-situ weathered material) blanketing the tesserae. The available eroded tessera DEM represents the subsurface interface in Model-(a) (nearly-flat intra-tessera plains fill the troughs of the tessera), and the surface layer in Model-(b) (weathered material is deposited in the troughs). In Model-(a), the subsurface intensity is lower owing to the greater depth, while in Model-(b), clutter may obstruct the unambiguous extraction of the basal interface in regions of very shallow deposition. Nevertheless, the subsurface is detectable in both cases (yellow arrows). Moreover, the detectability can be significantly improved by fully focussed SAR processing, which is the baseline for SRS.
Lava flows
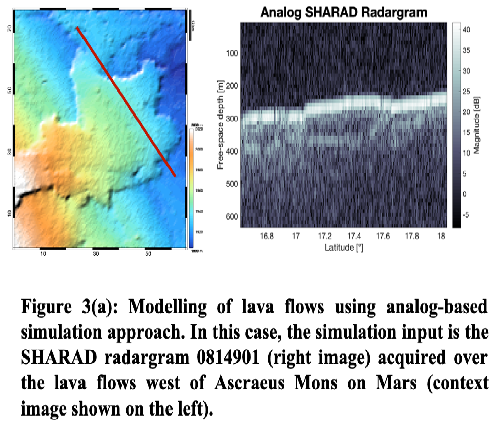
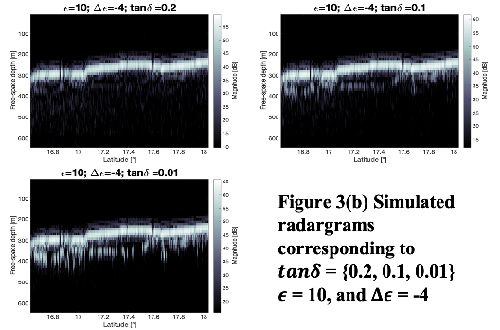
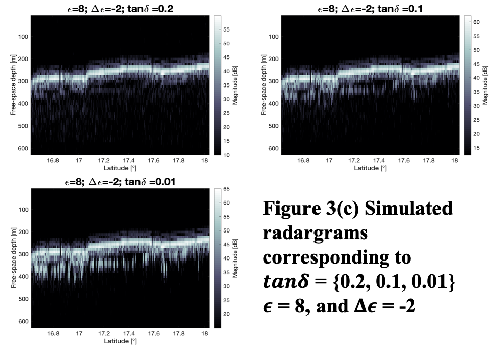
Volcanic eruptions are known to be the most important resurfacing mechanisms on Venus. EnVision aims to determine the nature and thickness of lava flows to understand their modes of emplacement, magma properties, dominant sources, and relative age. SRS will contribute to this goal by searching for the base of lava flows. Similar lava flows have been detected on Mars in several SHARAD radargrams [5]. We have used one of them (0814901) as input to the analog-based simulator [4]. Considering higher metal content, the overlying younger lava flow is assumed to have ε∈[8-10] and tanδ∈[0-01-0.2], while the underlying older and weathered flow is assumed to have ε∈[4-6]. From Figure 3(a-c), we see that the base is easily detectable for tanδ≤0.1, while even for tanδ=0.2, the interface can be seen, although with a weakly reflected power.
Conclusions
This paper presents a simulation-based analysis of the detectability of Venus subsurface targets by SRS on-board EnVision. The results indicate that the baseline design of SRS meets the required detection performance for the considered important Venusian targets. Further experiments and simulations are in progress to consolidate the selection of the baseline bandwidth and central frequency in order to optimize the achievement of the science goals of the mission.
References
[1] St.Amant, M.(1968), “Frequency and temperature dependence of dielectric properties of some common rocks.”
[2] Herrick, R. et. al.(2010) "A new data set for Venus: Stereo-derived topography for 20% of the planet at km-scale horizontal resolution." Lunar and Planetary Science Conference.
[3] Gerekos, C., et al.(2018). “A coherent multilayer simulator of radargrams acquired by radar sounder instruments.” IEEE Transactions on Geoscience and Remote Sensing.
[4] Thakur, S., & Bruzzone, L.(2019). “An approach to the simulation of radar sounder radargrams based on geological analogs.” IEEE Transactions on Geoscience and Remote Sensing.
[5] Carter, L., et al.(2009). “Dielectric properties of lava flows west of Ascraeus Mons, Mars.” Geophysical Research Letters.
Acknowledgements
This work is funded by Italian Space Agency under the contract “Attività scientifiche per il radar sounder di EnVision fase A” n.2019-25-HH.0.
How to cite: Thakur, S., Sbalchiero, E., Paolaz, E., Bovolo, F., and Bruzzone, L.: Venus subsurface targets: assessment of detectability using radar sounder simulations, Europlanet Science Congress 2020, online, 21 Sep–9 Oct 2020, EPSC2020-374, https://doi.org/10.5194/epsc2020-374, 2020.
Tidal forces acting on a planet cause a deformation and mass redistribution in its interior, involving surface motions and variation in the gravity field, which may be observed in geodetic experiments. The change in the gravitational field of the planet, due to the influence of an external gravity field, described primarily by its tidal Love number k of degree 2 (denoted by k2) can be observed from analysis of a spacecraft radio tracking. The planet's deformation is linked to its internal structure, most effectively to its density and rigidity. Hence the tidal Love number k2 can be theoretically approximated for different planetary models, which means comparing the observed and theoretical calculation of k2 of a planet is a window to its internal structure.
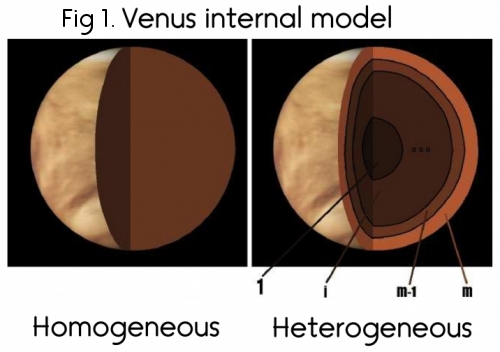
The terrestrial planet Venus is reminiscent of the Earth twin planet in size and density, which leads to the assumption that the Earth and Venus have similar internal structures. In this work, with a Venus density profile computed by Aitta [2012] and assuming that the planet in question is in hydrostatic equilibrium, we investigate the elastic parameters of each of Venus major layers to calculate its tidal Love number k2. The calculation of k2 is done with ALMA, a Fortran 90 program by Spada [2008] for computing the tidal and load Love numbers using the Post-Widder Laplace inversion formula. After implementing the Andrade rheology to ALMA, we investigate several different rheologies for the mantle of Venus as Maxwell, Burgers and Andrade rheologies.

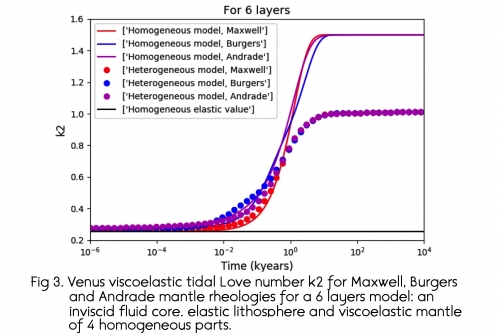
The tidal Love number k2 of Venus is of 0.3±0.024, depending on the mantle rheology and number of mantle layers. With a more heterogeneous model, equivalently a higher number of layers, difference of the k2 values between different mantle rheology models decreases. An Andrade rheology model has indeed an apparent transient phase which manifests after 10 years, this phase makes the transition between short-term (before 10 years) and long-term (after 100 years) gravity field deformation smoother than that of Maxwell and Burgers. The curve of k2 for Burgers rheology for a three layers model is relatively uneven, it gets smoother while adding more layers. From the tidal Love number k2, we also conclude the dissipation function Q-1 and the tide-induced phase lag ε of Venus. Finally we compare the values obtained for k2, Q-1and with that of the work of different authors.
References:
How to cite: Saliby, C., Fienga, A., Spada, G., Memin, A., and Melini, D.: Exploring Venus internal structure by its tidal response, Europlanet Science Congress 2020, online, 21 Sep–9 Oct 2020, EPSC2020-237, https://doi.org/10.5194/epsc2020-237, 2020.
Introduction:
The primary goals of the radio-science experiment (RSE) of EnVision are to improve our knowledge of the internal structure of Venus and to contribute to the understanding of the atmospheric sulfur cycle, associated to volcanic emissions.
The internal structure of Venus is still uncertain (size and state of the core, average lithospheric and crustal thicknesses, as well as their lateral variations). These are the key parameters to constrain the mantle composition and thermal evolution of the planet. Without the availability of seismic data, the gravity field is the only tool allowing to determine the radial structure of a planet, as well as the regional variations of crustal and lithospheric properties.
The sulfuric acid in the atmosphere is part of the sulfur cycle and may be linked to the volcanism activity. The monitoring of its abundance is important to constrain the outgassing from the interior.
RSE is then divided into two sub-experiments : the gravity experiment and the atmospheric experiment. RSE will be performed by using the transponder system onboard the spacecraft, with the addition of an Ultra-Stable Oscillator (USO) for the atmospheric experiment.
Gravity experiment :
The Doppler shift of the carrier frequency of the Earth-to-orbiter radio-link is used to track the spacecraft orbital motion. The asymmetrical planetary gravity field perturbs the motion of the spacecraft in orbit. This perturbed motion is reconstructed from the Doppler tracking data in order to estimate the planetary gravity field. The spatial resolution and the accuracy of this gravity solution depends on the orbital altitude, the total Doppler noise, the coverage, the a priori knowledge of the gravity field itself, the modelling of the non-gravitational forces due to the atmospheric drag, the radiation pressure (solar radiation, cloud top-layer albedo and infra-red emission) as well as residual accelerations generated by attitude maneuvers [1, 2, 3].
The elliptical orbits of the Magellan spacecraft have indeed provided a gravity field solution with a spatial resolution of about 300 km on average but include large surface areas with worse (500 km) spatial resolution in the northern and southern hemisphere at mid-latitudes [2, 4]. The EnVision gravity field solution will improve the Magellan solution by providing a spatial resolution of 200 km on average. The planned orbit for the EnVision scientific nominal phase is a polar slightly elliptical orbit (220-525 km altitude), allowing to reach this averaged resolution. The accuracy of the gravity field solution is also expected to be improved because of the lower Doppler frequency noise, compared to Magellan, and of a better coverage due to the length of the mission of 6 cycles (i.e. 4 Earth’s years, with 3.5 effective hours of tracking per day on average performed during the telemetry downlink passes).
It is expected that the k2 tidal potential Love number precision will be better than 3% (compared with the 22% for the Magellan solution [5]), which will result in an improved constraint of the state and the size of the core [6].
Radio-occultation experiment:
Earth occultations shall be performed to derive the atmospheric structure (temperature, pressure, number density), the H2SO4 absorption and the electron density profile of the ionosphere of Venus [6]. Occultations shall be performed at the beginning and at the end of the telemetry downlink passes, up to 4 ingress and 4 egress observations per day using a one-way X-Ka downlink, thanks to the use of an USO (ADEV better than 5e-13). Because of the short orbital period of EnVision and its near polar orbit, all latitudes, longitudes, local times and solar zenith angles shall be covered. This will allow to observe short-term variations of the temperature and pressure profiles caused by atmospheric waves.
The observation of the H2SO4 content is fundamental to understand the cloud formation and convection processes. In particular the sounding by Ka-band (34 GHz) for the first time will allow to derive the H2SO4 content in the altitude range between 35 and 55 km, at the 1 ppm level, because of the high sensitivity of Ka-band to sulfuric acid absorption. The dual-frequency downlinks (simultaneous X- and Ka-bands) will distinguish between gaseous and liquid H2SO4 absorption features at around 50 km altitude (detection at 1 mg/m3 level for the liquid part). H2SO4 temporal variations from hours to years during the mission time shall be investigated with very good latitudinal coverage.
References :
[1] Marty et al., Planet. Space Sci. 57(3), pp. 350-363 (2009);
[2] Konopliv, A.S. et al., Icarus 139(1), pp. 3-18 (1999);
[3] Genova et al., Icarus, 272, pp. 228-245 (2016);
[4] Anderson, F.C. & Smrekar, S.E., J. Geophys. Res. 111(E8), 10.1029/2004JE002395;
[5] Konopliv, A.S. & Yoder, C.F., Geophys. Res. Lett. 23(14), pp. 1857-1860 (1996);
[6] Dumoulin C. et al., J. Geophys. Res. 122(6), pp. 1338-1352 (2017).
How to cite: Dumoulin, C., Rosenblatt, P., Tellmann, S., Genova, A., Marty, J.-C., Pätzold, M., Oschlisniok, J., Kaspi, Y., Galanti, E., Withers, P., and Fienga, A.: EnVision Radio Science Experiment, Europlanet Science Congress 2020, online, 21 Sep–9 Oct 2020, EPSC2020-755, https://doi.org/10.5194/epsc2020-755, 2020.
Introduction: The Venus Emissivity Mapper is the first flight instrument designed to focus on mapping the surface of Venus using several atmospheric windows around 1 µm. After years of development, VEM now has a mature design. An existing laboratory prototype has verified an achievable instrument SNR of well above 1000, as well as predicted error in retrieval of relative emissivity of better than 1%, assuming the availability of improved Venus topography.
VEM science goals: The instrument will provide a global map of rock type from orbit, assessing iron contents and the redox state of the surface by observing the surface with six narrow band filters, ranging from 0.86 to 1.18 µm. Three additional windows allow corrections for cloud composition and variability, two measure water abundance, and three compensate for stray light. Continuous observation of Venus’ thermal emission will also place tighter constraints on current volcanic activity. Eight channels provide measurements of atmospheric water vapor abundance as well as cloud microphysics and dynamics, permitting accurate correction of atmospheric interference on the surface data.
The instrument is currently part of two Phase A studies: is part of the payload of the NASA VERITAS mission as well as of the ESA EnVision mission, here as the VenSpec-M channel in the VenSpec spectrometer suite.
Combining VEM with a high-resolution radar mapper will provide key insights into the divergent evolution of Venus and Earth. Flying VEM on more than one mission will enable a long timeline of monitoring for volcanic activity on Venus. Combined with the existing VenusExpress data, VEM enables detection and mapping of surface changes over decades.
VEM Design: The VEM system design is a pushbroom multispectral imaging system. It leverages a proven measurement technique pioneered by VIRTIS on Venus Express (VEX). It also incorporates lessons learned from VIRTIS to achieve greatly improved sensitivity and spectral and spatial coverage:
- A filter array (rather than a grating) provides wavelength stability (band-center and width-scatter) ~5× more stable and maximizes signal to the focal-plane array (FPA).
- Spectral windows below 1µm are covered for the first time.
- A two-stage baffle decreases scattered light and improves sensitivity.
- Use of an InGaAs detector with an integrated thermal electric cooler (TEC) eliminates the need for cryogenic cooling.
The design maturity, combined with a standard camera optical design, leads to low development risk.
VEM prototyping: VEM has been under development for several years with significantly financial investment from DLR. Following creation of the first breadboard model in 2015 during Phase A for the NASA Discovery proposal VERITAS, a laboratory prototype (LP) of the VEM instrument has been developed. This prototype includes the development version of the VEM optics with a filter array with two active filter strips. The optics underwent a set of calibration measurements on sub-unit level at LATMOS prior to delivery to DLR. All key optical design parameters including transmission and wavelength coverage have been verified using the VEMO prototype.
A first performance evaluation of the VEM prototype used two Venus analog samples heated to Venus surface temperatures. This was performed using the Venus simulations setup at the Planetary Spectroscopy Laboratory with the prototype mounted on the chamber. The retrieved emissivities match laboratory values, and uncertainty for a single unbinned exposure is <0.35%. VEM uses onboard software developed for MERTIS to bin, co-add, and losslessly compress data upon uplink command. During science orbits, VEM oversamples at 10 km spatial resolution (33×33 pixel binning). To further enhance SNR, VEM uses digitial TDI to provide 189× gain over single-pixel SNR. Based upon current performance of the laboratory prototype for a single unbinned exposure and SNR enhancement due to onboard processing, we expect a system SNR of well beyond 1000.
VEM atmospheric correction: Methodology for retrieving surface emissivity is complex but well understood and demonstrated. To distinguish between surface and atmospheric contributions, VEM uses an updated version of the extensively tested pipeline developed to process VIRTIS data, combined with a radiative transfer model (RTM). Surface emissivity retrieval techniques were developed based on Galileo NIMS observations at 1700, 1800 and 2300 nm. VEM cloud bands occur at 1195, 1310, and 1510 nm, the first on the flank of the 1180‑nm surface windows. VEM’s cloud bands are close to surface bands, providing near-optimal correction. Only relative emissivity measurements are needed to calculate the spectral slope to meet our surface emissivity requirements. We do not have a requirement on the accuracy of the retrieved emissivity. However, we can now tie an emissivity retrieval to in situ measurements to assess accuracy. For this comparison, the Venera 9 and 10 landing sites (not observed by VIRTIS) will be observed by VEM both on EnVision and on VERITAS.
VEM observes each spot on the surface multiple times. Therefore both atmospheric and instrument noise are reduced by averaging image swaths acquired at different times. Applying the updated analysis of atmospheric error for VEM parameters and taking multiple-look averaging into account, our capability for emissivity precision is better than 1.5% for all bands and better than 1% in most bands.
Conclusion: VEM builds on recent advances in the laboratory analog spectroscopy at PSL at DLR. It is the first flight instrument designed to focus on mapping the surface of Venus using atmospheric windows around 1 µm. VEM has a mature design with an existing laboratory prototype that verifies an achievable instrument SNR of >1000, as well as a predicted error in the retrieval of relative emissivity of better than 1%.
How to cite: Helbert, J., Dyar, D., Walter, I., Ryan, C., Marcq, E., Widemann, T., Reess, J.-M., Maturilli, A., Müller, N., Kappel, D., Alemanno, G., Arnold, G., D'Amore, M., Rosas-Ortiz, Y., Smrekar, S., and Ghail, R.: The Venus Emissivity Mapper – Obtaining Global Mineralogy of Venus from Orbit on the ESA EnVision and NASA VERITAS missions to Venus. , Europlanet Science Congress 2020, online, 21 Sep–9 Oct 2020, EPSC2020-260, https://doi.org/10.5194/epsc2020-260, 2020.
In this presentation we will describe recent work to model upward and downward fluxes of solar and thermal radiation in the atmosphere of Venus using the NEMESIS radiative transfer and retrieval tool (Irwin et al., JQSRT, 109, 1136, 2008). Using a plane-parallel matrix operator multiple-scattering model we simulate the internal 3D radiation field within Venus’ atmosphere and compare our simulations with the observations of the Pioneer Venus and Venera 13 and 14 entry probes. Such simulations allow us to assess the availability of sunlight and the visibility of the sun azimuth direction in the cloud layer for potential balloon missions, and also enables us to predict at what altitude the surface will become visible for probes descending on dayside. A reanalysis of the Venera 13 and 14 radiance spectra observations will be used to reassess earlier estimates of cloud structure and water vapour abundance. Such modelling also allows us to simulate the visible appearance of Venus’ atmosphere during the descent of a probe mission as will be shown.
How to cite: Irwin, P., Wilson, C., Alday, J., Roos-Serote, M., Barstow, J., and Aslam, S.: Modelling the in situ solar and thermal radiation environment for future entry probe missions to Venus, Europlanet Science Congress 2020, online, 21 Sep–9 Oct 2020, EPSC2020-312, https://doi.org/10.5194/epsc2020-312, 2020.
Please decide on your access
Please use the buttons below to download the presentation materials or to visit the external website where the presentation is linked. Regarding the external link, please note that Copernicus Meetings cannot accept any liability for the content and the website you will visit.
Forward to presentation link
You are going to open an external link to the presentation as indicated by the authors. Copernicus Meetings cannot accept any liability for the content and the website you will visit.
We are sorry, but presentations are only available for users who registered for the conference. Thank you.