Europlanet Science Congress 2020
Virtual meeting
21 September – 9 October 2020
Europlanet Science Congress 2020
Virtual meeting
21 September – 9 October 2020

Poster presentations and abstracts

TP5

Space missions have provided a wealth of data on the atmospheres and aeronomy of rocky planets and moons, from the lower layers up to the external envelopes in direct contact with the solar wind. A recent emerging finding is evidence that the atmosphere behaves as a single coherent system with complex coupling between layers.

This session solicits contributions that investigate processes at work (chemistry, energetics, dynamics, electricity, escape etc...) on the terrestrial bodies of the Solar System and includes studies of the coupling between the lower/middle and upper atmospheres. Contributions based on analysis of recent spacecraft and ground-based observations, comparative planetology studies, numerical modelling and relevant laboratory investigations are particularly welcome. The session will consist of invited and contributed oral talks as well as posters.

Co-organized by OPS
Convener: Anni Määttänen | Co-conveners: Francisco González-Galindo, Dmitrij Titov

Session assets

Session summary

EPSC2020-75
Vladimir Krasnopolsky

Intoduction. The recent progress in the studies of Pluto is related to the New Horizons flyby, and the solar and stellar occultations at 52-187 nm revealed vertical profiles of N2, CH4, C2H2, C2H4, and C2H6 (Gladstone et al. 2016, Young et al. 2018, Kammer et al. 2020). The ALMA submillimeter spectroscopy (Lellouch et al. 2017) gave a CO profile, abundance of HC14N, and restrictive upper limits to HC15N and HC3N. The photochemical model of Pluto’s atmosphere and ionosphere (Krasnopolsky 2020) reproduces fairly well these data. Recently methylacetylene and atomic hydrogen were detected using UV spectroscopy from New Horizons (Steffl et al. 2020).

Metylacetylene C3H4abundance of 5×1015 cm-2 observed from New Horizons is close to 7.7×1015 cm-2 in our early model (Krasnopolsky and Cruikshank 1999) but exceeds 9×1014 cm-2 in Krasnopolsky (2020). To bring the model into agreement with the observation, rate coefficients of the three key reactions of C3H4 production and removal are changed to the values calculated by Vuitton et al. (2019). The calculated C3H4 abundance is 4.3×1015 cm-2 (Figure 1).


Main reactions of production and loss of C3H4 are shown in Figure 2. Column abundances of some species in the model and its previous version are shown in Table 1 along with production and loss rates, escape and precipitation flows, and chemical lifetimes. The HC3N abundance of 2.3×1013 cm-2 in the model is close to the upper limit of 2×1013 cm-2 (Lellouch et al. 2017). The change in the model increases H2 and C3H8 by factors of 1.3 and reduces H and C4H2 by factors of 1.3, while the other species remain almost unchanged relative Krasnopolsky (2020).

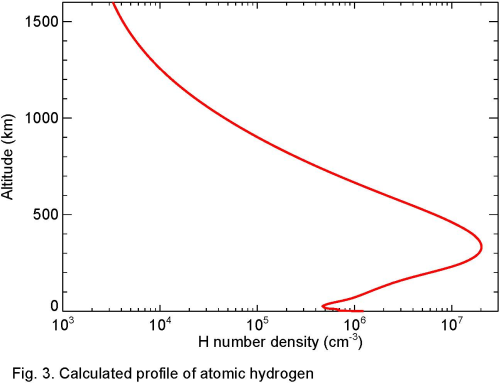
   

Atomic hydrogen abundance of (7.7±1.7)×1013 cm-2 at τ=1 (490 km) was measured (Steffl et al. 2020) using the observed Lyman-beta emission. This value is 6.9×1013 cm-2 in our model (Fig.3) and 7.3×1013 cm-2 in the previous version (Krasnopolsky 2020).

Reflectivity of 0.17 at 140-185 nm (Steffl et al. 2020) agrees with the HST value of 0.14 at 180-190 nm (Krasnopolsky 2001).

Nitrogen isotope ratio. The observed lower limit HC14N/HC15N > 125 on Pluto (Lellouch et a. 2017) agrees with 14N/15N in the planets, asteroids, comets, and the solar wind. However, it looks puzzling compared to HC14N/HC15N = 60 on Titan that is perfectly explained by predissociation of N2 at 80-100 nm (Liang et al. 2007, Krasnopolsky 2016). Both Pluto and Titan have nitrogen-methane atmospheres with significant similarity in photochemistry.

Major reactions of production and loss of HCN on Pluto are given in Table 2. Our analysis confirms predissociation of N2 at 80-100 nm as the major process of nitrogen isotope fractionation on Pluto. Kinetic isotope effect induced by difference of reduced mass of the reactants is very small, for example, k14/k15 = 1.006 for CH + HCN → CHCN + H. Our calculation gives negligible photo-induced isotope fractionation for HCN. Isotope fractionation in condensation of ammonia is calculated at 1.04 for Pluto’s conditions using measurements by King et al. (1989). This value is adopted for HCN on Pluto.

The observed twofold difference on Pluto is partially caused by diffusive depletion of the heavy isotope in HCN and in predissociation of N2. On Pluto, mean altitudes of HCN and predissociation of N2 are 500 and 860 km, well above the homopause at 96 km. On Titan, the observations of HC14N/HC15N refer to 90-460 km (Vinatier et al. 2007), predissociation happens near 985 km, both below the homopause at 1000 km, and diffusive depletion does not occur. Therefore the observed limit corresponds to 14N/15N > 253 for N2 in the lower atmosphere and 14N/15N > 228 in the upper layers of the N2 ice. These limits reflect the conditions on Pluto in the last two million years. The current loss of N2 is 37.5 g cm-2 Byr-1 primarily to photodestruction. The c­alculated isotope fractionation factor of 1.96 accounts for formation and condensation of nitriles, diffusive separation, and fractionation in thermal escape. Variations of 14N/15N in the N2 ice are relevant to evolution of the solar EUV, mixing processes in the N2 ice, and possible periods of hydrodynamic escape that are poorly known and not considered here.

References

Gladstone, G.R., et al., 2016. Science 351 (6279), aad8866.

Kammer, J.A., et al., 2020. Astron. J. 159, 26 (9pp).

King, T.V., et al., 1989. Z. Naturforsch. 44a, 359-370.

Krasnopolsky, V.A., 2001. Icarus 153, 277-284.

Krasnopolsky, V.A., 2016. Planet. Space Sci. 134, 61-63.

Krasnopolsky, V.A., 2020. Icarus 335, 113374.

Krasnopolsky, V.A., Cruikshank, D.P., 1999. J. Geophys. Res. 104, 21979–21996.

Lellouch, E., et al., 2017. Icarus 286, 289-307.

Liang, M.C., et al., 2007. Astrophys. J. Lett. 664, L115-L118.

Steffl, A.J., et al., 2020. Astron. J. 159, 274 (12pp).

Vinatier, S., Bezard, B., Nixon, C.A., 2007. Icarus 191, 712-721.

Vuitton, V., Yelle, R.V., Klippenstein, S.J., Hӧrst, S.M., Lavvas, P., 2019. Icarus 324, 120-197 (supplementary material).

Young, L.A., et al., 2018. Icarus 300, 174-199.


How to cite: Krasnopolsky, V.: On the Methylacetylene Abundance and Nitrogen Isotope Ratio on Pluto, Europlanet Science Congress 2020, online, 21 Sep–9 Oct 2020, EPSC2020-75, https://doi.org/10.5194/epsc2020-75, 2020.

EPSC2020-997ECP
Randi Beil and Robert Hinde

The infrared absorption spectrum of carbon dioxide-rich planetary atmospheres, such as Venus or ancient Mars, can be difficult to model due to the presence of collision-induced absorption (CIA) features. These features appear in the 0-250 cm-1 region and are caused by the interaction-induced (I-I) dipole moments of carbon dioxide dimers. Studying these I-I dipole moments can lead to more accurate atmospheric models, which may then be used to create better estimates of the surface temperature of these planets thus revealing information about their climates either now (for Venus) or in the ancient past (for Mars).

To investigate the I-I dipole moments of COdimers, a finite-field approach was used to calculate the response properties of a carbon dioxide monomer, along with the energies and dipole moments of a T-shaped CO­dimer as a function of the intermolecular distance. Using the monomer results as fitting parameters, functions modeling these dipole moments were developed and compared to an analytically developed equation by M. S. A. El-Kader and G. Maroulis [1]. The resulting models for the I-I dipole moments presented here are thus based on purely ab initio results and are independent of any experimental variables.

The response properties of the carbon dioxide monomers and the energies and dipole moments of the CO­dimers were calculated using the GAMESS-US ab initio software program and the NWChem ab initio software program. The I-I dipole moment equations were developed using the aug-cc-pVTZ basis set at the RHF, MP2, CCSD, and CCSD(T) levels of theory and the aug-cc-pVQZ and aug-pc-3 basis sets at the RHF and MP2 levels of theory. We have, to the best of our knowledge, reported the first purely ab initio I-I dipole moment model of a COdimer. The resulting functions had a maximum absolute error below 10-3 au as shown in Figure 1, indicating that the functions provide an accurate description of the ab initio I-I dipole moments.

References:

1. El-Kader, M. S. A.; Maroulis, G. Chem. Phys. Lett670, 95-101 (2017)


How to cite: Beil, R. and Hinde, R.: Interaction-Induced Dipole Moments of Carbon Dioxide, Europlanet Science Congress 2020, online, 21 Sep–9 Oct 2020, EPSC2020-997, https://doi.org/10.5194/epsc2020-997, 2020.

EPSC2020-157
Emily Mason and Michael Smith

The Mars Exploration Rovers (MER), Spirit and Opportunity, landed on Mars in 2004 just weeks apart. Using spectra from the Miniature Thermal Emission Spectrometer (Mini-TES), both rovers were able to sample the lowest 2 km of the vertical temperature profile of the atmosphere. During a single observation for Mini-TES, spectra were taken every two seconds with observations lasting up to 42 minutes. While results up to this point have averaged the spectra together to retrieve information on dust, water vapor and temperature, individual temperature retrievals are possible every two seconds and contain information on short timescale atmospheric fluctuations. These fluctuations are indicative of boundary layer behavior at each site. We have retrieved the vertical temperature profile from individual spectra and have used these profiles to assess boundary layer conditions at each rover location. We will present temperature profiles from individual retrievals and identify and characterize fluctuations within these profiles. We will also show the seasonal variation of these fluctuations over the first 1200 sols (nearly 2 Mars Years) for both Spirit and Opportunity rovers.

How to cite: Mason, E. and Smith, M.: Boundary Layer Characterization using Mini-TES observations from the Mars Exploration Rovers, Europlanet Science Congress 2020, online, 21 Sep–9 Oct 2020, EPSC2020-157, https://doi.org/10.5194/epsc2020-157, 2020.

EPSC2020-741
Nadir retrieval of ice clouds, dust and ozone from NOMAD/UVIS on board Exomars TGO
(withdrawn)
Yannick Willame, Ann C. Vandaele, Arianna Piccialli, Cédric Depiesse, Frank Daerden, Ian R. Thomas, Bojan Ristic, Michael J. Wolff, Jon Mason, Manish R. Patel, Giancarlo Bellucci, and Jose-Juan Lopez-Moreno
EPSC2020-262
Antoine Martinez, Ronan Modolo, François Leblanc, Jean-Yves Chaufray, and Olivier Witasse

Abstract

In this work, we compare simulation of the precipitating flux for different solar wind dynamic pressure with MAVEN observations. In particular, we focus on the fluxes of precipitating ion towards Mars' atmosphere as seen by MAVEN/SWIA (cs product), an energy and angular ion spectrometer [1]. We also use LatHyS, which is a 3D multispecies parallelized hybrid model that describes the formation of Mars electromagnetic environment induced by its interaction with the solar wind [2]. 


1. Introduction

Although atmospheric sputtering is a minor component of atmospheric escape today, it is thought to have been much more important four billion years ago [3].  Heavy ion precipitation is the primary driver of atmospheric sputtering. At the present epoch, the efficiency of Mars' atmospheric sputtering by precipitating heavy ions to induce atmospheric escape is expected to be small compared to other mechanisms of atmospheric erosion.  However, since the main driver of sputtering is ion precipitation, it is crucial to constrain the dependence of the precipitating ion flux on present solar wind conditions, before any extrapolation to past solar conditions. By comparing simulation results and MAVEN observations, we here investigate the mechanisms controlling the precipitation when the solar wind dynamic pressure change.

We will present how the precipitating ion flux, measured by MAVEN/SWIA, is influenced by the solar wind dynamic pressure and will analyze these observations by comparison with simulation results.

2. Observations and simulations results

We define two sets of different solar wind dynamic pressure from the set of MAVEN observations of the precipitating flux and simulate Mars’ interaction with the solar wind for the average values of the solar parameters (Extreme Ultraviolet irradiance, Interplanetary magnetic field, solar wind density, solar wind speed...) for both sets. We then reconstruct map of the precipitating heavy ion flux at 250km in altitude and the simulated precipitating flux along each MAVEN trajectory used in our analysis.

3. Summary

Comparing MAVEN observations with models improves our understanding of the parameters that control the precipitating ion flux. By defining two sets, characterized by different solar wind dynamic pressure and modelling them, we present the comparison between models and observations.


Acknowledgements

This work was supported by the DIM ACAV and the ESA/ESTEC faculty. This work was also supported by CNES “Système Solaire” program and by the “Programme National de Planétologie” and “Programme National Soleil-Terre”. This work is also part of HELIOSARES Project supported by the ANR (ANR-09-BLAN-0223), ANR MARMITE (ANR-13-BS05-0012-02) and ANR TEMPETE (ANR-17-CE31-0016). Spacecraft data used in this paper are archived and available in the Planetary Data System Archive (https://pds.nasa.gov/). Numerical simulation results used in this article can be found in the simulation database (http://impex.latmos.ipsl.fr).


References

[1] Leblanc F., R. Modolo and al. (2015), Geophys. Res. Lett, 42, 9135-9141, doi : 10.1002/2015GL066170.

[2] Modolo, R., et al. (2016), J. Geophys. Res. Space Physics, 121, 6378–6399, doi: 10.1002/2015JA022324.

[3] Luhmann, J.G., Johnson, R.E., Zhang, M.H.G., (1992), Geophys. Res. Lett., 19, 21, 2151-2154.

How to cite: Martinez, A., Modolo, R., Leblanc, F., Chaufray, J.-Y., and Witasse, O.: Influence of the solar wind dynamic pressure on the ion precipitation: MAVEN observations and simulation results., Europlanet Science Congress 2020, online, 21 Sep–9 Oct 2020, EPSC2020-262, https://doi.org/10.5194/epsc2020-262, 2020.