Oral presentations and abstracts
Space missions have provided a wealth of data on the atmospheres and aeronomy of rocky planets and moons, from the lower layers up to the external envelopes in direct contact with the solar wind. A recent emerging finding is evidence that the atmosphere behaves as a single coherent system with complex coupling between layers.
This session solicits contributions that investigate processes at work (chemistry, energetics, dynamics, electricity, escape etc...) on the terrestrial bodies of the Solar System and includes studies of the coupling between the lower/middle and upper atmospheres. Contributions based on analysis of recent spacecraft and ground-based observations, comparative planetology studies, numerical modelling and relevant laboratory investigations are particularly welcome. The session will consist of invited and contributed oral talks as well as posters.
Session assets
Permanently shadowed regions (PSRs) are areas of a planetary surface that lie in continual shadow from direct sunlight. Their existence at the lunar polar regions has been recognized for nearly 70 years [1] and in the intervening time much has been learned about their unique thermal environment and capacity for volatile preservation [2]. In the absence of direct sunlight and without an atmosphere to transport and trap heat, lunar PSRs remain cold throughout the year, with maximum temperatures typically below ~110 K, although temperatures as low as 45 K have been reported in some areas [3]. At these low temperatures, PSRs can act as cold traps for H2O water ice as sublimation rates are negligibly low (~1 mm Gyr-1).
In addition to H2O, other volatile species, such as CO2, NH3, H2S, SO2, and CH4 are regularly supplied to the Moon through cometary impacts or are created through solar wind interactions. These species have been observed in varying abundances by the Lunar CRater Observation and Sensing Satellite (LCROSS) experiment within Cabeus crater near the south pole [4]. Once delivered or produced, these molecules may migrate about the lunar surface through a series of ballistic hops and potentially accumulate within cold traps near the poles if temperatures are sufficiently low. Relative to H2O, however, these volatiles have higher vapor pressures and thus require lower temperatures for long-term thermodynamic stability; thus, not all volatiles detected in the LCROSS plume are expected to be cold trapped in the current lunar thermal environment. CH4, for example, which has been detected in the lunar exosphere [5], is stable at temperatures below ~25 K [6], which is too low to be cold trapped, although it can be adsorbed on the surface. Other volatiles, in contrast, such as CO2, are stable at relatively higher temperatures (Tmax < 55 K) and potentially accumulate within the coldest regions of permanent shadow. Observational evidence for CO2 frost has recently been provided by the Lyman Alpha Mapping Project (LAMP) instrument on the Lunar Reconnaissance Orbiter (LRO) [6]. Although Diviner temperature data do not indicate significantly large regions where CO2 is stable, micro cold traps (at cm scales) will provide additional cold trapping area.
Modelling the diurnal and seasonal migration patterns of different exospheric volatiles can shed light on geotemporal trends in volatile dispersion and cold trapping [7, 8, 9, 10], and may additionally aid in the interpretation of orbital remote sensing data. In this work, we use a Monte Carlo model to simulate the ballistic migration of the aforementioned cometary volatiles to understand differences in their migration, destruction and cold trap capture. The model utilized here is similar to that described in Kloos et al. [11]. Individual molecules of a given volatile are placed on the surface at non-polar latitudes (equatorward of ±80°) using a randomized production scheme. The molecule is assumed to achieve instantaneous thermal equilibrium with the lunar regolith and acquire the local surface temperature. For surface locations equatorward of ±80°, temperatures are obtained using global, topographically resolved Diviner temperature maps [12]. Due to the slight obliquity of the Moon (< 1.59°), however, the polar temperatures can vary significantly throughout the year. Thus, we have updated the model to include the recently available seasonal Diviner polar temperature data created by Williams et al. [13]. These maps enable more realistic simulations of the ballistic polar migration than that reported by Kloos et al. [11].
To calculate the adsorption residence time, τ, for a molecule, we use the relationship defined by Langmuir [14]:
τ = (1/ν0)exp(Ea/kBTsurf), (1)
where ν0 is the vibrational frequency, Ea is the activation energy and Tsurf is the surface temperature. The variables ν0 and Ea are obtained for each volatile using data from Sandford and Allamandola [15]. Once molecules are released, they inherit a velocity vector using three-dimensional cartesian coordinates, where the vector direction is randomized and the speed is drawn from an Armand distribution. Molecules ejected outward from the surface may be photodissociated through interaction with solar UV photons. Photo-destruction rates for each species are determined using data compiled by Huebner et al., [16], derived for normal sun activity. The effects of surface roughness, which may delay the pole-ward migration of molecules by increasing the number of hops at a given location, are incorporated into the model and we quantify these effects on the velocity distribution for different volatile species.
Figure 1 shows the north and south geographic delivery patterns for H2O, where the y-axis gives the PSR particle concentration σp normalized by the production rate γ. It is found that the north/south asymmetry in PSR capture reported by Kloos et al., [11] persists using the updated Diviner polar temperature data. The bulk majority (~82%) of H2O molecules are destroyed through photolysis, while the remaining are cold trapped in PSRs (<< 1% achieve escape velocity). Results for other volatile species will be available by the commencement of the conference.

Figure 1. Geographic trends in PSR-capture of H2O molecules.
References
[1] Urey, 1952, Yale University Press. [2] Lawrence, 2017 JGR-Planets. [3] Paige et al., 2010, Science. [4] Colaprete et al., 2010, Science. [5] Hodges, 2016, GRL. [6] Hayne et al., 2019, LPSC Abstract (Contrib. No. 2132). [7] Butler, 1997, JGR. [8] Schorghofer, 2014, GRL 41, 4888. [9] Moores, 2016, JGR-Planets 121, 46. [10] Prem et al., 2018, Icarus 299, 31. [11] Kloos et al., 2019, JGR-Planets 124, 1935. [12] Williams et al., 2017, Icarus. [13] Williams et al., 2019, JGR-Planets 124. 2505 [14] Langmuir, 1916, Physical Review. [15] Sandford & Allamandola, 1993, Icarus 106. 478 [16] Huebner et al., 1992, Astrophysics and Space Science.
How to cite: Kloos, J., Moores, J., and Schorghofer, N.: Monte Carlo simulations of the expospheric transport of cometary volatiles on the Moon, Europlanet Science Congress 2020, online, 21 Sep–9 Oct 2020, EPSC2020-388, https://doi.org/10.5194/epsc2020-388, 2020.
Habitable conditions on Earth developed in a tight connection to the evolution of terrestrial atmosphere which was strongly influenced by atmospheric escape. In this study, we investigated the evolution of the polar ion outflow from the Earth’s open field line bundle starting from mid-Archean (three gigayears ago) and to present. We performed Direct Simulation Monte Carlo (DSMC) simulations and estimated upper limits on escape rates from the Earth's polar areas assuming the present-day composition of the atmosphere. We performed two additional simulations with lower mixing ratios of oxygen of 1% and 15% to account for the composition changes after the Great Oxydation Event (GOE).
According to our estimates, the maximum loss rates due to polar outflow was reached three gigayears ago equal to 3.3 x 1027 s-1 and 2.4 x 1027 s-1 for oxygen and nitrogen, respectively. We estimate the total maximum integrated mass loss equal to 39% and 10% of the modern atmosphere's mass, for oxygen and nitrogen, respectively. We also show that escape rates increase, if the oxygen mixing ratio is decreased (GOE simulations), which is due to reduced thermospheric cooling. According to these results, the main factors that governed the polar outflow in the considered time period are the evolution of the XUV radiation of the Sun and the atmosphere's composition. The evolution of the Earth's magnetic field plays a less important role. We conclude that although the atmosphere that has a present-day composition can survive the escape due to polar outflow from 3 gigayears ago and later, a higher level of CO2 between 3.0 and 2.0 Ga is likely necessary to reduce the escape.
How to cite: Kislyakova, K., Johnstone, C., Scherf, M., Holmström, M., Alexeev, I., Lammer, H., Khodachenko, M., and Güdel, M.: Earth’s polar outflow evolution from mid-Archean to present, Europlanet Science Congress 2020, online, 21 Sep–9 Oct 2020, EPSC2020-200, https://doi.org/10.5194/epsc2020-200, 2020.
Introduction
Venus Global Climate Models (VGCM) are powerful tools to investigate the amount of data recently acquired by Venus Express (VEx) and Akatsuki missions, as well as from ground-based telescopes. Our understanding of the Venusian climate has increased with recent progresses with these models. VEx observations revealed a more variable atmosphere than expected, in particular in the “transition” region (~70-120 km) between the retrograde superrotating zonal flow (RSZ) and the day-to-night circulation. This region exhibits latitude and day-to-day variations of temperature up to 80 K above 100-km at the terminator, and apparent zonal wind velocities measured around 96-km on the Venus nighttime highly changing in space and time. Those variations are not fully explained by current 3D models and specific processes (e.g. gravity wave (GW) propagation, thermal tides, large scale planetary waves) responsible for driving them are still under investigation. The role of convectively generated GW and their impact on zonal wind and temperature in the region of aerobraking can be explored with an update version of the Institut Pierre-Simon Laplace (IPSL) VGCM, thanks to the inclusion of a stochastic non-orographic GW parameterization based on the Earth GCM. A vertical coupling between the cloud level and the thermosphere generated by GW, modulated and periodically filtered by the oscillation of the background zonal wind associated with the Kelvin wave was recently suggested in Nara et al.2020. This mechanism can partially explain the observed variation of oxygen UV airglow in the dayside (Navarro et al.in preparation).
The IPSL VENUS GCM: data-model validation
This climate model has been used recently to investigate all regions of the Venusian atmosphere, as it covers the surface up to the thermosphere (150 km) (Gilli et al.2017; Garate-Lopez&Lebonnois2018, Navarro et al.2018). It involves a photochemical module with a simplified cloud scheme that enables the study of the composition and the coupling with the upper atmosphere, where non-LTE, EUV heating processes, molecular diffusion, play a crucial role on the thermal balance. Below 100-km, the infrared energy budget is computed based on a Net Exchange Rate formalism. The cold collar structure has been modelled when taking into account the latitudinal distribution of the cloud structure. Recent improvements in non-LTE parameterization included in the IPSL-VGCM allow a better representation of the thermal structure of Venus above 90-km. Overall, our model is able to simulate well the succession of warm and cool layers above 80-km, which is one of remarkable feature that has been systematically detected, but the intensity of the local nighttime mesospheric warm layer is about 20 K larger between 90-km and 120-km altitudes, approximately. CO2, CO and O densities above 100-km are also in good agreement with available dataset in term of trend and order of magnitude (Gilli et al.in preparation). The region between the cloud tops and 100-110 km is still puzzling, not only because of more substancial variability, especially at nighttime in contrast with a dynamically quieter daytime, but also because our model is reproducing quite well SOIR/VEx profiles at the evening (ET) but not at the morning terminator (MT), especially at low latitudes (Fig.1). Possible interpretations of those discrepancies will be discussed (e.g wind asymmetries produced by GW drag, fine-tuning of the current parameterization,consequence of the lower’s atmosphere superrotation extending up to 95-km).


Figure 1: Example of comparison of simulated CO densities by the IPSL-VGCM (green dashed line) with retrieved measurements (blue dots) and standard deviations at equatorial latitudes (0-30N), extracted from the Venus Atmosphere from SOIR measurements at the terminator (VAST) (Vandaele et al.2016). Top: Morning terminator. Bottom: Evening terminator.
Can we explain the observed variability by mean of 3D simulations?
Diurnal and latitudinal distribution of CO and O, together with O2 airglow are used to shed a light on the dynamics in a region poorly constrained by wind measurements and where direct measurements of winds are not possible. Several observations demonstrated that both RSZ and subsolar-to-antisolar (SS-AS) flow affect the global distribution of CO and other light species like NO/O2 airglows (e.g. Lellouch et al.2008, Moullet et al.2012, Gerard et al.2014) at mesospheric altitudes (70-120 km). The majority of Doppler winds retrieved at mesospheric and lower thermospheric altitudes (e.g. Clancy et al.2015) also suggested the presence of a substantial retrograde zonal flow at altitudes above 90 km.
We focus here on CO which, as other light species, is expected to pile up at the converging stagnation point of the wind field (i.e. where the horizontal velocity converges to zero). This point is at the anti-solar point for pure SS-AS flow and displaced toward the morning terminator when a retrograde zonal flow is added. The position of the maximum and its magnitude depend on the relative values of equatorial velocity and a maximum cross-terminator velocity. Our simulations indicate that a weak retrograde wind is present in the mesosphere, up to about 120-km, producing the CO bulge displacement toward 2h-3h in the morning. Moreover, simulations show periodic events of transient, local maxima of O2 nightglow at high latitudes, in agreement with observations (Hueso et al.2008, Soret et al.2014). These events are caused by the 5-day period Kelvin wave when it passes through the nightside, ejecting recombined molecular oxygen poleward.
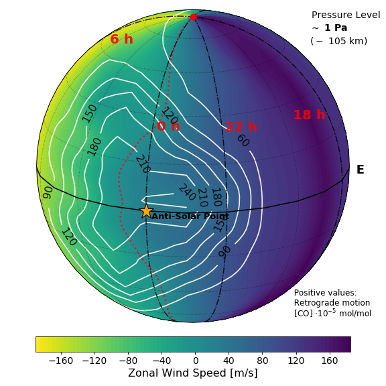
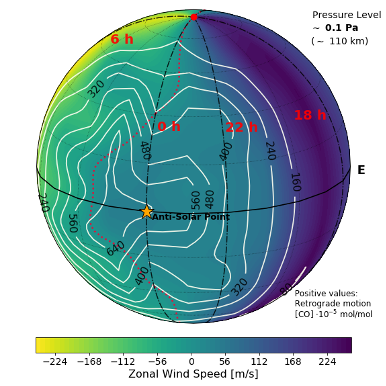
Figure 2: 3D maps of simulated CO volume mixing ratio (contour line) and zonal wind (color) by the IPSL-VGCM at two pressure layers: 1 Pa (top panel) and 0.1 Pa (bottom panel). The star indicates the Anti-Solar point. Dotted lines represent the region were horizontal wind converges to zero.
Acknowledgments: GG was supported by European Union′s Horizon 2020 research and innovation programme under the Marie Sklodowska-Curie grant agreement No.796923, and by FCT through the research grants UIDB/04434/2020,UIDP/04434/2020,P-TUGA PTDC/FIS-AST/29942/2017
References:
Garate-Lopez & Lebonnois 2018, Icarus 314,1-11; Gilli et al.2017, Icarus 281,55-72; Navarro et al.2018,Nature Geosci. 11,478-49; Nara et al.2020, JGR(Planets), 125,E006192; Clancy et al.2015,Icarus, 254,233-258; Moullet et al.2012,Vol 546,12pp;Lellouch et al.2008,PSS, 56,1355-1367; Vandaele et al. 2016,Icarus 272,48-59; Hueso et al. 2008,JGR,Vol.113;Soret et al. 2014,Icarus,217, 849-855; Gerard et al.2014,Icarus 236,902-103
How to cite: Gilli, G., Navarro, T., Lebonnois, S., Quirino, D., Silva, V., Lefevre, F., and Schubert, G.: Venus upper atmosphere revealed by a GCM: Temperature, CO, O2 and O distribution in the puzzling transition region, Europlanet Science Congress 2020, online, 21 Sep–9 Oct 2020, EPSC2020-353, https://doi.org/10.5194/epsc2020-353, 2020.
Abstract
We present simulations of the ancient Martian climate with the Resolving Orbital and Climate Keys of Earth and Extraterrestrial Environments with Dynamics (ROCKE-3D) general circulation model. We evaluate the efficacy of CO2-H2 and CO2-CH4 collision-induced absorption (CIA) in producing temperate conditions on Mars during the late Noachian-early Hesperian period near 3.7 Gya. We additionally study the fate of liquid water if it was on the surface during that time period in history.
Geologic evidence indicates that ancient Mars supported widespread surface liquid water approximately 3.5-4 Ga (e.g., [1], [2]). For nearly as long, climate modeling has attempted to find a self-consistent mixture of atmospheric gases with realistic atmospheric pressures that could support a hydrological cycle that is consistent with the geologic evidence (see [3] for an overview). Despite those efforts, substantial doubt remains about the feasibility of a “warm and wet” climate that could have existed for sufficient time to produce the geologic evidence during the period of the faint young Sun.
Recently, [4] and [5] (among others) have shown that H2, in combination with CO2 and CH4, can produce efficient CIA that provides substantial warming at plausible surface pressures (i.e., <2 bar, see [6]) with modest H2 mixing ratios. Using the CIA tables provided by [5], we evaluate the ability to generate temperate climactic conditions on ancient Mars using the ROCKE-3D GCM.
We conduct a series of ROCKE-3D GCM [7] simulations in two broad groups that we term “dry” and “wet.” The “dry” group consists of simulations that are run without open liquid water initialized on the surface, while the “wet” group is initialized with some amount of surface liquid water as either lakes or fully-dynamic oceans.
The dry simulations are conducted to evaluate what mix of pressure and gases can produce global surface temperatures above the freezing point of water. A range of pressures (from 0.5-2 bar) and H2 mixing ratio (0-10%) are evaluated. The wet simulations are all conducted with a surface pressure and gas mixture that is supportive of surface liquid water and is initialized with planetary water inventories from 10-500 m global equivalent layers.
Both modern topography and a plausible paleotopography (following [8]) is used to evaluate the effect of the Tharsis emplacement and true polar wander on the climate state. We employ a stellar spectrum that is appropriate for 3.8 Ga. All simulations are run until radiative and hydrological equilibrium are reached.
We find that global mean surface air temperatures are only above freezing for high pressure (1.5-2 bar) and/or H2 mixing ratios of at least 3%. Using modern topography, the high elevations of Tharsis Montes remain below freezing, even with 2 bar surface pressure and 10% H2. At 1 bar surface pressures, only the lowest elevation areas (e.g., Hellas Planitia) experience any above-freezing temperatures during the year, but remain below freezing on an annual average basis (Figure 1).
Including CH4 in the atmosphere (at 1%) produces a weak tropopause and distinct stratosphere (defined as warming temperatures with altitude), which also reduces cloud cover. Intriguingly, simulations without CH4 have increased cloud cover which serves as a more effective hygropause than the CH4-induced stratosphere, which may be relevant for ancient Martian water loss to space.
The wet simulations that employ modern topography show that water is cold-trapped onto the Tharsis plateau, leaving comparatively little water (relative to the initial planetary inventory) in an active hydrological cycle. What water is available falls as both rain and snow onto Tharsis and near the planetary topographic dichotomy. The initial water inventory is not predictive of the location or amount of precipitation. However, planetary obliquity is important, with 0° obliquity showing increased amounts of precipitation, with some of it falling in locations congruent with valley network formations (e.g., [2]) (Figure 2).
We will also present ongoing simulations with paleotopography and dynamic oceans.
Figure 1: Percent of sols with above freezing daily average surface air temperatures for 10 ROCKE3D simulations with surface pressures and CO2 and H2 mixing ratios identified in the panel title. All simulations incorporate dry soil. The black line encloses the areas with 100%.
Figure 2. Annual total liquid precipitation (mm) for 6 simulations initialized with surface liquid water as lakes as shown in the panel title.
References
[1] Masursky, H. (1973), An overview of geological results from Mariner 9, J. Geophys. Res., 78( 20), 4009– 4030, doi:10.1029/JB078i020p04009.
[2] Hynek, B. M., Beach, M., and Hoke, M. R. T. (2010), Updated global map of Martian valley networks and implications for climate and hydrologic processes, J. Geophys. Res., 115, E09008, doi:10.1029/2009JE003548.
[3] Wordsworth, R.D. (2016), The Climate of Early Mars, Annual Review of Earth and Planetary Science, 44, 381-408, https://doi.org/10.1146/annurev-earth-060115-012355.
[4] Ramirez, R., Kopparapu, R., Zugger, M. et al. Warming early Mars with CO2 and H2.Nature Geosci 7, 59–63 (2014). https://doi.org/10.1038/ngeo2000.
[5] Wordsworth, R.D., Kalugina, Y., Lokshtanov, S., Vigasin, A., Ehlmann, B., Head, J., Sanders, C., and Wang, H. (2017), Transient reducing greenhouse warming on early Mars, Geophys. Res. Lett., 44, 665– 671, doi:10.1002/2016GL071766.
[6] Warren, A. O., Kite, E. S., Williams, J.‐P., & Horgan, B. ( 2019). Through the thick and thin: New constraints on Mars paleopressure history 3.8 ‐ 4 Ga from small exhumed craters. Journal of Geophysical Research: Planets, 124, 2793– 2818. https://doi.org/10.1029/2019JE006178.
[7] Way, M.J., I. Aleinov, D.S. Amundsen, M.A. Chandler, T. Clune, A.D. Del Genio, Y. Fujii, M. Kelley, N.Y. Kiang, L. Sohl, and K. Tsigaridis, 2017: Resolving Orbital and Climate Keys of Earth and Extraterrestrial Environments with Dynamics 1.0: A general circulation model for simulating the climates of rocky planets. Astrophys. J. Supp. Series, 231, no. 1, 12, doi:10.3847/1538-4365/aa7a06.
[8] Bouley, S., Baratoux, D., Matsuyama, I. et al (2016). Late Tharsis formation and implications for early Mars, Nature 531, 344–34, https://doi.org/10.1038/nature17171.
How to cite: Guzewich, S., Way, M., Aleinov, I., Wolf, E., Del Genio, A., Tsigaridis, K., and Wordsworth, R.: Ancient Martian Climate with ROCKE-3D, Europlanet Science Congress 2020, online, 21 Sep–9 Oct 2020, EPSC2020-109, https://doi.org/10.5194/epsc2020-109, 2020.
We report on the cloud top morphology, scale-analysis of patterns, and dynamics of ‘‘textured” local dust storms on Mars observed at the edge of the North Polar cap during the Northern Hemisphere Spring Equinox, before aphelion, using images obtained by the Visual Monitoring Camera (VMC) [1] and High Resolution Stereo Camera (HRSC) [2] onboard Mars Express. VMC images were analyzed with tools described in previous works [3-4] and HRSC images were analyzed from map-projections.
The observations cover the period from March 3 to July 17, 2019, corresponding to the solar longitude range Ls = 350° - 55° (Martian Years 34 to 35). We observed the continuous formation of circumpolar dust patches, large frontal arc-shaped features, flushing dust storms, textured local dust storms and other forms of cloud activity at the edge of and inside the North Polar cap around latitude 60°N, a rich phenomenology typical of this season [5]. In this presentation we concentrate on the study of three textured local dust storms observed at the end of May and early June 2019.
The observed textured storms contained cellular structure and frontal-like banding, both indicative of organized active lifting within the storm [6-7]. The first storm was centered at about 185°E, 60°N and occupied a small area of 1.75x10⁵ km2. It showed three frontal bands with lengths ~ 1000 km and widths of 85 km separated by 40 km. In the interior of the storm a cellular pattern developed with a mean size of 50 km x 20 km. The second storm was centered at about 330°E, 60°N, occupied an area of 1.3x10⁶ km2 and moved zonally with velocities from 20 to 45 ms-1. A global cellular pattern covered this storm with cells of a mean size of 135 km x 60 km and inter-cell distances in the range 100-300 km. The third storm was centered at about 150°E, 65°N, occupied an area of 1.6-2.1x10⁵ km2 and moved zonally with a mean velocity of 38 ms-1. Its cellular pattern had a mean size of 70 km x 40 km. In all cases, the cell texture is anisotropic in the horizontal size (length/width, l/w~ 2) and their value is well above the atmospheric scale height (H ~ 8 km). Deep convection driven by buoyancy generated by the radiative heating of atmospheric dust is proposed to explain this structure.
References:
[1] Ormston, T., Denis, M., Scuka, D., & Griebel, H., An ordinary camera in an extraordinary location: Outreach with the Mars Webcam. Acta Astronautica, 69, 703-713 (2011)
[2] Jaumann, R., Neukum, G., Behnke, T., Duxbury, T. C., Eichentopf, K., Flohrer, et al., The high-resolution stereo camera (HRSC) experiment on Mars Express: Instrument aspects and experiment conduct from interplanetary cruise through the nominal mission. Planetary and Space Science, 55, 928-952 (2007)
[3] Sánchez-Lavega, A., Chen-Chen, H., Ordonez-Etxeberria, I., Hueso, R., del Rio-Gaztelurrutia, T., Garro, A., & Wood, S., Limb clouds and dust on Mars from images obtained by the Visual Monitoring Camera (VMC) onboard Mars Express. Icarus, 299, 194-205 (2018)
[4] Hernández‐Bernal, J., Sánchez‐Lavega, A., del Río‐Gaztelurrutia, T., Hueso, R., Cardesín‐Moinelo, A., Ravanis, E. M., Tivov, D., & Wood, S., The 2018 Martian Global Dust Storm over the South Polar Region studied with MEx/VMC. Geophys. Research Lett., 46, 10330-10337 (2019)
[5] Kahre, M. A., Murphy, J. R, Newman, C. E., Wilson, R. J., Cantor, B. A., Lemmon, M. T. & Wolff, M. J., The Mars Dust Cycle. In R. Haberle, R. T. Clancy, F. Forget, M. D. Smith and R. W. Zurek (Eds.), The Atmosphere and Climate of Mars (pp. 295-337). Cambridge, U.K. Cambridge University Press. (2017)
[6] Guzewich S. D., Toigo A. D., Kulowski L., Wang H., Mars Orbiter Camera climatology of textured dust storms, Icarus, 258, 1-13 (2018)
[7] Heavens N. G., Textured Dust Storm Activity in Northeast Amazonis–Southwest Arcadia, Mars: Phenomenology and Dynamical Interpretation, J. Atmos. Sci., 74, 1011-1037 (2017)
How to cite: Sanchez-Lavega, A., Garcia-Morales, J., Hernandez-Bernal, J., delRio-Gaztelurrutia, T., Hueso, R., Ravanis, E., Cardesín-Moinelo, A., Titov, D., Wood, S., Tirsch, D., Hauber, E., and Matz, K.-D.: Patterns in textured dust storms in Mars North Pole, Europlanet Science Congress 2020, online, 21 Sep–9 Oct 2020, EPSC2020-141, https://doi.org/10.5194/epsc2020-141, 2020.
1. Introduction
Dust plays a main role in the atmosphere of Mars: it has a direct impact on its thermal structure, and by absorbing and scattering the incoming solar radiation, it provides forcing to its dynamics [1]. Martian general circulation models (GCMs) and regional climate models employ two-stream approximation radiation codes to compute the internal radiation fields [2][3][4].
The objective of this work is to provide estimates of internal radiation field and heating rate differences that can be expected from two-stream codes in mesoscale dynamical models due to differences in the scattering phase function for dust aerosols. We discuss the implications in the characterisation of Mars’ dust cycle and its effects in its atmosphere and dynamics.
2. Model
The two-stream code evaluated in this work has been implemented in both GCM and mesoscale climate models e.g, [4][5][6], and it is compared with a discrete ordinates method radiation code (DISORT) using multiple streams [7].
The visible and infrared spectral regions are treated separately. The visible and near infrared (0.4 to 4.5 μm) is divided into 7 intervals, while the thermal infrared (4.5 to 1000 μm) is divided into 5 spectral intervals [2][4]. Absorption data for relevant gases are loaded from HITRAN [8] and transformed into correlated-k tables. Local and seasonal atmospheric profiles and the chemical composition are retrieved from LMD Mars Climate Database [3][9].
Dust aerosol particle optical properties are loaded from the MOPSMAP database [10] using wavelength-dependant properties obtained from [11]. Input particle physical properties (size, shape, etc.) and atmospheric dust loading for different scenarios are derived from [12][13], with dust vertical distribution following a Conrath-profile [3].
3. Methodology
Internal radiation fields and heating rates calculated with the two-stream approximation are compared with 4, 8, and 16-stream outputs from DISORT code, using detailed descriptions of dust aerosol particle phase functions [13].
4. Results
The heating rates for 3 cases with low (τ = 0.1), moderate (τ = 0.8), and high (τ = 1.5) atmospheric dust loading were calculated using the different radiation codes. For all these scenarios, the average differences between the 2, 4, and 8-stream codes with respect to the DISORT 16-stream calculations are of about 10%, 1% and 0.1%, respectively; being the performance of the implementation proportional to the number of streams used.
5. Conclusions
We are evaluating the influence of using DISORT multiple streams radiation code in regional dynamical models and its impact on the retrieved internal radiation fields and heating/cooling rates.
This is a work in progress and the latest results for a number of characteristics situations, including the study of local dust storm effects, and the influence of dust particle properties and its vertical distribution will be presented.
Acknowledgements
This work is supported by the Spanish project AYA2015-65041-P (MINECO/FEDER, UE), Grupos Gobierno Vasco IT1366-19, and Diputación Foral de Bizkaia – Aula EspaZio Gela.
References
[1] Gierasch, P.G., and Goody, R.M. (1972): J. Atmos. Sci., 29, 400-402
[2] Haberle, R.M., et al. (1999): J. Geophys. Res. 104(E13), 8957-8974
[3] Forget, F., et al. (1999): J. Geophys. Res. 104, 24155-24175
[4] Rafkin, S., and Michaels, T. (2019): Atmosphere 2019, 10 (12), 747, doi: 10.3390/atmos.10120747
[5] Toon, O.W., et al. (1989): J. Geophys. Res. 94 (D13), 16287-16301, doi: 10.1029/JD094iD13p16287
[6] Kahre, M.A., et al. (2008): Icarus 195, 576-597 doi: 10.1016/j.icarus.2008.01.023
[7] Stamnes, K., et al. (1988): Appl. Opt. 27, 2502-2509
[8] Rothman, L. S., et al. (2003): J. Quant. Spect. Rad. Tra., Vol.130, 4-50
[9] Millour, E., et al. (2015): EPSC Abstracts 10, EPSC2015-438
[10] Gasteiger, J., and Wiegner, M. (2018): Geosci. Model Dev. 11, 2739-2762, doi: 10.5194/gmd-11-2739-2018
[11] Wolff, M.J., et al. (2009): J. Geophys. Res. 114, E00D04, doi: 10.1029/2009JE003350
[12] Lemmon, M.T., et al. (2019): Geophys. Res. Lett. 46, doi: 10.1029/2019GL084407
[13] Chen-Chen, H., et al. (2019): Icarus 330, 16-29, doi: 10.1016/j.icarus.2019.04.004
How to cite: Chen-Chen, H., Pérez-Hoyos, S., and Sánchez-Lavega, A.: Study of radiative heating rates in the Martian atmosphere under different atmospheric dust loading scenarios, Europlanet Science Congress 2020, online, 21 Sep–9 Oct 2020, EPSC2020-296, https://doi.org/10.5194/epsc2020-296, 2020.
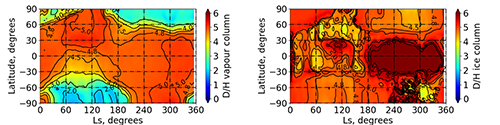
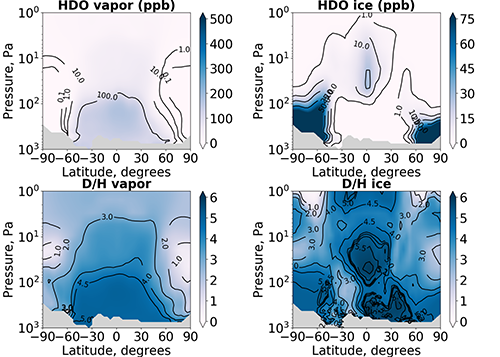
How to cite: Vals, M., Rossi, L., Montmessin, F., Forget, F., Millour, E., Olsen, K., Fedorova, A., Trokhimovskiy, A., and Korablev, O.: Modeling the HDO cycle with the LMD Mars GCM, Europlanet Science Congress 2020, online, 21 Sep–9 Oct 2020, EPSC2020-680, https://doi.org/10.5194/epsc2020-680, 2020.
The Nadir and Occultation for MArs Discovery (NOMAD) is a spectrometer suite onboard the ExoMars Trace Gas Orbiter (TGO), providing observations in the nadir, limb, and solar occultation modes since April 2018. UVIS, a single spectrometer unit within NOMAD spans the ultraviolet-visible range between 200 nm and 650 nm. It obtained ~ 4000 vertically resolved (< 1 km) solar occultation observations of the martian atmosphere for over a full Mars year (MY, 687 days) starting at MY 34 during late northern summer at Ls = 163°. Ozone (O3), a principal component of the martian atmosphere, is highly responsive to the incoming UV flux, and is a sensitive tracer of the odd hydrogen chemistry. Transmittance spectra returned by UVIS sampled the O3 Hartley band around 250 nm and provided unique insights into understanding the vertical, latitudinal and temporal behavior of O3. UVIS detected a high-altitude peak of O3 between 40 and 60 km that is mostly persistent between Ls = 340° and ~ 200° at polar latitudes, and is found to be highly dependent on latitude and season. We will present high-resolution results tracking the vertical, latitudinal, diurnal and seasonal evolution of the secondary peak of ozone for a full Mars year. In comparison, we will also provide O3 simulations from the GEM-Mars General Circulation Model (GCM) with the purpose of shedding light into understanding the photochemical processes that lead to the presence and disappearance of the high-altitude peak of atmospheric ozone.
How to cite: Khayat, A., Smith, M., Wolff, M., Daerden, F., Patel, M., Piccialli, A., Vandaele, A. C., Thomas, I., Mason, J., Willame, Y., Bellucci, G., Depiesse, C., and Lopez-Moreno, J. J.: On the detection of a high-altitude peak of atmospheric ozone by the NOMAD/UVIS onboard the ExoMars TGO, Europlanet Science Congress 2020, online, 21 Sep–9 Oct 2020, EPSC2020-362, https://doi.org/10.5194/epsc2020-362, 2020.
Three types of aurorae have been observed in the Martian atmosphere: the discrete aurora, the diffuse aurora (Schneider et al., 2015) and, more recently, the proton aurora (Deighan et al., 2018, Ritter et al., 2018). We focus here on the discrete aurora, which was discovered with the SPICAM instrument on board the ESA Mars Express spacecraft (Bertaux et al., 2005).
Discrete aurorae are generated by the precipitation of energetic electrons. They have been shown to be very localized in space, time and altitude (Leblanc et al., 2008, Gérard et al., 2015, Soret et al., 2016).
Their signature is characterized by the presence of several emissions in its spectrum: the CO (a3Π–X1Σ) Cameron bands between 190 and 270 nm, the CO (A1Π–X1Σ+) Fourth Positive system (CO 4P) between 135 and 170 nm, the (B2Σu+–X2Πg) doublet at 289 nm, the OI at 297.2 nm and the 130.4 nm OI triplet emissions (see figure 1).

Figure 1: Spectrum observed during a discrete auroral event with the SPICAM instrument on board the ESA Mars Express spacecraft (Bertaux et al., 2005).
More recently, the discrete aurora was also observed by the MAVEN-IUVS ultraviolet spectrograph. Schneider et al. (2019) confirmed that most of the discrete auroral observations occurred in the southern hemisphere, near the open-closed magnetic field line boundary in cusp-like structures, as shown by Leblanc et al. (2008) and Gérard et al. (2015).
In this study, the auroral emissions have been quantified and their altitudes have been estimated using limb data from the IUVS instrument. More than 10 000 orbits from 2014 to 2020 have been analyzed.
Each individual spectrum acquired by MAVEN-IUVS was automatically compared to a reference auroral spectrum. Only the spectra with a high correlation coefficient were retained for a manual confirmation.
Auroral signatures were thus found in more than 50 different orbits.
Synthetic spectra of the emissions produced during an aurora have then been scaled to the observed spectra in order to quantify their intensities. The altitudes of tangent points were also retrieved from the limb observations.
We confirm previous finding from Mars Express (Bertaux et al., 2005, Soret et al., 2016): in discrete aurorae, the CO Cameron bands emission layer is located between 105 and 165 km.
We also find that the CO Cameron bands intensity varies linearly with the CO2+ UVD intensity.
These results are of a great importance to model and understand the production mechanisms of a discrete aurora on Mars. The MAVEN Solar Wind Electron Analyzer (SWEA) measurements can be used to estimate the electron energy needed to produce a discrete auroral event.
References:
Bertaux J.-L. et al., 2005, Discovery of an aurora on Mars, Nature 435, 790–794, https://doi.org/10.1038/nature03603
Deighan J. et al., 2018, Discovery of a proton aurora at Mars, Nature Astronomy, vol. 2, 802-807, https://doi.org/10.1038/s41550-018-0538-5
Gérard J.-C. et al., 2015, Concurrent observations of ultraviolet aurora and energetic electron precipitation with Mars Express, J. Geophys. Res. Space Physics, 120,6749–6765, https://doi.org/10.1002/2015JA021150
Leblanc F. et al., 2008, Observations of aurorae by SPICAM ultraviolet spectrograph on board Mars Express: Simultaneous ASPERA-3 and MARSIS measurements, J. Geophys. Res., 113, A08311, http://dx.doi.org/10.1029/2008JA013033
Ritter B. et al., 2018, Observations of the proton aurora on Mars with SPICAM on board Mars Express, Geophysical Research Letters, 45, 612–619, https://doi.org/10.1002/2017GL076235
Schneider N. et al., 2015, Discovery of diffuse aurora on Mars, Science, 350, 1-5, https://doi.org/10.1126/science.aad0313
Schneider N. et al., 2019, MAVEN Remote Sensing and In Situ Observations of Discrete Aurora on Mars, AGU Fall meeting, SM42B-03, https://agu.confex.com/agu/fm19/meetingapp.cgi/Paper/506680
Soret L. et al., SPICAM observations and modeling of Mars aurorae, 2016, Icarus, 264, 398-406, https://doi.org/10.1016/j.icarus.2015.09.023
How to cite: Soret, L., Gérard, J.-C., Schneider, N., Jain, S., and Milby, Z.: Characteristics of the Martian discrete auroral emissions observed with MAVEN-IUVS, Europlanet Science Congress 2020, online, 21 Sep–9 Oct 2020, EPSC2020-224, https://doi.org/10.5194/epsc2020-224, 2020.
The OI 557.7 nm green line has been measured in the Martian dayglow for the first time with the UVIS visible-ultraviolet spectrograph on board ESA’s Trace Gas Orbiter (Gérard et al., 2020). The first observations started in April 2019 in a special mode where the spacecraft is tilted to observe the limb with the UVIS nadir channel (Vandaele et al., 2015, Patel et al., 2017). The instrument detected the presence of bright green dayglow emission on every of those observations. The main peak altitude is located near 80 km, and its intensity varies as a result of the changing distance from sun, the local time and latitude of the observations. A second, less pronounced, emission peak is observed near 110 km. Photochemical model simulations (Gkouvelis et al., 2018) used the MCD density distribution (Forget et al., 1999) have been made to understand the sources of this airglow emission. It is able to reproduce the altitude and the brightness of the airglow layer. It indicates that the green line dayglow on Mars is essentially produced by photodissociation of CO2 molecules by solar far ultraviolet radiation (Fox & Dalgarno, 1979). A fraction of the oxygen atoms is formed in the 1S metastable state that produces the green emission.
In this presentation, we describe additional dayside observations obtained since December 2019. For this purpose, the spacecraft has been used in a special mode where it is re-oriented so that the UVIS channel observed the sunlit limb (Lopez-Valverde et al., 2018). We analyse the observed limb profile variations and the changing altitude of the peak emission resulting from the variations of the pressure levels in the mesosphere (Gkouvelis et al., 2020). The measured intensities are compared with model calculations of the O(1S) density in the conditions of the observations. The ratio of ultraviolet spectral features relative to the oxygen emission also observed with UVIS will also be analysed.
REFERENCES
Forget, F. et al., J. Geophys. Res. 104(E10), 24155-24175 (1999).
Fox, J.L. & Dalgarno, J. Geophys. Res. 84(A12), 7315-7333 (1979).
Gérard, J.C. et al., Nature Astronomy, 1-4 (2020), https://doi.org/10.1038/s41550-020-1123-2
Gkouvelis, L. et al., J. Geophys.Res., 123(12), 3119-3132. (2018).
Gkouvelis, L. et al., Icarus, 341, 113666 (2020).
López-Valverde M. et al., Space Science Reviews, 214(1), 29 (2018).
Patel, M. R. et al., Applied optics, 56(10), 2771-2782 (2017).
Vandaele, A. C. et al., Optics Express, 23(23), 30028-30042 (2015).
How to cite: Gérard, J.-C., Aoki, S., Gkouvelis, L., Willame, Y., Depiesse, C., Thomas, I. R., Risctic, B., Vandaele, A. C., Daerden, F., Hubert, B., Mason, J., Patel, M., López-Moreno, J., López-Valverde, M., and Belluci, G.: Martian visible and ultraviolet dayglow: altitude, latitudinal and seasonal variations observed with NOMAD/TGO, Europlanet Science Congress 2020, online, 21 Sep–9 Oct 2020, EPSC2020-309, https://doi.org/10.5194/epsc2020-309, 2020.
Introduction: Stellar occultations have been used for decades to measure properties of neutral atmospheres of terrestrial planets, giant planets, icy bodies, and minor planets. Stellar occultations utilize the line-of-sight alignment of a star with a solar system body, which means targets can be predicted but not selected. The occultation of Epsilon Geminorum by Mars on April 8, 1976 remains the brightest stellar occultation by Mars to date.
This occultation was observed in three channels by the 91 cm telescope aboard the Kuiper Airborne Observatory, and published in 1977 just after the arrival of Viking 1 at Mars [1]. Here we present results of a re-analysis effort of the Epsilon Geminorum occultation, employing modern computational techniques and interpreting results in the context of recent discoveries about the Martian atmosphere.
Motivation and Aims: The original analysis made a number of assumptions and limitations that are no longer required today. These include favoring analytical expressions over exact solutions, omitting error propagation, and binning the original 4 ms time resolution to 0.1 s [1, 2]. Relaxing the latter is a fundamental tenant of this work—we believe this high-resolution observation contains detailed structure on the Martian atmosphere not identified in the original work.
Furthermore, we interpret our results in the context of the many orbital remote sensing and in situ measurements of Mars that have occurred in the decades since this observation [e.g., 3, 4, 5, 6]. Developments in modeling such as the Mars Climate Database [7] provide additional sources of comparison.
Methods: We use an improved computational procedure closely following the steps of the original work [8]. Data is first normalized such that flux varies from 1.0 at pre-occultation baseline to 0.0 during occultation.
Inversion begins at 0.9 flux level using boundary conditions from an isothermal model fit to the entire occultation profile [3]. We integrate time resolution into altitude resolution of occultation ray penetration depth and into differential refraction, which is then inverted following the procedure of [8] to determine neutral number density, temperature and pressure as a function of altitude. These result products are compared to the original work [1]. Error is carefully propagated by taking partial derivatives at each integration step [8].
Further investigation is performed into the small-scale wave structures present in the atmospheric profiles of temperature versus pressure. We use a Lomb-Scargle periodogram (a fast Fourier transform for unevenly sampled data) on the density perturbations to identify consistent wave structures. Wave amplitude is compared to a basic model of gravity wave propagation and to atmospheric static stability.
Results and Conclusions: Figure 1 shows the temperature versus pressure result of the immersion (ingress) portion of the light curve for channels 2 and 3 of the observations, compared to the original results and to the Mars Climate Database. Present in the profile is small-scale perturbations we sought to isolate and identify. We use a density excursion—the deviation of the density profile from an exponential model atmosphere (assuming hydrostatic equilibrium)—and further removed large-scale variations with a moving average.
The result is the red curve shown in Figure 2, showing a consistent wave growing in amplitude with altitude. The black curve in Figure 2 (left) is a simple model of internal gravity wave (buoyancy wave) propagation in a stratified atmosphere, including amplitude growth following [9]. The vertical wavelength of the wave was determined to be 5-6 km from periodogram results, with confidence between the 2σ and 3σ level.
These findings indicate that the small-scale waves detected in this dataset are likely internal gravity waves. A host of evidence from in situ and remote observations of the Martian atmosphere indicates the atmosphere is stable enough to support and does contain gravity waves at many altitudes. This re-analysis effort has indicated that old stellar occultation data taken with high cadence has the potential for further discovery. Additionally, the model fitting, inversion, and wave analysis techniques developed in this effort for Mars will be applied to new and old occultations by the Ice Giants, where lack of comparison data makes it the only reliable way of measuring the vertical structure of those planets. We encourage those with access to archival datasets to consider performing re-analysis.
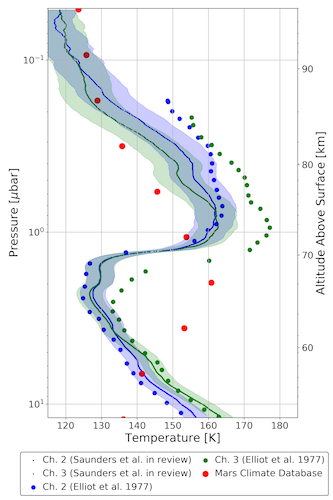
Figure 1. Temperature-pressure plot of the Martian atmosphere from the immersion (ingress) light curve. Re-analysis results in full resolution are compared to original profiles as well as the Mars Climate Database. The shaded regions represent uncertainty in temperature shifts of the entire profile because adjacent inversion results are highly correlated. Small-scale perturbations superimposed on the primary temperature inversion motivated detailed wave analysis. The pressure scale is exact for all comparison data but the altitude scale is approximate to within 15 km accuracy.

Figure 2. Extracted wave (red) overlaid with gravity wave model (black) and residual (right). The gravity wave model incorporates the peak wavelength of 5-6 km from the periodogram results and approximate fits of additional parameters, such as the amplitude growth following [9]. The fit is by eye and for illustrative purposes only. Residuals are given as data minus model, in percent.
References:
[1] J. L. Elliot et al. (1977) The Astrophysical Journal, 217, 661-679.
[2] R. G. French, J. L. Elliot, and P. J. Gierasch (1978) Icarus, 33, 186-202.
[3] A. G. Siddle, I. C. F. Mueller-Wodarg, S. W. Stone, & R. V. Yelle (2019) Icarus, 333, 12.
[4] A. Spiga, F. Gonzalez-Galindo, et al. (2012) Geophysical Research Letters, 39, L02201.
[5] S. Tellmann, M. Patzold, et al. (2013) Journal of Geophysical Research (Planets), 118, 306.
[6] J. E. Creasy, J. M. Forbes, & D. P. Hinson (2006)., Geophysical Research Letters, 33, L01803.
[7] E. Millour, F. Forget, A. Spiga, et al. (2019) Geophysical Research Abstracts, Vol. 21.
[8] J. L. Elliot, M. J. Person, & S. Qu (2003) The Astronomical Journal, 126, 1041.
[9] I. C. F. Mueller-Wodarg, D. F. Strobel, & J. I. Moses. (2008) Space Science Reviews, 139, 191.
How to cite: Saunders, W., Person, M., and Withers, P.: Re-Analysis of the 1976 Mars Occultation of Epsilon Geminorum: Detection of Gravity (Buoyancy) Waves, Europlanet Science Congress 2020, online, 21 Sep–9 Oct 2020, EPSC2020-494, https://doi.org/10.5194/epsc2020-494, 2020.
Our understanding of the evolution of water on Mars can be advanced through the provision of bounded constraints on the rates of water loss. To understand observed variations in the loss rate, the processes via which hydrogen escapes the martian atmosphere and coupling to the lower atmosphere water cycle also need to be explored. During the Mars Year (MY) 34 regional dust storm that occurred from LS = 320.6-336.5°, an increase in the Lyman alpha brightness (a proxy for hydrogen escape) was observed by the Mars Atmosphere and Volatile EvolutioN Imaging Ultraviolet Spectrograph (MAVEN/IUVS) instrument. Vertical profiles of water vapour can be retrieved from the Nadir and Occultation for MArs Discovery (NOMAD) and Atmospheric Chemistry Suite (ACS) instruments on the ExoMars Trace Gas Orbiter (TGO). Retrievals could not be made, however, at the time of peak activity observed by MAVEN/IUVS, during the MY 34 regional dust storm.
We investigate the global distribution of lower atmosphere water using data assimilation covering the time period leading up to and during the MY 34 regional dust storm. The data includes observations of water vapour from NOMAD/ACS (that constrain the initial global distribution of water), temperature profiles from ACS and the Mars Climate Sounder (MCS) on the Mars Reconnaissance Orbiter spacecraft, and dust column from MCS, which are combined with the Open University modelling group Mars Global Circulation model. During the time period of the MY 34 regional dust storm unobserved by ExoMars TGO we can still constrain the simulation using MCS temperature and dust column retrievals, a powerful advantage of multi-spacecraft data assimilation. This method provides the most realistic simulation possible of the chemical and dynamical structure of the lower atmosphere during the observed peak in MAVEN/IUVS observations.
We identify peak abundance of water vapour and hydrogen at altitudes above 70 km that are consistent with the peak emission observed by MAVEN/IUVS. Spatial variations in elevated water/hydrogen across the globe are linked to the underlying circulation patterns during the MY 34 regional dust storm.
How to cite: Holmes, J. A., Lewis, S. R., Patel, M. R., Aoki, S., Fedorova, A. A., Chaffin, M. S., Schneider, N. M., Kass, D. M., and Vandaele, A. C.: Lower atmosphere water/hydrogen activity during the MY 34 regional dust storm , Europlanet Science Congress 2020, online, 21 Sep–9 Oct 2020, EPSC2020-772, https://doi.org/10.5194/epsc2020-772, 2020.
The NOMAD instrument suite on the ESA-Roskosmos ExoMars Trace Gas Orbiter (TGO) observes the physical and chemical composition of the Martian atmosphere with highly resolved vertical profiles and nadir sounding in the IR and UV-vis domains. Vertically resolved profiles of, amongst other species, water vapor, HDO, ozone, CO, CO2, oxygen airglow, dust and clouds were obtained for more than one Martian year [1-5]. During its first year of operations, NOMAD witnessed the 2018 Global Dust Storm (GDS) during its onset, peak and decline. The redistribution of water vapor to high altitudes and latitudes observed during the GDS was explained using the GEM-Mars General Circulation Model (GCM) [6-8]. The GCM was driven by the dust optical depths for Mars Year 34 provided by [9]. The photolysis products of water vapor are a major driver for the atmospheric chemistry on Mars. As water vapor is redistributed over the atmosphere, it is expected to have considerable impact on many other species. GEM-Mars contains routines for atmospheric chemistry and here we present some results of the simulated impact of the GDS on atmospheric chemistry and on several of the observed species. GEM-Mars now also includes the simulation of HDO and the fractionation of water vapor upon cloud formation. The simulations will be compared with the vertical profiles of the D/H ratio obtained from NOMAD observations. The impact of the GDS on D/H can be estimated from these simulations.
References
[1] Vandaele, A. C. et al. (2019), Nature, 568, 7753, 521-525, doi: 10.1038/s41586-019-1097-3.
[2] Aoki, S. et al. (2019), J. Geophys. Res.: Planets, 124, 3482–3497. https://doi.org/10.1029/2019JE006109
[3] Gérard et al. (2020), Nature Astronomy, https://doi.org/10.1038/s41550-020-1123-2
[4] Villanueva et al., submitted.
[5] Korablev et al., 2020, in rev.
[6] Neary, L. and F. Daerden (2018), Icarus, 300, 458–476, https://doi.org/10.1016/j.icarus.2017.09.028
[7] Daerden, F. et al. (2019), Icarus, 326, 197-224, doi: 10.1016/j.icarus.2019.02.030.
[8] Neary, L. et al. (2020), Geophys. Res. Lett., 47, e2019GL084354. https://doi.org/10.1029/2019GL084354
[9] Montabone, L. et al. (2019), J. Geophys. Res.: Planets. doi: 10.1029/2019JE006111.
How to cite: Daerden, F., Neary, L., Villanueva, G., Aoki, S., Viscardy, S., Thomas, I., Vandaele, A. C., Liuzzi, G., Crismani, M., Khayat, A., Smith, M. D., Clancy, R. T., Wolff, M. J., Sandor, B. J., Whiteway, J. A., Mumma, M. J., Erwin, J., Willame, Y., and Piccialli, A. and the BIRA-IASB NOMAD team (continued): Simulating Mars D/H and atmospheric chemistry during the 2018 Global Dust Storm and comparing with NOMAD observations , Europlanet Science Congress 2020, online, 21 Sep–9 Oct 2020, EPSC2020-371, https://doi.org/10.5194/epsc2020-371, 2020.
This work presents ground-based wind velocity measurements of Mars during the 2018 global dust storm using Doppler velocimetry techniques based on observations made with the Ultraviolet and Visual Echelle Spectrograph (UVES) at the European Southern Observatory’s Very Large Telescope (VLT) facility in Chile.
This instrument’s high resolution ( R ∼ 100 000) allows for the dust cloud velocity to be measured, by computing the Doppler shift induced in the Fraunhofer lines (in the λ of 420-1100 nm) in the solar radiation that is back-scattered in the dust suspended in the Martian atmosphere, by the motion of that same dust, with an average error of approximately 5 ms-1. This allows us to sound Mars' atmosphere during a global dust storm and obtain latitudinal wind profiles and a first approach of a planetary wind map at the altitude level sounded, i.e. the altitude level where the optical depth reaches the unity.
The purpose of this research project is to successfully apply and validate a new approach to investigate Mars’ middle atmosphere wind velocities from ground-based observations. This is the first time that a Doppler velocimetry method based on observations made in the visible and ultraviolet wavelength range is employed to study the Martian atmosphere.
Global dust storms are complex stochastic events that can drastically alter the atmospheric dynamics. During such events dust can be lifted to heights above 50 km across all latitudes and longitudes, increasing the optical depth form on the sand consequently the heating rates. The increased heating rates strengthen the Martian circulation. These storms usually develop in the southern hemisphere during southern Summer and Spring (Ls≈180°-360°), however, the 2018 storm started developing in the northern hemisphere on Ls ≈ 185°.
Global dust storms are unique to Mars and are, perhaps, the most spectacular atmospheric event taking place anywhere in the Solar System. These storms induce thermodynamic responses throughout the whole atmosphere however, their occurrence is unpredictable and shows inter-annual variability and despite the massive development our understanding of Mars has suffered over the last 50 years, these storms are still viewed as stochastic events and the issue of their year-to-year variability remains largely unresolved.
One could see the evidence that Global dust storms do strengthen the atmospheric circulation, however, due to the low mass of the Martian atmosphere, the winds carry little momentum. Their characterization is nonetheless crucial, as they are critical to the Martian climate, and is important to study the atmospheric role of the energy input due to the infrared radiation absorption by the dust grains while in atmospheric suspension.
These storms can lift enough dust into suspension to dramatically increase the opacity of the atmosphere for several months, as it was the case of the major global dust storm observed on 2018. Furthermore, recent findings suggest that such storms may have played an important role in Mars’ loss of water [3].
Global dust storms are the more complex and least understood events in what appertains to the dust cycle and perhaps even the whole climate. These events cover large fractions of the planet with optically thick dust (τvisible>3) can even envelop the entire planet.
Observations and Method: Unlike Venus, Mars’ atmosphere is very transparent in the visible and ultraviolet ranges and the radiation in those wavelength ranges that is back-scattered in the atmosphere is negligible which precludes the application of our method. However, during global dust storms, the opacity of the atmosphere increases and allows for the scattering of enough light in the suspended dust in the middle atmosphere for the application of our method to be feasible.
The wind velocities were retrieved using the Doppler velocimetry technique developed and fine-tuned for the case of Venus [14, 15, 16, 17].
The adaptation of our Doppler velocimetry method for the case of Mars atmospheric studies, took in account the geometry of our observations. Spherical geometry was used to locate the observations within the planet, as seen from Earth at the time of each observation, and compute the de-projection factors for each point of the slit and for each exposure, in order to de-project the radial Doppler velocities from the observer’s (Earth) line-of-sight.
The rotation velocity’s contribution to the overall Doppler shift was removed by computing and subtracting the rotation velocity at each point on Mars sounded by the spectroscopic slit, this was done for all the positions surveyed on Mars. The wind velocities retrieved from the motion of the dust particles in atmospheric suspension, during the 2018 Global Dust Storm on Mars, were computed and we will present the output of this work.
Results and Discussion: The scope of this work is to study the behaviour of Mars’ middle atmosphere during a global dust storm using ground-based observations made with VLT-UVES and Doppler velocimetry techniques for the first time, to complement observations of orbiter instruments. The success and validation of the application of this method to the atmosphere of Mars may provide a new way to investigate the Martian atmosphere during dust storms.
The main goal of this research line is therefore, to provide direct wind measurements using high resolution spectroscopy and Doppler velocimetry, based on Fraunhofer lines scattered at Mars’ dust hazes, which allows spatial wind variability studies and will make possible to obtain a latitudinal profile of the wind along the cited global dust storm and a wind map of the dust storm as a function of the latitude and local time over the planet as seen from Earth.
Acknowledgements: We acknowledge support from the Portuguese Fundação Para a Ciência e a Tecnologia (ref. PD/BD/ 128019/2016 and ref. PTDC/FIS-AST/29942/2017) through national funds and by FEDER through COMPETE 2020 (ref. POCI-01-0145 FEDER-007672).
References:
[1] Vandaele, et al., Nature, 568(7753), 521-525.doi:10.1038/s41586-019- 1097-3, 2019
[2] Machado, P., et al., Icarus, 221, 248- 261.doi:10.1016/j.icarus.2012.07.012, 2012
[3] Machado, P., et al., Icarus, 243, 249-263. doi:10.1016/ j.icarus.2014.08.030, 2014
[4] Machado, et al. Icarus, 285, 8- 26.doi:10.1016/ j.icarus.2016.12.017, 2017
[5] Gonçalves R., Machado P., et al., Icarus, vol 335, article 113418, 2020
How to cite: Machado, P., Valido, H., Cardesin-Moinelo, A., and Gilli, G.: Mars Atmospheric Wind Map Along the 2018 Global Dust Storm, Europlanet Science Congress 2020, online, 21 Sep–9 Oct 2020, EPSC2020-221, https://doi.org/10.5194/epsc2020-221, 2020.
Introduction: Mars’ winter atmosphere is characterized by a polar vortex of low temperatures around the winter pole, circumscribed by a strong westerly jet [e.g. 1]. These vortices are a key part of the atmospheric circulation and impact heavily on dust and volatile transport. In particular, they have a complex and asymmetrical (north/south) relationship with atmospheric dust loading [1]. Regional and global dust events have been shown to cause rapid vortex displacement [2,3] in the northern vortex, while the southern vortex appears more robust.
Suspended atmospheric dust aerosol is a crucial active component of Mars’ atmosphere, with significant radiative-dynamical effects through its scattering and absorption of radiation [5]. The exact nature of these effects depends on a variety of factors: aerosol optical depth is important, as are the specific radiative properties of the aerosol particles [6,7], and the vertical distribution of the dust itself [8].
Mars Global Dust Storms (GDS) are spectacular, planet-spanning events which dramatically increase atmospheric dust loading. The 2018 GDS was observed through its lifecycle by the Mars Climate Sounder (MCS) instrument aboard the Mars Reconnaissance Orbiter [9]; using data assimilation [10] to integrate MCS retrievals [11] with the LMD-UK Mars Global Circulation Model (MGCM) [12] therefore offers an opportunity to examine the effects of the GDS on the polar vortices, and the interplay between the factors described above. The reanalysis contains the MGCM’s best possible representation of the GDS geographical, temporal, and in particular vertical structure.
Model and assimilation scheme: We use the LMD-UK Mars Global Circulation Model (MGCM), which solves the meteorological primitive equations of fluid dynamics, radiative and other parameterised physics to calculate the state of the martian atmosphere [3,8]. The UK version of the MGCM possesses a spectral dynamical core and semi-Lagrangian advection scheme [13], and is a collaboration between the Laboratoire de Météorologie Dynamique, The Open University, the University of Oxford, and the Instituto de Astrofisica de Andalucia. The model was run at spectral spatial resolution T42 and a vertical resolution of 50 levels, the latter spaced non-linearly. The assimilation scheme used was a modified version of the Analysis Correction scheme developed at the Met Office, adapted for use on Mars [6].
Retrievals used: The retrievals used in this study are from the Mars Climate Sounder (MCS) instrument aboard the Mars Reconnaissance Orbiter (MRO) [4], which now has amassed over five full martian years’ worth of data. For this study, the assimilated MCS variables were temperatures, derived column dust optical depth (CDOD), and dust profiles. Temperature profiles extend from the surface to approximately 100 km, and dust profiles from as low as 10 km above the surface up to a maximum height of approximately 50 km. The retrieval version used is 5.2, a re-processing using updated 2D geometry [7]. This results in improved retrievals, especially in the polar regions.
Results: The 2018 GDS had large and asymmetric impacts on dynamics at both poles. This will be presented via changes in zonal winds and polar vorticity at both poles relative to a clear martian year, MY 30. The GDS provided a natural laboratory for testing the effects of equinoctial high dust loading on polar dynamics, allowing investigation of both how the polar atmosphere behaves in a clear year and under the case of extreme dust loading at this time of year. We present results on the effects of the GDS on both southern and northern polar dynamics, with implications for tracer transport.
Discussion: The 2018 GDS dataset allows the opportunity for investigation of the polar dynamical effects of that specific event, the first fully observed by MCS. The polar vortices and associated zonal jets act as a barrier for cross-vortex tracer transport; their weakening can therefore allow dust to be transported onto the seasonal CO2 ice caps. Understanding how these barriers work is therefore important for understanding the evolution of Mars’ past climate: the Mars’ ice caps contain a record of past dust deposition [e.g. 8].
Upcoming retrievals from the ExoMars 2016 Trace Gas Orbiter and its NOMAD spectrometer suite [9] will allow for further investigation of tracer transport and an opportunity to both cross-validate and jointly assimilate NOMAD and MCS data, including over a range of martian local times, which will enable investigation of the diurnal cycles of tracer transport and atmospheric dynamics at the poles.
Acknowledgements: PMS acknowledges support from the UK Science and Technology Facilities Council under STFC grant ST/N50421X/1 and The Open University in the form of a PhD studentship. SRL, MRP and JAH also acknowledge the support of the UK Space Agency and STFC under grants ST/R001405/1, ST/S00145X/1 and ST/P001262/1 and STFC under ST/P000657/1. The authors are particularly grateful for ongoing collaborations with Dan McCleese, David Kass and the MCS team (NASA-JPL) and with Peter Read (Oxford) and François Forget and colleagues (LMD/CNRS Paris).
References: [1] Waugh, D. W. et al (2016) J. Geophys. Res. Planets, 121, 1770-1785. [2] Guzewich, S. D. et al (2016) Icarus, 278, 100-118. [3] Mitchell, D. M. et al (2015) Q.J.R. Meteorol. Soc., 141, 550-562. [4] McCleese D. J. et al (2010) J. Geophys. Res., 115(E12016). [5] Gierasch P. J. and Goody R. M. (1972) J. Atmos. Sci., 29(2), 400-402. [6] Turco R. P. et al (1984) Scientific American, 251(2), 33-43. [7] Madeleine J.-B. et al (2011) JGR (Planets), 116 (E11010). [8] Tanaka, K. L. (2000), Icarus, 144(2), 254-266. [9] Patel, M. R. et al (2017), Appl. Opt., 56(10), 2771-2782.
How to cite: Streeter, P., Lewis, S., Patel, M., and Holmes, J.: Impacts of the 2018 Global Dust Storm on martian polar vortex dynamics, Europlanet Science Congress 2020, online, 21 Sep–9 Oct 2020, EPSC2020-894, https://doi.org/10.5194/epsc2020-894, 2020.
Abstract
By assimilating temperature and dust data from the Mars Climate Sounder (MCS) and Atmospheric Chemistry Suite (ACS) instruments into a Mars Global Circulation Model (MGCM), we demonstrate that super-rotation in the Martian atmosphere doubled for the majority of the global dust storm period in Mars year (MY) 34, as compared to the same period in MY 33. During this period, the tropical band was dominated by a strong super-rotating jet that extended to 60 km. Our findings illustrate how dust events can significantly alter Martian tropical wind profiles away from climatology, and they underscore the need to better understand and constrain the dynamical processes that drive these phenomena.
Background
Super-rotation is a dynamical phenomenon in which the total axial angular momentum of a planetary atmosphere exceeds its pure solid-body component [1]. Super-rotation is commonly observed on slowly rotating bodies such as Venus and Titan, and often entails the presence of a westerly jet in the equatorial region [2].
Modelling studies indicate that super-rotation is also present in the Martian atmosphere [3]. The strength of super-rotation on Mars is modulated by the amount of dust in the atmosphere: this is due to dust-driven enhancement of the diurnal thermal tides, which then induce westerly acceleration in the tropics. This effect is most substantial during global dust storms, when large quantities of dust are lifted into the atmosphere.
Methods
The MGCM used at the Open University (OU) is the UK version of the Laboratoire de Météorologie Dynamique (LMD) MGCM, using a spectral dynamical core and a semi-Lagrangian transport scheme [4,5], and with physical parameterizations developed in collaboration between the LMD, the OU, the University of Oxford, and the Instituto Astrofísica de Andalucía [6]. The data assimilation scheme used is a version of the Analysis Correction scheme [7], modified for application to the Martian atmosphere [4].
We assimilated two Martian years for comparison: MY 34, which featured a global dust storm between Ls 180°-240°; and MY 33, a year that did not feature any major dust events. The observational datasets used in the assimilation were retrieved temperature profiles and dust column products from MCS, a limb sounder aboard the Mars Reconnaissance Orbiter (MRO) [8], and retrieved temperature profiles from the ACS spectrometers aboard the ExoMars Trace Gas Orbiter [9] (available for the second half of MY 34).
Results
We calculated the variation of the global super-rotation index S against solar longitude for the two Mars years. The index S is defined as the ratio between the atmospheric and solid-body components of the total axial angular momentum of the atmosphere, minus one [1,3]. Positive values of S indicate super-rotation. We found that the atmosphere of Mars was in a state of global super-rotation for much of the year. The super-rotation had a semi-annual structure, with peaks at equinoxes and troughs at solstices. Most strikingly, we found a prominent peak in S during the dust storm period of MY 34, indicating strong super-rotation with a maximum value that was twice as large as the reference MY 33 value in the same period.
We also calculated a local super-rotation index, s, to investigate the spatial distribution of super-rotation. s is a three-dimensional field in time, latitude and height, and is defined as the ratio of the specific zonal mean axial angular momentum of an air parcel at that location to the specific axial angular momentum of an air parcel at rest at the equator, minus one [3]. Calculations of s during the onset phase of the dust storm (LS 180°-210°) show that the tropical latitude band was dominated by a strong and deep super-rotating jet during this period. The jet height extended to around 60 km in altitude, with wind speeds of 30-50 m/s between altitudes of 10-30 km.
Future work will focus on understanding and constraining the dynamical processes that drive the enhancement of super-rotation during global dust storms.
Acknowledgements
KR, SRL, JAH and MRP acknowledge the support of the UK Space Agency under the following grants: ST/R001405/1 (KR, SRL, MRP), ST/S00145X/1 (JAH, SRL, MRP), and ST/P001262/1 (SRL, MRP). SRL and MRP also acknowledge the support of the UK Science and Technology Facilities Council (STFC) under grant ST/P000657/1. PMS acknowledges the support of the STFC under grant ST/N50421X/1, and the Open University in the form of a PhD studentship.
References
[1] Read, P.L.: Super-rotation and diffusion of axial angular momentum. II. A review of quasi-axisymmetric models of planetary atmospheres, Q. J.R. Met. Soc, 112, 253-72, 1986.
[2] Read, P.L. and Lebonnois, S.: Superrotation on Venus, on Titan, and Elsewhere, Annu. Rev. Earth Pl. Sc, 46, 175-202, 2018.
[3] Lewis, S.R. and Read, P.L.: Equatorial jets in the dusty Martian atmosphere, J. Geophys. Res, 108, 534, 2003.
[4] Lewis, S.R. et al.: Assimilation of thermal emission spectrometer atmospheric data during the Mars Global Surveyor aerobraking period, Icarus, 192, 327-347, 2007.
[5] Newman, C.E. et al.: Modeling the Martian dust cycle, 1. Representations of dust transport processes, J. Geophys. Res, 107, 5123, 2002.
[6] Forget, F. et al.: Improved general circulation models of the Martian atmosphere from the surface to above 80km, J. Geophys. Res, 104, E10, 24155-24175, 1999.
[7] Lorenc, A. C. et al.: The Meteorological Office analysis correction data assimilation scheme, Q. J. R. Met. Soc, 117, 497, 59-89, 1991.
[8] McCleese, D. J. et al.: Structure and dynamics of the Martian lower and middle atmosphere as observed by the Mars Climate Sounder: Seasonal variations in zonal mean temperature, dust, and water ice aerosols, J. Geophys. Res, 115, E12016, 2010.
[9] Korablev, O. et al.: The Atmospheric Chemistry Suite (ACS) of Three Spectrometers for the ExoMars 2016 Trace Gas Orbiter, Space Sci. Rev, 214, 7, 2018.
How to cite: Rajendran, K., Lewis, S. R., Holmes, J. A., Streeter, P. M., Fedorova, A. A., and Patel, M. R.: A super-rotating equatorial jet during the 2018 Martian Global Dust Storm, Europlanet Science Congress 2020, online, 21 Sep–9 Oct 2020, EPSC2020-750, https://doi.org/10.5194/epsc2020-750, 2020.
The 2018 Global Dust Storm (GDS) has been observed on Mars from the surface and from orbit. Here we focus on the surface temperatures measured locally by REMS/MSL in Gale crater and column dust IR opacities observed globally by Mars Climate Sounder on-board Mars Reconnaissance Orbiter (MCS/MRO) (e.g. Montabone et al., 2020). Recent modeling efforts of the 2018 GDS highlight that climate models do not simultaneously capture both the evolution of surface temperatures and the decay rate of global column dust opacities, which suggests that significant changes in dust particle sizes may occur during the dust storm (e.g. Bertrand et al., 2020, Montabone et al., 2020). These models typically assume a constant lifted dust particle size—with size evolution occurring in the atmosphere but only because of gravitational sedimentation. For instance, simulations with sufficiently large particles sizes to yield reasonable decay/sedimentation rates also provide excessive radiation fluxes at the surface, with excessive surface temperatures during peak dust loading.
One possible way to improve the agreement between the simulations and the observations is to allow the dust particle sizes to change more significantly in time and/or space during the simulated GDS. Particle size evolution toward large radius during GDSs is supported by several observations (e.g. Elteto and Toon, 2010, Lemmon et al., 2019). Different mechanisms could take place during dust storms to shift the dust particle distribution towards a larger effective radius: (1) the lifted particle size at the surface could change due to different active reservoirs or due to depletion of small particles as the storm increases in intensity and (2) the particle size in the atmosphere could change more significantly due to Brownian coagulation (production of large particles by the collisions induced by Brownian motions of the particles in the gas and subsequent sticking together of small particles) and gravitational coagulation (accretion through sedimentation, Murphy et al., 1990, Jacobsen et al., 1999, Montmessin et al., 2002, Fedorova et al., 2014). Previous studies have explored the impact of coagulation processes and concluded that coagulation only affects smaller particles (<0.1 micron) and impacts dust opacities by only a few percent during dust storms (e.g. Murphy et al., 1990). However, these processes have never been explored with a full 3D GCM.
Here we use the NASA Ames Global Climate Model to investigate coagulation in 1D and in 3D during the 2018 Global Dust Storm. We will build our investigation upon the previous modeling of the GDS performed with a uniform lifted effective particle radius (Bertrand et al., 2020). That study revealed that the dust number density during the dust storm is 100 times higher than during non-storm conditions, and should thus favor coagulation processes. We will show how these mechanisms impact the particle size distribution during the GDS, the surface temperature, the evolution and the decay phase of the storm, and explore what possible scenarios could reconcile the different observations.
References
Bertrand, T., Wilson, R. J., Kahre, M. A., Urata, R., & Kling, A. ( 2020). Simulation of the 2018 Global Dust Storm on Mars Using the NASA Ames Mars GCM: A Multi‐Tracer Approach. Journal of Geophysical Research: Planets, 125, e2019JE006122. https://doi.org/10.1029/2019JE006122
Elteto, A., & Toon, O. B. (2010). The effects and characteristics of atmospheric dust during martian global dust storm 2001A. Icarus, 210(2), 589–611. https://doi.org/https://doi.org/10.1016/j.icarus.2010.07.011
Fedorova, A. A., Montmessin, F., Rodin, A. V., Korablev, O. I., Määttänen, A., Maltagliati, L., & Bertaux, J. L. (2014). Evidence for a bimodal size distribution for the suspended aerosol particles on mars. Icarus, 231, 239–260. https://doi.org/10.1016/j.icarus.2013.12.015
Jacobsen, M.Z., 1999. Fundamentals of Atmospheric Modeling. Cambridge University Press. 656.
Lemmon, M. T., Guzewich, S. D., McConnochie, T., de Vicente‐Retortillo, A., Martínez, G., Smith, M. D., et al. ( 2019). Large dust aerosol sizes seen during the 2018 Martian global dust event by the Curiosity rover. Geophysical Research Letters, 46, 9448– 9456. https://doi.org/10.1029/2019GL084407
Montabone, L., Spiga, A., Kass, D. M., Kleinböhl, A., Forget, F., & Millour, E. ( 2020). Martian Year 34 Column Dust Climatology from Mars Climate Sounder Observations: Reconstructed Maps and Model Simulations. Journal of Geophysical Research: Planets, 125, e2019JE006111. https://doi.org/10.1029/2019JE006111
Montmessin, F., P. Rannou, and M. Cabane, 2002: New insights into Martian dust distribution and water-ice cloud microphysics, J. Geophys. Res., 107(E6), 5037, doi:10.1029/2001JE001520
Murphy, J. R., Toon, O. B., Haberle, R. M., & Pollack, J. B., Numerical simulations of the decay of Martian global dust storms, Journal of Geophysical Research, , 95, p. 14629-14648, 1990.
How to cite: Bertrand, T., Kahre, M., Wilson, J., Wolff, M., Haberle, R. M., Montmessin, F., Urata, R., Hartwick, V., Kling, A., Brecht, A., Steakley, K., and Batterson, C.: Exploring changes in dust particles size distribution on Mars during 2018 Global Dust Storm with a 3D Global Climate Model , Europlanet Science Congress 2020, online, 21 Sep–9 Oct 2020, EPSC2020-518, https://doi.org/10.5194/epsc2020-518, 2020.
Please decide on your access
Please use the buttons below to download the presentation materials or to visit the external website where the presentation is linked. Regarding the external link, please note that Copernicus Meetings cannot accept any liability for the content and the website you will visit.
Forward to presentation link
You are going to open an external link to the presentation as indicated by the authors. Copernicus Meetings cannot accept any liability for the content and the website you will visit.
We are sorry, but presentations are only available for users who registered for the conference. Thank you.