
 2,3,4,3,5
- 1UPV/EHU, Escuela Ingernieria de Bilbao, Fisica Aplicada, Spain
- 2School of Physics & Astronomy, University of Leicester, Leicester, UK
- 3Jet Propulsion Laboratory, California Institute of Technology, Pasadena, CA 91109, USA
- 4Laboratoire de Météorologie Dynamique, Sorbonne Université, France
- 5Planetary Plasma and Atmospheric Research Center (PPARC), Tohoku University, Japan
1. Overview
Jupiter's banded structure undergoes remarkable global-scale disturbances that can completely change its appearance from the deep troposphere below the cloud deck (2-7 bar) to the stratosphere (~1 mbar). These events can alter Jupiter's cloud structure, aerosols, and temperature field through mechanisms that are not well understood, and provide relevant insights into Jupiter’s time-variable atmospheric dynamics. Characterizing Jupiter's atmospheric changes in the long-term is crucial to better understand the origin and nature of the planetary scale disturbances, distinguishing between seasonal or mechanical forcing, and enables further investigation of the coupling of Jupiter's belts and zones that could explain the presence of 'Global Upheavals' (Rogers, 1995). In this study, we will describe how Jupiter's temperatures and aerosols vary over long spans of time, from the top NH3 clouds to the stable mid-stratosphere, and we will show that although Jupiter's troposphere and stratosphere exhibit a large number dynamical phenomena, there exists quasi-periodic patterns that may aid in future predictions of planetary-scale changes to the banded structure.
2. Ground-Based Observations
Continued monitoring of Jupiter from ground-based observatories from the past 40 years has provided an unprecedented resource for understanding the cyclic/non-cyclic environmental changes in temperature, aerosols, and composition governing Jupiter’s dynamic atmosphere. More recently, ground-based observations have provided essential temporal, spectral and spatial resolution to support observations from the Juno spacecraft. Our study uses ground-based mid-infrared observations captured between 1983 and 2019 at wavelengths between 7.9 µm and 24.5 µm by 7 different instruments: the BOLO-1 (1983-1993), AT-1 (1983-1993), MIRAC (1993-1999), MIRLIN (1996-2003) and MIRSI (2003-2011) instruments mounted at the 3-m NASA Infrared Telescope Facility (IRTF) in Hawai'i; the VISIR (2006-2011, 2016-2018) instrument mounted at the 8-m Very Large Telescope (VLT) in Chile; and the COMICS (2005-2019) instrument on the 8-m Subaru Telescope in Hawai'i. Examples of Jupiter images at different wavelengths are given in Figure 1.
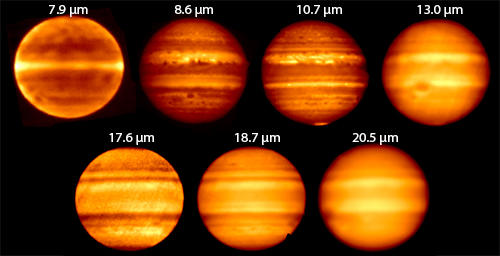
Figure 1. Examples of images of Jupiter captured by the MIRSI instrument at 7 different wavelengths.
3. Multi-Year Cycles of Variability
As mentioned above, Jupiter’s belts and zones endure dramatic global-scale changes over short-timescales, where belts expand, contract and even entirely disappear in a complex and turbulent way (e.g., Fletcher et al., 2017, doi:10.1002/2017GL073806). The most remarkable examples of this are the South Equatorial Belt (SEB, at 7°-17° S) fading and revival cycles (e.g., Sánchez-Lavega & Gomez, 1996, doi:10.1006/icar.1996.0067; Fletcher et al., 2017, doi:10.1016/j.icarus.2017.01.001), where the typically warm and dark belt at visible wavelengths transforms into a cold, cloud-covered whitish zone in timescales of months, remaining disturbed for years before energetic storms trigger the revival of the belt. A similar ‘revival’ process occurs semi-periodically at the North Temperate Belt (NTB, at 21°-28° N), where energetic convective storms rising from the water layer in the deep troposphere at this belt interact with the background flow producing a new low-albedo band over the southern half of the NTB (e.g., Sánchez-Lavega et al., 2017, doi: 10.1002/2017GL073421). At lower latitudes, the North Equatorial Belt (NEB, at 7°-17° N) is observed to expand northward in time intervals of 3 to 5 years, causing a gradual decrease in reflectivity (darkening) at the neighbouring North Tropical Zone (NTrZ, at 18°-21° N), typically originated from wave-like bulges of materials impinging on the NTrZ (e.g. Rogers, 1995; Fletcher et al., 2017, 10.1002/2017GL073383). Finally, Jupiter’s Equatorial Zone (EZ, within ±7° of the equator) experiences a rare 7-year cyclic disturbance, where the typically white (NH3 cloud-covered) and cold EZ displays a new 5-μm-bright (NH3 cloud-free) band encircling the planet south of the equator, accompanied by a reddish coloration at visible wavelengths (e.g., Antuñano et al., 2018, doi: 10.1029/2018GL080382; Rogers, 1995).
In this presentation, we will show zonal-mean brightness temperature maps spanning the period between 1983 and 2019 at 5 different wavelengths (7.9 µm, 8.6 µm, 10.7 µm, 18.7 µm and 20.5 µm) and between 1996 and 2019 at 8 wavelengths (same list plus 13.0 µm, 17.6 µm and 24.5 µm). We will describe the temporal and latitudinal variability of the brightness temperature at each of these wavelengths, looking for potential correlation/anticorrelation between changes at different belts that could help to reveal the processes underpinning the jovian global upheavals. We will also compare changes at different wavelengths to better understand the vertical extent of the global-scale disturbances in Jupiter’s banded structure.
4. Temperature and Aerosol Opacity: Variability
Zonal-mean radiance profiles at different wavelengths can be stacked together to form 5-point (7.9 µm, 8.6 µm, 10.7 µm, 18.7 µm and 20.5 µm) spectral image cubes between 1983 and 2019 and 8-point (the same plus 13.0 µm, 17.6 µm, and 24.5 µm) spectral image cubes between 1996 and 2019. These spectral image cubes can then be inverted independently using the radiative-transfer and retrieval code NEMESIS (Irwin et al., 2008, doi:10.1016/j.jqsrt.2007.11.006), to obtain crude estimations of stratospheric temperatures at 10-20 mbar (constrained by the 7.9 µm wavelength), upper-tropospheric (100-300 mbar) and mid-tropospheric (~500 mbar) temperatures (constrained by the 17.6 µm-24.5 µm and 10.7 µm, respectively), and tropospheric aerosol opacity at 400-600 mbar (constrained by the 8.6 µm wavelength).
Here, we will show stratospheric and tropospheric temperature and aerosol opacity maps between 1983 and 2019. We will describe the timescales of the variability observed in these maps by presenting a Lomb-Scargle analysis, and we will compare their periodicity to previously reported cyclic activity in Jupiter’s atmosphere, describing how temperature and aerosols vary during the planetary-scale disturbances. We will also compare the periodicity found at different belts, showing an NEB-SEB anticorrelation in the aerosol opacity and mid-tropospheric temperatures, and differences in the temperature field and aerosol opacity between hemispheres will be discussed. Finally, we will reveal a tropospheric-stratospheric coupling associated with Jupiter's Equatorial Stratospheric Oscillation.
How to cite: Antunano, A., Fletcher, L. N., Orton, G. S., Melin, H., Donnelly, P. T., Roman, M. T., Sinclair, J. A., and Kasaba, Y.: Cycles of Variability in Jupiter's Atmosphere from Ground-Based Mid-Infrared Observations, Europlanet Science Congress 2021, online, 13–24 Sep 2021, EPSC2021-134, https://doi.org/10.5194/epsc2021-134, 2021.