Europlanet Science Congress 2021
Virtual meeting
13 – 24 September 2021
Europlanet Science Congress 2021
Virtual meeting
13 September – 24 September 2021
OPS4
A new view of Jupiter, Saturn, and giant planets from the polar-orbiting Juno and Cassini spacecraft

OPS4

A new view of Jupiter, Saturn, and giant planets from the polar-orbiting Juno and Cassini spacecraft
Convener: Yasmina M Martos | Co-conveners: Arrate Antunano, Scott Bolton, Bertrand Bonfond, George Clark, Stavros Kotsiaros, Yamila Miguel
Fri, 17 Sep, 15:10–17:00 (CEST)

Session assets

Discussion on Slack

Oral and Poster presentations and abstracts

Chairpersons: Arrate Antunano, Yamila Miguel, Yasmina M Martos
Atmosphere: composition, dynamics
EPSC2021-173
|
solicited
Henrik Melin, Leigh Fletcher, Patrick Irwin, and Davide Grassi

The polar orbit of the Juno spacecraft provides an unprecedented view of Jupiter's atmosphere as it passes above the cloud tops every 53 days. The spectrum in the near infrared is dominated by reflected sunlight from aerosols (both condensate clouds and hazes) in the troposphere, as well as absorptions by the molecular species present. In addition, thermal emission longward of 4.5 µm provides access to the gaseous composition and aerosols below the top-most clouds.  Of particular importance in shaping the spectra are ammonia, phosphine and water, in addition to minor contributions from species such as arsine, germane and carbon monoxide. These regions also include emissions by ionospheric H3+. Here, we produce meridionally averaged zonal profiles from the Juno-JIRAM observations obtained during PJ3, which provide almost complete latitude coverage. To analyse the observations, we use the radiative transfer and retrieval code NEMESIS (Irwin et al., 2008), which has been updated to cover this wavelength with the latest line-data from HITRAN. Our aim is to analyse both the reflected-sunlight region (2-4 µm) and the thermal emission region (4-5 µm) simultaneously for the first time, building on the work of Grassi et al. (2019) and Grassi et al. (2020).  We investigate the appropriate set of aerosol and haze layers, starting with NH4SH at 1.3 bars, NH3 and 0.7 bars and two grey hazes: one in the troposphere and one in the stratosphere.  The optical properties of these aerosols are tested to find the optimal cloud structure to reproduce the full JIRAM spectrum. From the retrievals of the zonally-averaged spectra we investigate whether spatial variations of tropospheric composition are truly required to fit the data, comparing gaseous contrasts to the expected circulation patterns associated with Jupiter’s belts and zones.

How to cite: Melin, H., Fletcher, L., Irwin, P., and Grassi, D.: Zonal Profiles of Jupiter's Tropospheric Abundances from Near-Infrared Juno JIRAM Spectroscopy, Europlanet Science Congress 2021, online, 13–24 Sep 2021, EPSC2021-173, https://doi.org/10.5194/epsc2021-173, 2021.

EPSC2021-59
Glenn Orton, James Sinclair, Angela Burke, Takuya Fujiyoshi, Yasumasa Kasaba, Thomas Momary, Ryan Chan, and Leigh Fletcher

Motivation

Recent close-up views of Jupiter’s polar regions by NASA’s Juno spacecraft are providing a wealth of information about the dynamics and composition of Jupiter’s poles. We present thermal imaging observations from a series of repeated observations over fifteen years.  These images complement the observations made by the Juno spacecraft by observing in a spectral region not covered by its instrumentation, providing a near-global context for the narrow fields-of-view of Juno’s Microwave Radiometer and JunoCam instruments and providing a long term baseline to study Jovian atmospheric evolution. In this work, we specifically focus on the distinct thermal signatures of Jupiter’s northern and southern polar regions in both the troposphere and stratosphere. Although Cassini CIRS maps of Jupiter in 2000 could see this transition to coll polar vortices (e.g. Simon-Miler et al. 2006, Fletcher et al. 2016), the spatial resolution of the 8-m facility provides access to higher latitudes.

Data

We present thermal imaging from the Subaru Telescope using the COoled Mid-Infrared Camera and Spectrometer (COMICS, Kataza et al., 2000), between 7.8 and 25 μm. These data map temperatures in the upper troposphere (100 – 500 mbar) and stratosphere (20 – 0.5 mbar), and they constrain the distribution of tropospheric gases and condensate aerosols. This data set covers 2005 to 2020, allowing for the investigation of long-term trends, as well as comparisons with Juno and Juno-supporting observations at other wavelengths from 2016 onward.   

Preliminary Results

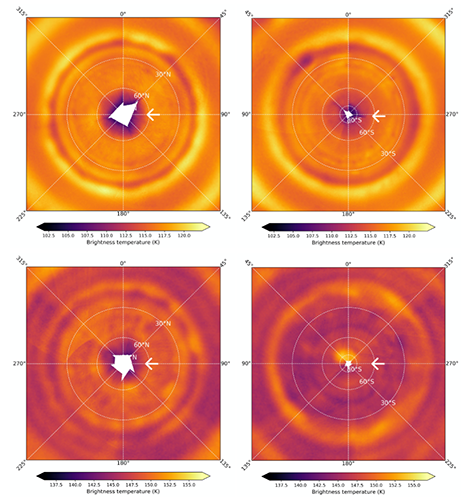
Figure 1 illustrates the composite polar maps of brightness temperature for each hemisphere using images measured in January, 2017. The retrieved temperatures in each latitude circle were derived from these data were binned over  μ (= cosine of emission angle) and the centre-to-limb variation was inverted using the NEMESIS radiative transfer code (Irwin et al., 2008). The results demonstrated that tropospheric temperatures exhibit a steep decline of at least 2 K poleward of 60°N-63°N (planetocentric), which we believe marks the boundary of a tropospheric polar vortex. A similar drop in temperature takes place more gradually over 54°S-64°S. The precise latitude of the inferred vortex boundary varies slightly between observations in both hemispheres. No seasonal trends in these latitude variations were observed. Stratospheric polar temperatures are affected by auroral-related heating at 140° – 230°W (System III) at high-northern latitudes (>55°N) and 330° – 90°W at high-southern latitudes (<70°S).  Away from regions affected by auroral heating, the boundaries of the vortex in the stratosphere appear to be similar to those in the troposphere, as stated above.  However, unlike the uniformly colder temperatures of the polar vortices in the troposphere, temperatures in the polar vortices in the stratosphere appear be the same or even warmer than lower latitudes, with the south polar region appearing warmer and the north polar region cooler in 2016-2020.  To first order, the zonally variable latitude boundaries of the polar vortices appear to be coincident with the boundaries of distinct regions of overlying hazes known as the polar caps, which are detected in reflected sunlight.  This suggests the dynamical boundaries are controlled by a Rossby wave and important contributions by these aerosols to the radiative balance within these polar regions (see Zhang et al 2015, Guerlet et al. 2020).

Figure 1. Polar projection of brightness temperatures in Jupiter from observations made by the Subaru/ COMICS instrument in January of 2017.  The top panels for the north (left) and the south (right) display a composite brightness temperature map for observations made with a filter centered at 7.80 µm that is sensitive to stratospheric temperatures near 10 mbar of atmospheric pressure. The bottom panels for the north (left) and south (right) are made similar with a filter centered at 17.65 µm that is sensitive to temperatures near 190 mbar of atmospheric pressure.

The location of polar-vortex temperature change is indicated by the arrows.  The cooler temperatures associated with the north polar vortex at 190 mbar (upper left) is the most prominent. There is essentially no meridional stratospheric temperature change detectable at high-southern latitudes (lower right); the compact brightening close to 0° W longitude is the result of auroral-related heating of the stratosphere (see, for example, Sinclair et al., 2021, and references therein).

References

Fletcher, L. N. et al. 2016.  Icarus. 278, 128-161.

Guerlet, S., et al. 2020. Icarus, 351:113935. doi: https://doi.org/10.1016/j.icarus.2020.113935. 129

Irwin, P. G. J. et al. 2008. J. Quant. Spectr. Rad. Transfer 109, 1136-1150. 

Kataza, H. et al. 2000. Proc. SPIE 4008, 114-1152

Simon-Miller, et al. 2006. Icarus 180, 98-112.

Sinclair, J. A. et al. 2019. Nature Astronomy 3, 607-613.

Zhang, X., R. A. 2016. Nature Communications 6:10231. Doi 10.1038/ncomms10231.

How to cite: Orton, G., Sinclair, J., Burke, A., Fujiyoshi, T., Kasaba, Y., Momary, T., Chan, R., and Fletcher, L.: Jupiter’s  Polar Vortices in the Mid-Infrared as Observed by Subaru/COMICS Prior to and During the Juno Mission, Europlanet Science Congress 2021, online, 13–24 Sep 2021, EPSC2021-59, https://doi.org/10.5194/epsc2021-59, 2021.

EPSC2021-190
|
ECP
Padraig Donnelly, Aymeric Spiga, Sandrine Guerlet, and Matt James

Abstract

The Saturn DYNAMICO Global Climate Model (GCM) is a high-resolution, multi-annual numerical simulation of Saturn’s atmospheric dynamics [1], combining a radiative-convective equilibrium model [2] and a hydrodynamical solver on an icosahedral grid. The model reproduces well the observed behaviour of jets and eddy-momentum transfer to the mean flow. Vortices arise naturally in the model over time but until now they have not been given direct consideration.

Analysis of large-scale vortices in the GCM is performed by investigating; (1) the long-term statistical distribution and organization of vortices and (2) the short-term evolution of individual discrete features. The metrics used in both studies provide direct comparison to observations, albeit with some methodological differences.

Long-term analysis

This study uses a vortex selection method similar to previous observational studies of Jupiter and Saturn [3, 4, 5, 6]. We seek to address whether the Saturn GCM replicates the hemispheric symmetries and asymmetries of vortices measured on Saturn by [4, 5, 6], as well as studying the formation conditions and long-term temporal evolution of vortex distributions.

Those studies collectively observe Saturn intermittently over roughly one half of a Saturnian year between northern winter and summer solstice. The Saturn GCM offers a much-expanded view with a timeseries spanning three full model years after spin-up (to be extended further by four years), with vortex measurements obtained at each seasonal peak.

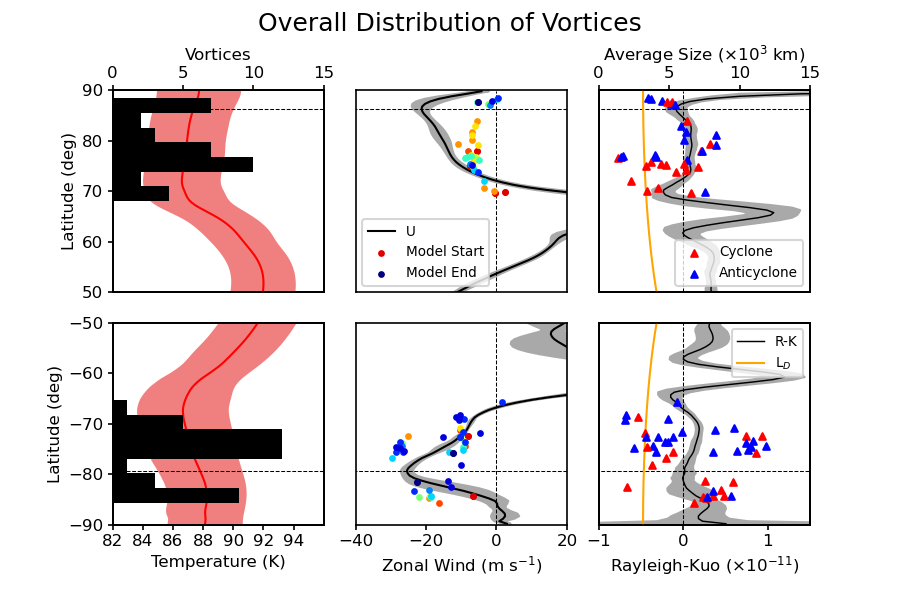
The model offers consistent spatial resolution across each global map throughout the timeseries (½-degree latitude-longitude bins corresponding to ~10-500 km/pixel from pole-equator). It constrains well the size and location of vortices, the horizontal wind field components and the magnitude and sign of horizontal vorticity.

Figure 1: Overall distribution of high-latitude vortices at ~700 mbar level for entire timeseries. (Left) histogram of vortex count with mean atmospheric temperature in red. (Centre) instantaneous zonal wind speed at the vortex centre with the mean zonal wind profile. (Right) average vortex size (average of major and minor axes) and vorticity sign with Rossby deformation radius (LD, orange) and the Rayleigh Kuo-criterion for barotropic instability (R-K, black). Mean profiles are averaged over the entire timeseries and shaded areas represent one standard deviation between all individual profiles.

Short-term analysis

This method is also applied to short term model outputs to investigate the appearance and disappearance, lifetime vs. size relationship, latitudinal and longitudinal drift and merging events. This analysis allows for the tracking of “ambiguous blobs” of vorticity with a cadence of 1 model day to study the thermal and dynamical conditions related to cyclogenesis and vortex evolution. This also provides insights into vortex behaviour and the proximity interactions with the local flow, jets, and other vortices.

Summary and Conclusions

The long-term analysis reveals that the Saturn GCM can largely replicate well the trends seen in previous observations. Some disagreement with the data can be explained methodologically. Otherwise, this presents avenues of future study like refinement of the method (employing a machine learning approach for vortex detection), inclusion of more detail in model (e.g., moist convection) and exploration of the primordial epoch of the model (for a deeper understanding of vortex behaviour in the absence of strong zonal circulations).

PTD and the France authors were supported by Agence Nationale de la Recherche (ANR) and the UK author acknowledges the Science and Technology Facilities Council (STFC).

References

[1] Spiga et al. (2020), Icarus, 335, http://dx.doi.org/10.1016/j.icarus.2019.07.011.

[2] Guerlet et al. (2014), Icarus, 238, https://doi.org/10.1016/j.icarus.2014.05.010.

[3] Li et al. (2004), Icarus, 172, https://doi.org/10.1016/j.icarus.2003.10.015.

[4] Vasavada et al. (2006), J. Geophys. Res. Planets, 111, https://doi.org/10.1029/2005JE002563.

[5] Trammell et al. (2014), Icarus, 242, https://doi.org/10.1016/j.icarus.2014.07.019.

[6] Trammell et al. (2016), J. Geophys. Res. Planets, 121, https://doi.org/10.1002/2016JE005122.


How to cite: Donnelly, P., Spiga, A., Guerlet, S., and James, M.: Statistical Analysis of Large-Scale Vortices in the Saturn DYNAMICO GCM, Europlanet Science Congress 2021, online, 13–24 Sep 2021, EPSC2021-190, https://doi.org/10.5194/epsc2021-190, 2021.

EPSC2021-57
John Rogers, Gerald Eichstädt, Candice Hansen, Glenn Orton, and Thomas Momary

Introduction

The polygons of cyclones at Jupiter’s poles – a pentagon at the south pole and an octagon at the north pole, each centred on another cyclone – were discovered at Juno’s first few perijoves by the JunoCam and JIRAM instruments [ref.1].  JunoCam images showed that the configurations remained stable for the next two years, up to perijove (PJ) 15 [ref.2].  Here we summarise their behaviour up to PJ33 in 2021 April; with the orbital period of 53 days, this covers 4½ years.

The data are polar projection maps produced from JunoCam images as described in [ref.2].

South polar cluster

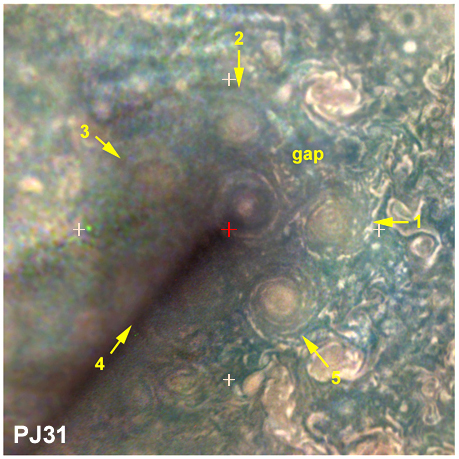
The five southern circumpolar cyclones (CPCs) surround the central South Polar Cyclone (SPC).  However, the SPC is not at the pole, but displaced by 1°-3° latitude, always into the same quadrant of longitude; and there is a gap between two of the CPCs (CPC-1 & 2), in the same quadrant [ref.2].

This asymmetry of the pentagon has persisted until now (Figures 1&2).  At PJ23 a smaller, compact cyclone was present in the gap, suggesting that the pentagon might be turning into a hexagon, but at PJ24 it was replaced by a chaotic cyclonic region and the asymmetric pentagonal structure was then restored.

We proposed [ref.2] that the cluster is a ‘vortex crystal’ whose configuration could be explained geometrically, if we adopt two conjectures: that the cyclones have a maximum size that prevents them growing larger or merging, and that the central cyclone must be smaller than the mean size of the others (as observed).  In this case, tight packing of the cyclones  produces a pentagon with a gap; and to pack the cyclones as close as possible to the pole, the cluster must be displaced towards the side of the gap, with the largest cyclone on the opposite side, as observed. 

Consistent with this model, as the cluster wanders somewhat, the gap tends to be widest when the SPC is furthest from the pole (Figure 3).  However, when the SPC longitude is greatest, it lies alongside CPCs-2 & 3 rather than CPCs-1 & 2; and at these times a gap opens up between CPCs-2 & 3, supplementing or replacing the gap between CPCs-1 & 2, as the model would predict.  

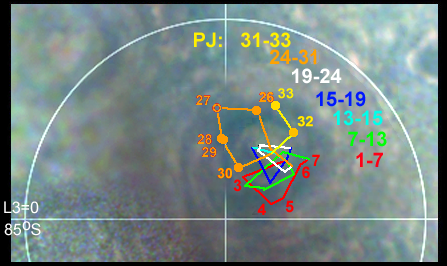
We noted [ref.2] that the wandering of the SPC appeared to be cyclic.  The record over 4½ years confirms this, showing that it performs loops with a period of 11.5 (±1) months (Figure 4).  The loops are of varying sizes, but show a progressive drift in one direction.  The rate of this drift of cycles has been very uneven, but if it were interpreted as precession of the cycles around the pole, the rate would be ~8° (±8°) per year.

Independently of this cyclic motion, the whole pentagon shows a very slow rotation about the SPC, which is stable in the long term: we estimated +1.5°/PJ from PJ1 to PJ15 [ref.2].  Up to PJ32, the average rotation is  +1.21 (±0.07) °/PJ, i.e. 8.3 (±0.5) °/yr.
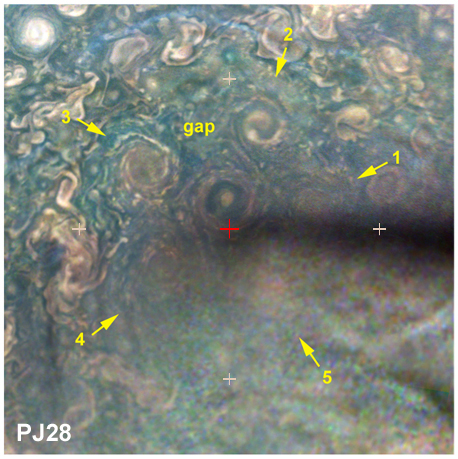
Figures 1 & 2.  Maps of the south polar cluster, down to 75°S at the edges.  CPCs are numbered.  The red cross marks the south pole, grey crosses 80°S; L3=0 to left.

Figure 3 (left).  Width of the gap in the pentagon. The angle between CPCs-1 & 2 as measured from the SPC, at each PJ, is plotted against the distance of the SPC from the pole (measurements of the cyclone centres). Brown points represent PJs when there was also a gap between CPCs-2 & 3, i.e. the angle between them was >76° (it is normally ~70°).

Figure 4 (right).  Position of the centre of the SPC (colour-coded by PJ) with respect to the south pole (white cross).  PJs in the first and latest cycles are numbered (except PJ1 & PJ31).  The SPC has been cycling anticlockwise throughout.  Background image from PJ25.


North polar cluster

The north polar octagon originally consisted of 8 CPCs of alternating morphology (‘filled’ and more diverse types), so it was best described as a ditetragon, centred on the North Polar Cyclone (NPC) [refs.1 & 2].  JunoCam has less complete coverage of the north polar region than of the south.  Nevertheless, about half the cluster is imaged at each PJ and over four PJs a high-quality map can be assembled (Figure 5).  And as the sun rose on the north pole, the NPC (previously observed only by JIRAM in 5-µm thermal emission) has become visible to JunoCam.

In 2017, the polygon was a ditetragon with one anticyclonic oval (AO) north of CPC-7.  

In 2018, one of the diverse CPCs gradually turned into a fifth ‘filled’ CPC; meanwhile, CPC-7 was increasingly displaced to lower latitude, away from the NPC, by the AO just north of it. By 2020, another AO had appeared on the opposite side, north of CPC-3.

In 2021 (from PJ32 onwards), the AO north of CPC-7 disappeared and CPCs-6 & 8 closed up together. So we discuss whether the cluster is still a (distorted) octagon, or now a heptagon, with CPC-7 excluded from it, joining several smaller ‘filled’-type cyclones as satellites of the polygon (Figure 5).  Moreover, the NPC is displaced by ~0.6-1.2° from the pole – possibly a response to the new asymmetry, comparable to the displacement of the SPC.

These rearrangements could be random, or temporary, or seasonal in response to the sun rising over the north pole.  JunoCam will continue to monitor the polar clusters during the extended mission.
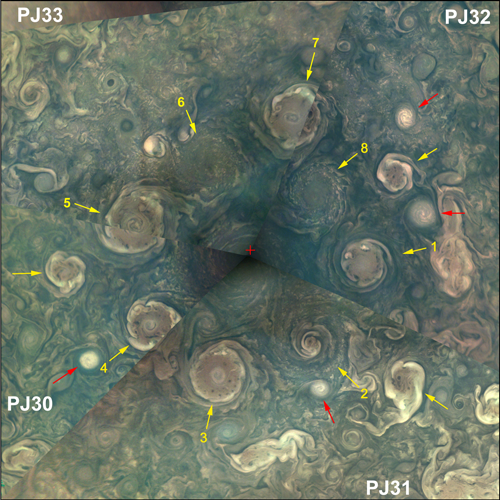
Figure 5:  Composite map of the north polar cluster, PJ30-PJ33, down to 75°N at the edges.  The PJ33 sector was rotated 7° and translated slightly.  CPCs are numbered.  Unnumbered arrows indicate smaller peripheral cyclones (yellow) and anticyclonic ovals (red).


Acknowledgements:

Some of this research was funded by NASA. A portion of this was distributed to the Jet Propulsion Laboratory, California Institute of Technology.

References:

1. Adriani et al., Nature 555, 216-219 (2018).

2. Tabataba-Vakili et al., Icarus 335 (2020), paper 113405 (online 2019).

How to cite: Rogers, J., Eichstädt, G., Hansen, C., Orton, G., and Momary, T.: Behaviour of Jupiter’s polar polygons over 4 years, Europlanet Science Congress 2021, online, 13–24 Sep 2021, EPSC2021-57, https://doi.org/10.5194/epsc2021-57, 2021.

EPSC2021-223
|
ECP
Bilal Benmahi, Thibault Cavalié, Thomas K. Greathouse, Vincent Hue, Rohini Giles, Sandrine Guerlet, Aymeric Spiga, and Richard Cosentino

Since 30 years, an equatorial oscillation of the temperature structure with a quasi-period of 4 years has been discovered in the atmosphere of Jupiter (Orton et al. 1991, Leovy et al. 1991). This phenomenon results in a complex vertical and horizontal structure of prograde and retrograde jets. However, the wind structure of the stratosphere in the equatorial zone of Jupiter has not been measured directly. It has only been inferred in the tropical region from the thermal wind balance using temperatures measured in the jovian stratosphere and the cloud-top wind speeds measured as a initial condition (e.g. Flasar et al. 2004). But temperatures are not constrained between the upper troposphere and the middle stratosphere from observations, limiting thus the accuracy of the thermal wind balance.

In this study, we derive self-consistently for the first time the structure of the tropical winds by utilizing wind and temperature observations all performed in the stratosphere. The wind speeds were obtained by Cavalié et al. (2021) at 1 mbar in Jupiter's stratosphere in both the equatorial and tropical regions in March 2017 with ALMA. The stratospheric thermal field was measured a few days before from the equator to the mid-latitudes with Gemini/TEXES (Giles et al. 2020). For the derivation of the wind, we use both the thermal wind equation (Pedlosky 1979) and the equatorial thermal wind equation (Marcus et al. 2019). In this paper, we will present and discuss our results.

How to cite: Benmahi, B., Cavalié, T., Greathouse, T. K., Hue, V., Giles, R., Guerlet, S., Spiga, A., and Cosentino, R.: The equatorial wind structure in Jupiter’s stratosphere from direct wind and temperature measurements with ALMA and IRTF/TEXES, Europlanet Science Congress 2021, online, 13–24 Sep 2021, EPSC2021-223, https://doi.org/10.5194/epsc2021-223, 2021.

EPSC2021-237
Thibault Cavalié, Bilal Benmahi, Thierry Fouchet, Raphael Moreno, Emmanuel Lellouch, Sandrine Guerlet, Aymeric Spiga, and Arielle Moullet

Saturn's cloud-top zonal winds have been measured since the Voyager days. Contrary to Jupiter, the jets are mostly prograde and with a noticeable broad super-rotating jet between 35°S and 35°N with peak velocities reaching ~450 m/s between 10°S and 10°N (e.g. Sanchez-Lavega et al. 2000). The Cassini mission revealed, during its Grand Finale, that these winds extend as deep as 8000 km below the clouds (Galanti et al. 2019). Above the tropopause, in the stratosphere, there has been no direct determination of the zonal winds, although thermal wind balance calculations have shown the signature of Saturn's semi-annual oscillation (SAO) in the tropical zone (Fouchet et al. 2008, Guerlet et al. 2011, 2018). These derivations lack an initial condition, in terms of wind speeds, located in the sensitivity zone of the temperature measurements. It thus remains unknown if the SAO jets alternate in direction as a function of altitude. In addition, more and more sophisticated general circulation models are being developed to constrain the dynamics of Saturn's stratosphere (Friedson & Moses 2012, Spiga et al. 2020, Bardet et al. 2021). These models now crucially need observational constraints.

We used the Atacama Large Millimeter/submillimeter Array (ALMA) to map Saturn's stratospheric zonal winds. We derive the zonal winds as a function of latitude from the Doppler shifts induced by the winds on the spatially and spectrally resolved spectral lines. In this paper, we will present and discuss our results.

How to cite: Cavalié, T., Benmahi, B., Fouchet, T., Moreno, R., Lellouch, E., Guerlet, S., Spiga, A., and Moullet, A.: First direct measurements of the zonal winds in Saturn's stratosphere, Europlanet Science Congress 2021, online, 13–24 Sep 2021, EPSC2021-237, https://doi.org/10.5194/epsc2021-237, 2021.

EPSC2021-402
|
ECP
|
solicited
James Blake, Leigh Fletcher, Arrate Antunano, Henrik Melin, Mike Roman, Glenn Orton, Naomi Rowe-Gurney, Oliver King, and Mael Es-Sayeh

Abstract

Thermal-infrared imaging observations spanning more than three decades from the VISIR instrument on the VLT, COMICS on Subaru and archived observations from NASA IRTF are used to characterise Saturn’s seasonal changes. Radiative transfer modelling (using NEMESIS [8]) provides the northern hemisphere temperature progression of the atmosphere over 15 years (2005-2020), both during and beyond the Cassini mission. Comparisons with a record of temperature variability from Cassini/CIRS measurements [10] establish the ability to replicate ground-based observations with CIRS temperature and composition inputs to NEMESIS. Imaging observations taken one Saturn year apart (1989-2018) show the limited extent of the interannual variability of Saturn’s northern hemisphere climate. Further comparisons from VISIR observations in 2017 and COMICS in 2020 show the seasonal progression of Saturn since the demise of Cassini. We characterize the seasonal atmospheric temperature progression of Saturn over the course of a full Saturnian year for the first time.

Introduction

With the culmination of Cassini's unprecedented 13-year exploration of the Saturn system in September 2017, and with no future missions currently scheduled to visit the ringed world, the requirement to build on Cassini's discoveries now falls upon Earth-based observatories. Mid-infrared observations have been used to characterise features such as the extreme temperatures within an enormous storm system in 2011 [1,6], the cyclic variations in temperatures and winds associated with the 'Quasi-Periodic Oscillation' (QPO) in the equatorial stratosphere [2] and the onset of a seasonal warm polar vortex over the northern summer pole [3].

Saturn's axial tilt of 27º subjects its atmosphere to seasonal shifts in insolation [4], the effects of which are most significant at the gas giant's poles. The north pole emerged from northern spring equinox in 2009 (planetocentric solar longitude Ls=0º), and northern summer solstice in May 2017 (Ls=90º), providing Earth-based observers with their best visibility of the north polar region since 1987, with its warm central cyclone and long-lived hexagonal wave [5,6].

Studying these interconnected phenomena within Saturn's atmosphere (particularly those that evolve with time in a cyclic fashion) requires regular temporal sampling throughout Saturn's long 29.5-year orbit. We present here a showcase of research from the wealth of archived observations from VLT/VISIR and Subaru/COMICS since 2005, as well as infrared imagery obtained from NASA/IRTF throughout the 1980s.

1.1 Temperature progression

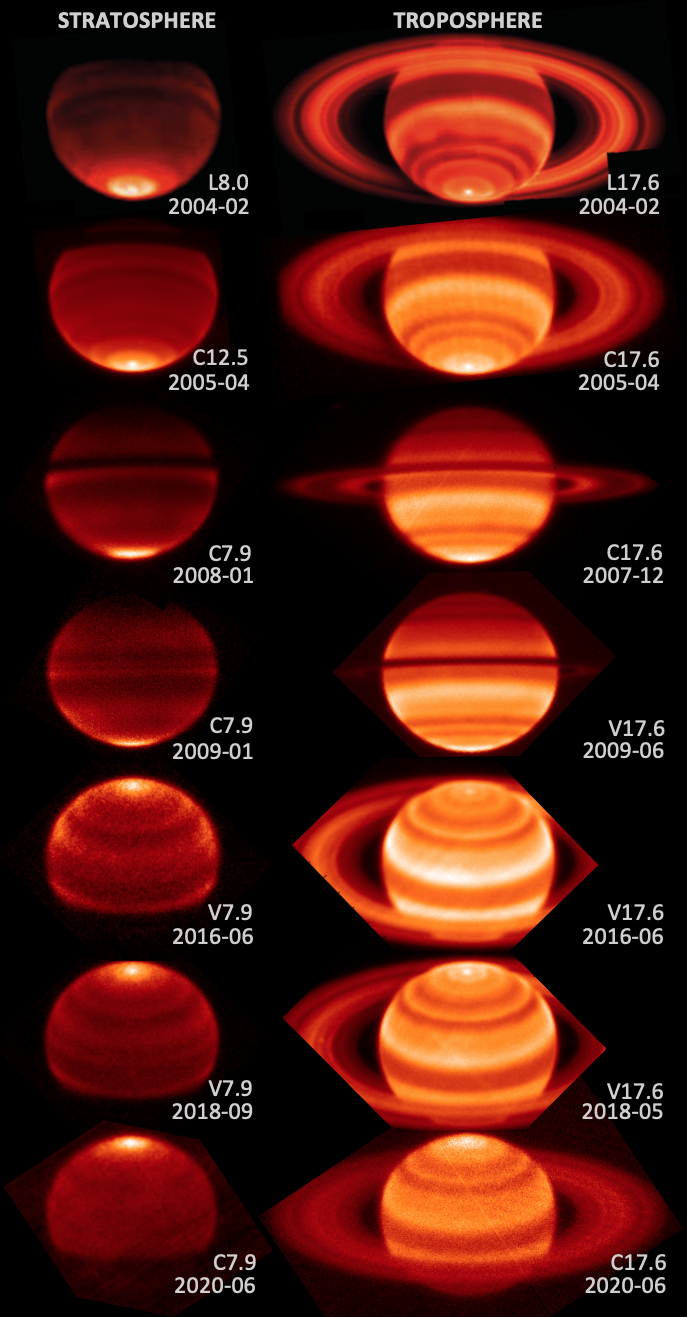
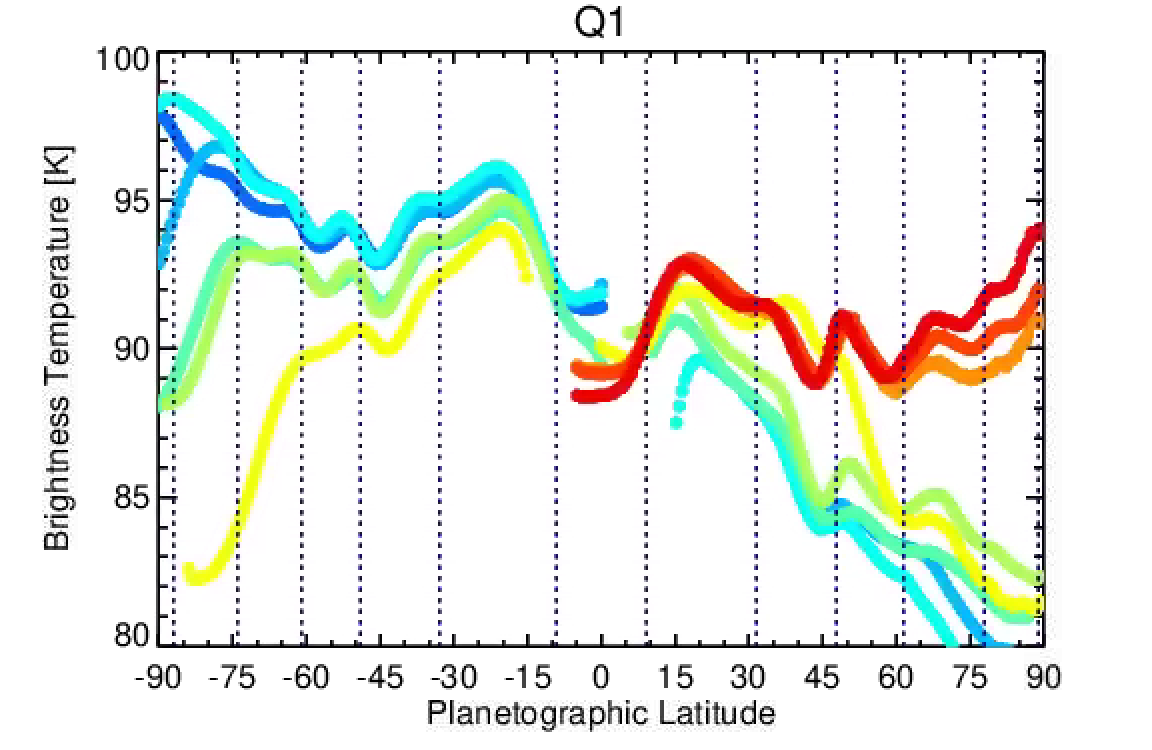
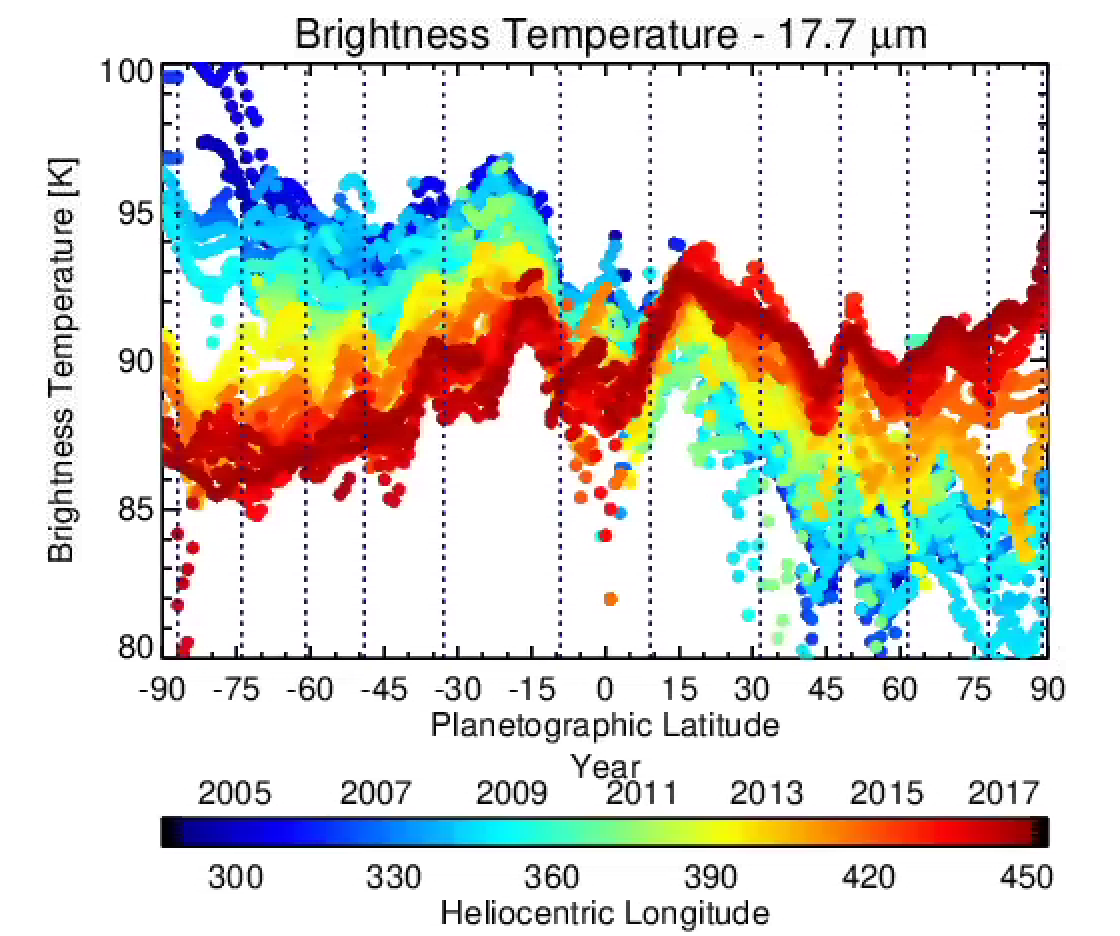
Methane (CH4) is used to determine stratospheric temperatures due to its even distribution across the planet. Figure 1 shows the changes in the stratospheric and tropospheric conditions as seen by VISIR over 3 years; these images are representative of a range of filters between 7-20 µm. We probe changes in the atmospheric 2D temperature brightness distribution across the planet disc in VISIR and COMICS observations taken from April 2005 (Ls=303.6º) to July 2020 (Ls=124.6º); thereby discerning the spatial variability as well as temporal (figure 2). VISIR observations concurrent with the Cassini/CIRS observations are used to cross-check the time-series from Cassini, which can be extended beyond the end-of-mission with the newer VISIR and COMICS observations. These profiles provide a new measure of long-term temperature variability in the context of an established model.

1.2 Interannual Variability

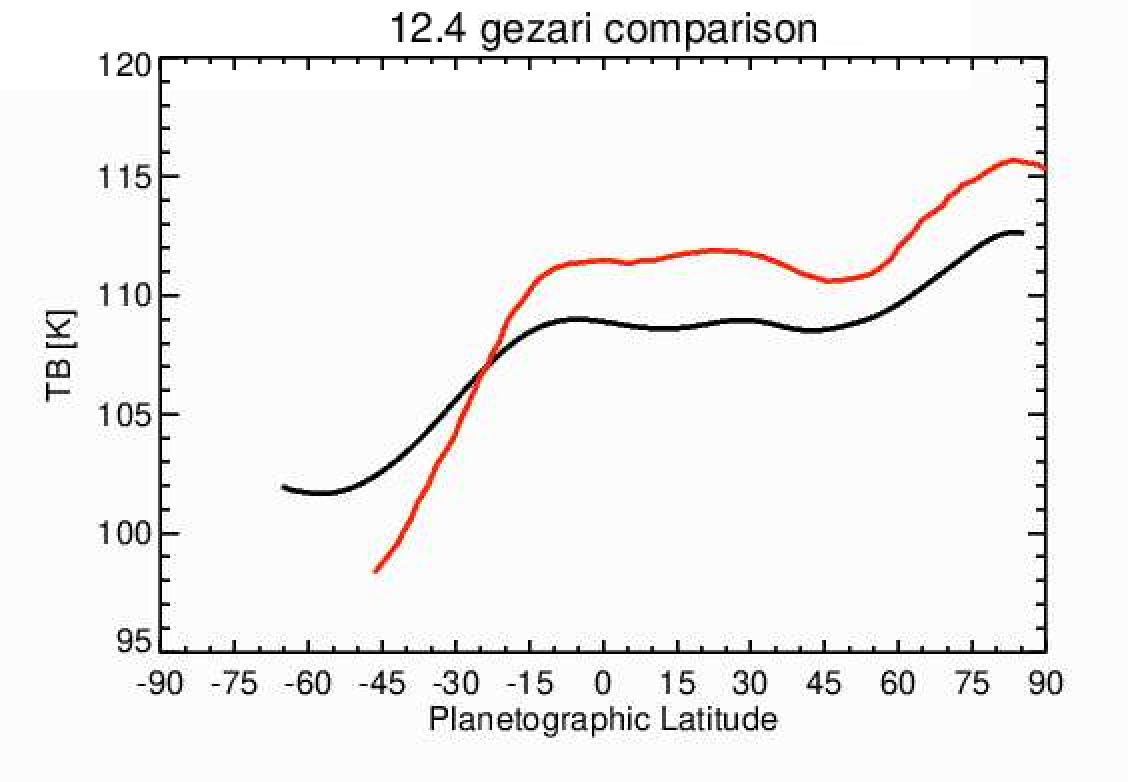
VISIR imaging from September 2017 have provided a unique opportunity, as they were acquired nearly one Saturn year apart from the 1989 observations of Gezari et al, (1989) [7], which were the first images of Saturn in the mid-IR to be taken with a 2D detector, rather than raster scanning. Examining the differences in brightness temperatures and composition indicate limited interannual variation for Saturn’s northern hemisphere (Figure 3). This also provides unique insight into the timescale of Saturn’s equatorial stratospheric oscillation which will be contrasted with a previously suggested biennial cycle [2]. The seasonal temperature progression measured in Section 1.1 also enables us to place this interannual variability in a wider context and provides further opportunity for insightful comparison with the comparatively shorter-term temperature variability.

Figure 1: VISIR observations from P95-102 sensing the troposphere (right) and stratosphere (left).  Polar warming is evident in the stratosphere; but is considerably smaller than that seen during southern summer and in the historical record of the 1980s.  The warm polar hexagon is seen at the north pole, the first such observation from the ground. Work to remove residual striping is ongoing and has been successfully applied to the 2017 images. 2015-16 images have been published by Fletcher et al., 2017 [2].


(a)

(b)

Figure 2: (a) The latitudinal brightness temperature progression of COMICS and VISIR ground-based observations from 2005 (dark blue) to 2017 (dark red), (b) the latitudinal brightness temperature progression of CIRS observations (from Fletcher et al, 2009) from 2005 (dark blue) to 2017 (dark red). 

Figure 3: A comparison of a latitudinal brightness temperature profile sampled from a 12.4µm observation (of Gezari et al. 1989) in red and a latitudinal bright temperature profile from a synthetic image generated using the temperatures and composition from CIRS observations in 2017 shown in black. The contrast between these profiles shows the degree of interannual variability at 12.4µm.

Acknowledgements

This research is funded by a European Research Council consolidated grant under the European Union’s Horizon 2020 research and innovation program, grant agreement 723890. We would like to thank co-author Mael Es-Sayeh for his significant contribution to this research.

References

[1] Fletcher et al., 2012, Icarus 221, p560-586

[2] Fletcher et al., 2017, Nature Astronomy, 1, p765-770

[3] Fletcher et al. 2015, Icarus. 251, 131-153

[4] Fletcher et al., 2015, https://arxiv.org/abs/1510.05690

[5] Fletcher et al., 2008, Science. 319, 79-81

[6] Fouchet et al., 2016, Icarus, 277, p196-214

[7] Gezari et al., 1989, Nature, 342, 777–780

[8] Irwin et al. 2008, JQSRT 109:1136-1150

[9] Orton et al., 2008, Nature 453, p198

[10] Fletcher et al. 2009, Icarus 200, 154-175

How to cite: Blake, J., Fletcher, L., Antunano, A., Melin, H., Roman, M., Orton, G., Rowe-Gurney, N., King, O., and Es-Sayeh, M.: Saturn’s Seasonal Atmosphere: Cassini CIRS contrasts to ground-based observations, Europlanet Science Congress 2021, online, 13–24 Sep 2021, EPSC2021-402, https://doi.org/10.5194/epsc2021-402, 2021.

EPSC2021-408
Manuel López-Puertas, Alejandro Sánchez-López, Maya García-Comas, Bernd Funke, Thierry Fouchet, and Ignas Snellen

CH4 plays a key role in the thermal structure of Jupiter's upper atmosphere and hence knowing its vertical distribution is crucial for its understanding. Methane concentrations have been inferred previously from the analyses of solar occultation, He and Ly-α airglow, and the ISO/SWS radiance measurements around 3.3 µm, showing all rather different values, particularly around the homopause. Even different analyses of the same ISO/SWS radiance spectra yield very different CH4 volume mixing ratio profiles. Here, we present a new analysis of the ISO/SWS radiance spectra by using a comprehensive non-Local Thermodynamic Equilibrium (non-LTE) model and the most recent collisional rates measured in the laboratory. Further, we briefly discuss the potential effects of non-LTE on CH4 3.3 µm emission of temperate Jupiter exoplanets.

How to cite: López-Puertas, M., Sánchez-López, A., García-Comas, M., Funke, B., Fouchet, T., and Snellen, I.: CH4 abundance in Jupiter's upper atmosphere: A re-analysis of the ISO/SWS 3.3 µm non-LTE emission, Europlanet Science Congress 2021, online, 13–24 Sep 2021, EPSC2021-408, https://doi.org/10.5194/epsc2021-408, 2021.

EPSC2021-551
Naiara Barrado-Izagirre, Jon Legarreta, Agustín Sánchez-Lavega, Santiago Pérez-Hoyos, Ricardo Hueso, Peio Iñurrigarro, Jose Felix Rojas, Iñaki Ordoñez-Etxeberria, and Iñigo Mendikoa

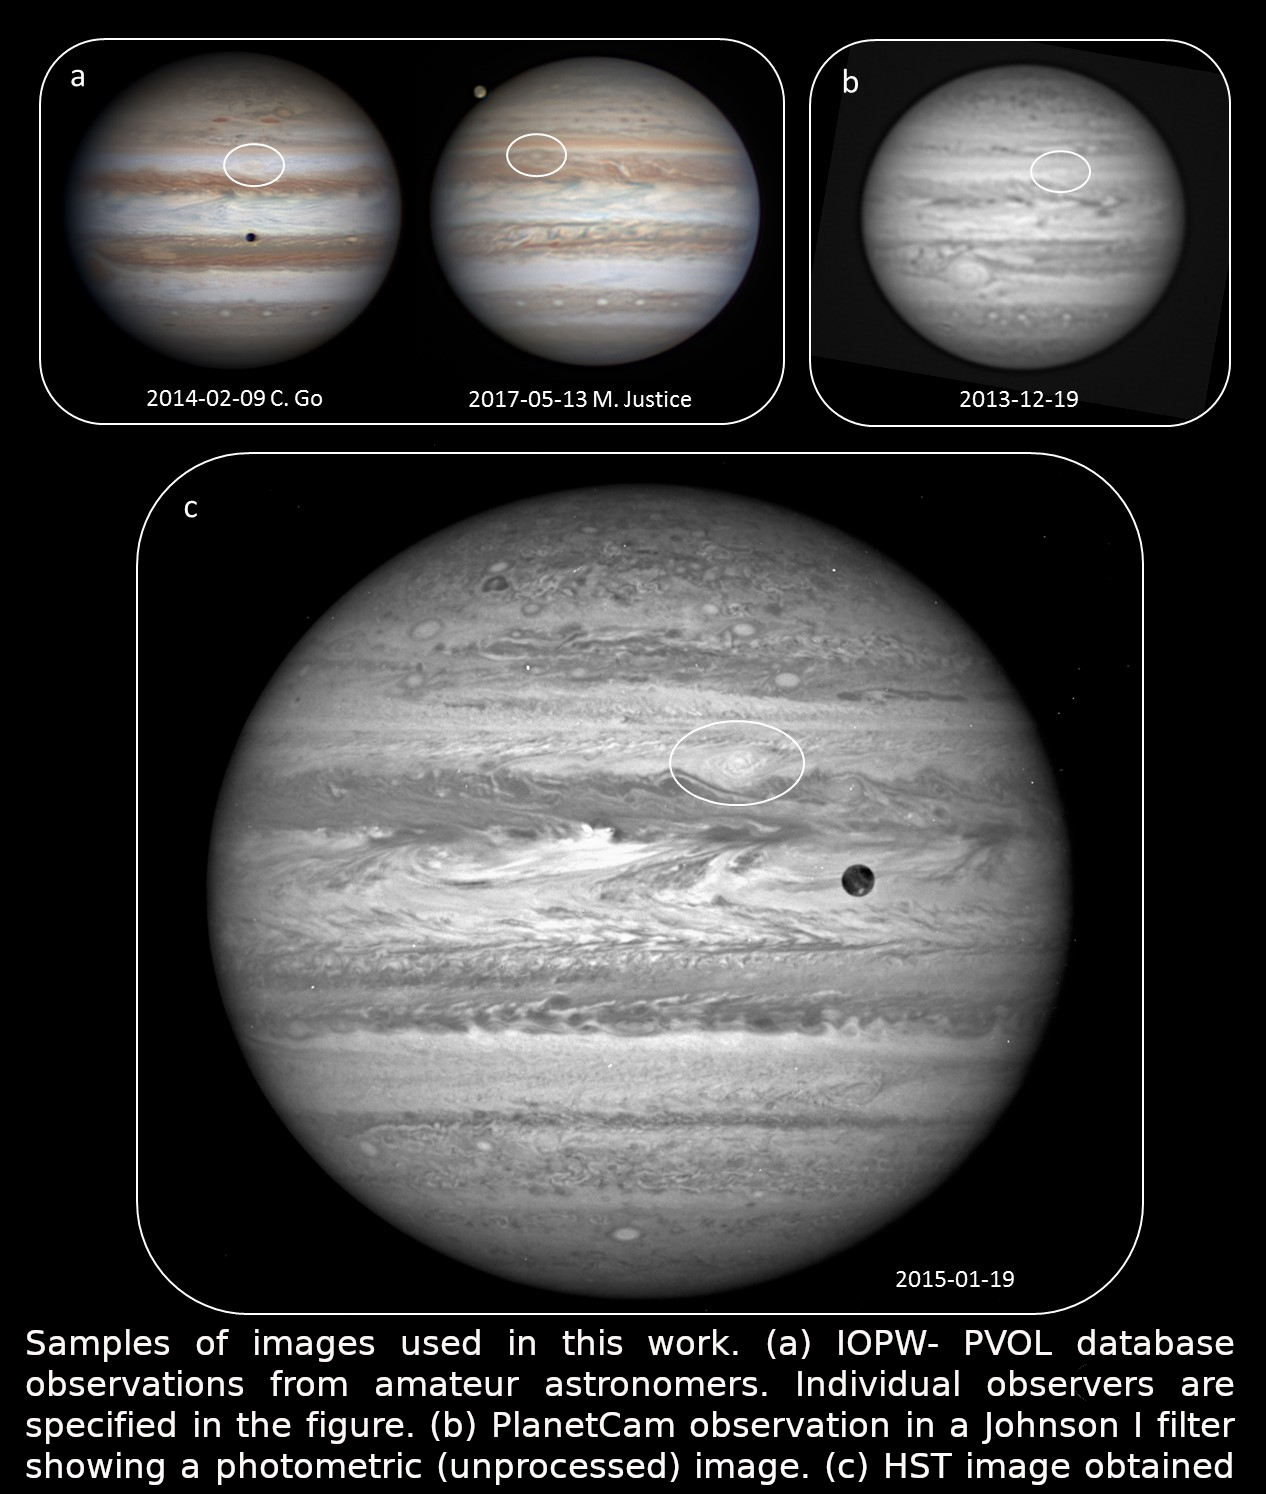
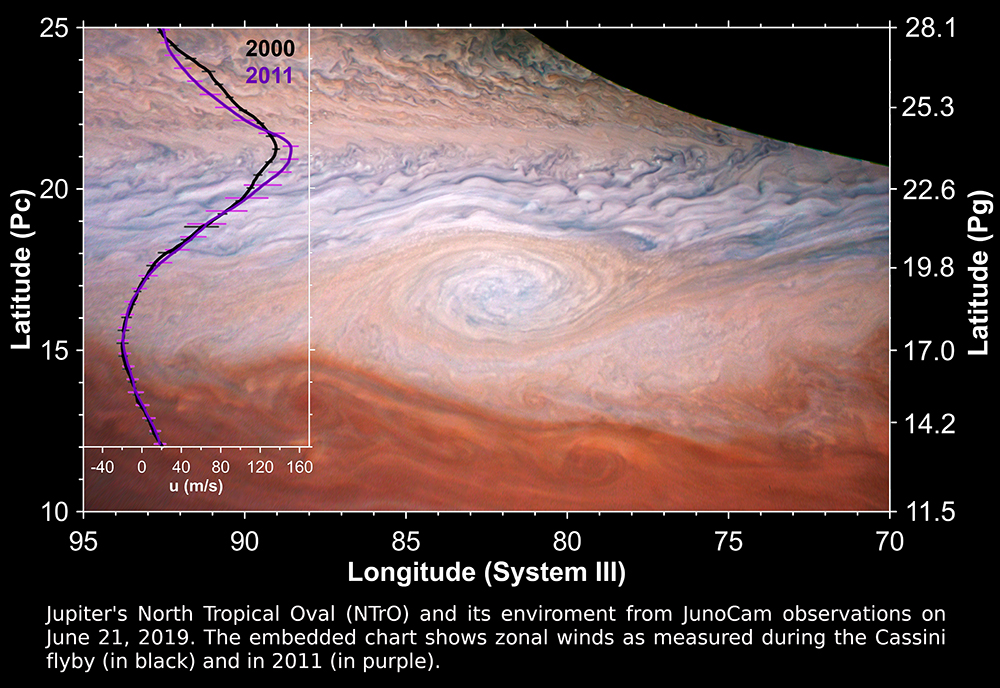
Jupiter’s atmosphere holds a large variety of vortices. In the transition region between the North Equatorial Band (NEBn) and North Tropical Zone (NTrZ) there are convective storms, cyclones and anticyclones at nearby latitudes and atmospheric waves. In this complex region there is a large anticyclone the North Tropical Oval (NTrO) located at 19ºN planetographic latitude that persists since at least 2006 and it is one of the longest-lived anticyclonic ovals in the planet, following the Great Red Spot and oval BA.

The NTrO has endured a complex dynamic history. It experienced one major merger with other oval in February 2013. It has also suffered color changes, with a change from white to red in September 2013 and then, in December 2014, back to white, but with a remaining external red ring. Moreover, it has survived major disturbances of the region. A North Temperate Belt Disturbance (NTBd) occurred in October 2016, which fully covered the oval, leaving it undistinguishable for months. When it reappeared, it was at the expected longitude from its previous longitudinal tracking with a similar appearance, a white large oval and same color and morphology from 2017 to 2021. It also survived the NTB disturbances that occurred in 2012 and 2020. In 2020 the region shows several other ovals in the vicinity so observations in 2021 will probably be able to show interactions between the NTrO and these new ovals.

To describe the historic evolution of this anticyclone we use JunoCam, Hubble Space Telescope (HST), IOPW database and PlanetCam-UPV/EHU multi-wavelength observations. We have retrieved a very complete track of the oval with major changes in its drift rate in specific periods of time. JunoCam and HST images have been used to measure its size and internal rotation obtaining a mean value of (10,500±1,000) x (5,800±600) km for the size and a mean relative vorticity of -(2±1)·10-5s-1. While GRS and BA have higher vorticity values than their environments, the NTrO’s vorticity is nearly the same as the ambient vorticity of its surroundings. This may suggest that this oval is probably sustained by the zonal jets confining it.

Using HST and PlanetCam observations, we have characterized its color changes measuring the color and altitude-opacity indices. The results obtained for these indices show that the oval is higher and has redder clouds than its environment but has lower cloud tops than other large ovals like the GRS, and it is less red than the GRS and oval BA.

Despite the external changes, including mergers and planetary-scale disturbances, and internal ones, in the form of morphology, altitude and color changes, none of them destroyed the vortex. The main characteristics of the oval remain unaltered. The drift rate and vorticity are visibly connected to its latitudinal location. The stability of the vortex to all the different changes of the area and its latitudinal changes suggest that the vortex is sustained by the atmosphere at levels much deeper than the observable cloud level.

How to cite: Barrado-Izagirre, N., Legarreta, J., Sánchez-Lavega, A., Pérez-Hoyos, S., Hueso, R., Iñurrigarro, P., Rojas, J. F., Ordoñez-Etxeberria, I., and Mendikoa, I.: Temporal evolution of the NTrO, the third largest oval on Jupiter, Europlanet Science Congress 2021, online, 13–24 Sep 2021, EPSC2021-551, https://doi.org/10.5194/epsc2021-551, 2021.

EPSC2021-134
Arrate Antunano, Leigh N Fletcher, Glenn S Orton, Henrik Melin, Padraig T. Donnelly, Michael T Roman, James A Sinclair, and Yasumasa Kasaba

1. Overview

Jupiter's banded structure undergoes remarkable global-scale disturbances that can completely change its appearance from the deep troposphere below the cloud deck (2-7 bar) to the stratosphere (~1 mbar). These events can alter Jupiter's cloud structure, aerosols, and temperature field through mechanisms that are not well understood, and provide relevant insights into Jupiter’s time-variable atmospheric dynamics. Characterizing Jupiter's atmospheric changes in the long-term is crucial to better understand the origin and nature of the planetary scale disturbances, distinguishing between seasonal or mechanical forcing, and enables further investigation of the coupling of Jupiter's belts and zones that could explain the presence of 'Global Upheavals' (Rogers, 1995). In this study, we will describe how Jupiter's temperatures and aerosols vary over long spans of time, from the top NH3 clouds to the stable mid-stratosphere, and we will show that although Jupiter's troposphere and stratosphere exhibit a large number dynamical phenomena, there exists quasi-periodic patterns that may aid in future predictions of planetary-scale changes to the banded structure.

2. Ground-Based Observations

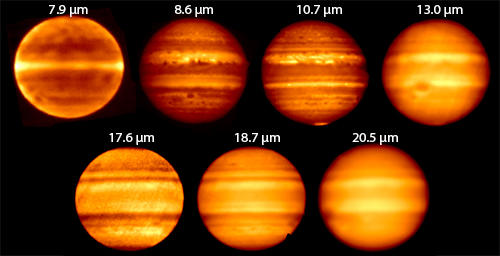
Continued monitoring of Jupiter from ground-based observatories from the past 40 years has provided an unprecedented resource for understanding the cyclic/non-cyclic environmental changes  in temperature, aerosols, and composition governing Jupiter’s dynamic atmosphere. More recently, ground-based observations have provided essential temporal, spectral and spatial resolution to support observations from the Juno spacecraft. Our study uses ground-based mid-infrared observations captured between 1983 and 2019 at wavelengths between 7.9 µm and 24.5 µm by 7 different instruments: the BOLO-1 (1983-1993), AT-1 (1983-1993), MIRAC (1993-1999), MIRLIN (1996-2003) and MIRSI (2003-2011) instruments mounted at the 3-m NASA Infrared Telescope Facility (IRTF) in Hawai'i; the VISIR (2006-2011, 2016-2018) instrument mounted at the 8-m Very Large Telescope (VLT) in Chile; and the COMICS (2005-2019) instrument on the 8-m Subaru Telescope in Hawai'i. Examples of Jupiter images at different wavelengths are given in Figure 1.

Figure 1. Examples of images of Jupiter captured by the MIRSI instrument at 7 different wavelengths.

3. Multi-Year Cycles of Variability

As mentioned above, Jupiter’s belts and zones endure dramatic global-scale changes over short-timescales, where belts expand, contract and even entirely disappear in a complex and turbulent way (e.g., Fletcher et al., 2017, doi:10.1002/2017GL073806). The most remarkable examples of this are the South Equatorial Belt (SEB, at 7°-17° S) fading and revival cycles (e.g., Sánchez-Lavega & Gomez, 1996, doi:10.1006/icar.1996.0067; Fletcher et al., 2017, doi:10.1016/j.icarus.2017.01.001), where the typically warm and dark belt at visible wavelengths transforms into a cold, cloud-covered whitish zone in timescales of months, remaining disturbed for years before energetic storms trigger the revival of the belt. A similar ‘revival’ process occurs semi-periodically at the North Temperate Belt (NTB, at 21°-28° N), where energetic convective storms rising from the water layer in the deep troposphere at this belt interact with the background flow producing a new low-albedo band over the southern half of the NTB (e.g., Sánchez-Lavega et al., 2017, doi: 10.1002/2017GL073421). At lower latitudes, the North Equatorial Belt (NEB, at 7°-17° N) is observed to expand northward in time intervals of 3 to 5 years, causing a gradual decrease in reflectivity (darkening) at the neighbouring North Tropical Zone (NTrZ, at 18°-21° N), typically originated from wave-like bulges of materials impinging on the NTrZ (e.g. Rogers, 1995; Fletcher et al., 2017, 10.1002/2017GL073383). Finally, Jupiter’s Equatorial Zone (EZ, within ±7° of the equator) experiences a rare 7-year cyclic disturbance, where the typically white (NH3 cloud-covered) and cold EZ displays a new 5-μm-bright (NH3 cloud-free) band encircling the planet south of the equator, accompanied by a reddish coloration at visible wavelengths (e.g., Antuñano et al., 2018, doi: 10.1029/2018GL080382; Rogers, 1995).


In this presentation, we will show zonal-mean brightness temperature maps spanning the period between 1983 and 2019 at 5 different wavelengths (7.9 µm, 8.6 µm, 10.7 µm, 18.7 µm and 20.5 µm) and between 1996 and 2019 at 8 wavelengths (same list plus 13.0 µm, 17.6 µm and 24.5 µm). We will describe the temporal and latitudinal variability of the brightness temperature at each of these wavelengths, looking for potential correlation/anticorrelation between changes at different belts that could help to reveal the processes underpinning the jovian global upheavals. We will also compare changes at different wavelengths to better understand the vertical extent of the global-scale disturbances in Jupiter’s banded structure.

4. Temperature and Aerosol Opacity: Variability

Zonal-mean radiance profiles at different wavelengths can be stacked together to form 5-point (7.9 µm, 8.6 µm, 10.7 µm, 18.7 µm and 20.5 µm) spectral image cubes between 1983 and 2019 and 8-point (the same plus 13.0 µm, 17.6 µm, and 24.5 µm) spectral image cubes between 1996 and 2019. These spectral image cubes can then be inverted independently using the radiative-transfer and retrieval code NEMESIS (Irwin et al., 2008, doi:10.1016/j.jqsrt.2007.11.006), to obtain crude estimations of stratospheric temperatures at 10-20 mbar (constrained by the 7.9 µm wavelength), upper-tropospheric (100-300 mbar) and mid-tropospheric (~500 mbar) temperatures (constrained by the 17.6 µm-24.5 µm and 10.7 µm, respectively), and tropospheric aerosol opacity at 400-600 mbar (constrained by the 8.6 µm wavelength).


Here, we will show stratospheric and tropospheric temperature and aerosol opacity maps between 1983 and 2019. We will describe the timescales of the variability observed in these maps by presenting a Lomb-Scargle analysis, and we will compare their periodicity to previously reported cyclic activity in Jupiter’s atmosphere, describing how temperature and aerosols vary during the planetary-scale disturbances. We will also compare the periodicity found at different belts, showing an NEB-SEB anticorrelation in the aerosol opacity and mid-tropospheric temperatures, and differences in the temperature field and aerosol opacity between hemispheres will be discussed. Finally, we will reveal a tropospheric-stratospheric coupling associated with Jupiter's Equatorial Stratospheric Oscillation. 

How to cite: Antunano, A., Fletcher, L. N., Orton, G. S., Melin, H., Donnelly, P. T., Roman, M. T., Sinclair, J. A., and Kasaba, Y.: Cycles of Variability in Jupiter's Atmosphere from Ground-Based Mid-Infrared Observations, Europlanet Science Congress 2021, online, 13–24 Sep 2021, EPSC2021-134, https://doi.org/10.5194/epsc2021-134, 2021.

EPSC2021-667
Gerald Eichstädt, Candice Hansen, and Glenn Orton


Abstract

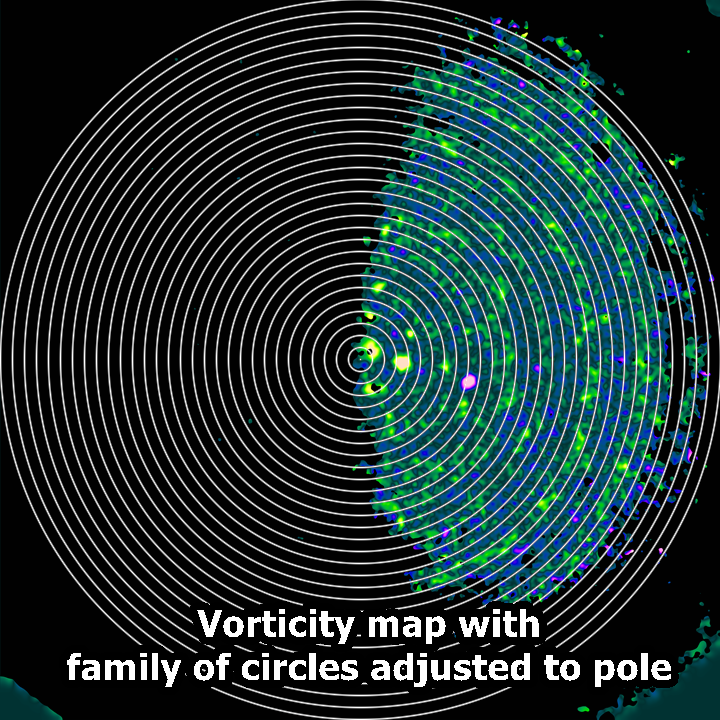
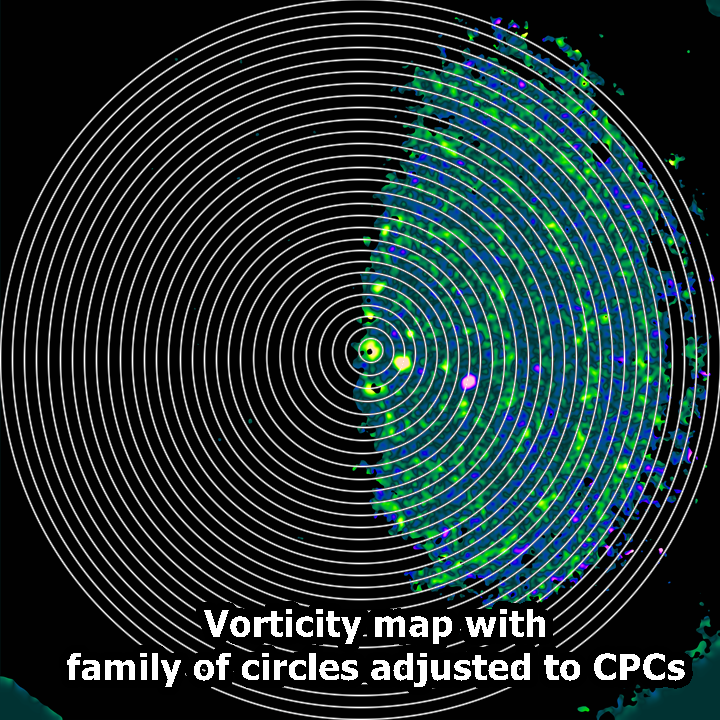
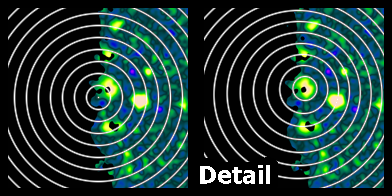
Traditionally, Jupiter's zonal wind profile is described as a function of latitude. Statistical data are integrated along circles of latitude. It is straightforward to apply the same principle to zonal vorticity profiles based on vorticity maps. This approach assumes implicitly a rotational symmetry of Jupiter's zonal structure with respect to Jupiter's rotation axis. However, the centers of both clusters of circumpolar cyclones turned out to be displaced from the respective pole. An appropriate description of zonal profiles requires a more flexible framework. This presentation is dedicated to a flexible geometrical way that a vorticity profile can be defined, as well as to the level of detail to which statistical data are described in the profile. The general approach is applicable well beyond zonal vorticity profiles, but our focus is on vorticity data retrieved from JunoCam [1] images.


Geometry

The circles of latitudes form a family of concentrical circles parameterized by the latitude as the only parameter. Let's call this parameter the “index” that is mapped to its circle of latitude. We obtain additional flexibility by a continuous distortion of the family of concentrical circles and by restricting the resulting family of curves to valid areas of interest without distorting our vorticity map. This generalized family of curves is sufficiently flexible to investigate profiles of 2-dimensional structures beyond zonal vorticity profiles. For even more flexibility in our evaluation, we can merge several such families of curves of the same index set into a single family of curves by concatenating corresponding curves.

A curve of the family is embedded into a vorticity map. So, each arc length position of the curve is mapped to a vorticity value.


Statistics

Rather than plotting a diagram of vorticity as a function of arc length, we are more interested in the statistical vorticity distribution covered by the respective curve of our family of curves. This construction induces a mapping that assigns each index a vorticity distribution function.

These vorticity distribution functions can be discussed as they are, or they are reduced to usual statistical parameters such as the mean, standard deviation, or higher-order statistical moments. Profiles as a function of our index can be plotted as diagrams when based on such statistical parameters.


Modified Zonal Vorticity Profile

With these general considerations, we return to our initial motivation: A modification of a zonal vorticity profile (ZVP) based on a modified pole close to the center of the south polar cyclone with modified circles of latitude continuously approximating the traditional definition of circles of latitude for lower latitudes.


This modified notion of a ZVP improves the comparison and stacking of zonal vorticity profiles of the south polar region between perijoves for a wobbling south polar CPC cluster centered off the south pole.


Planetary Waves

A further refinement of a modified ZVP tests for planetary waves following presumed wave numbers, phases and amplitudes for a given latitude. Here, the standard deviation of the vorticity along a curve is to be assessed. 


References

[1] C.J. Hansen, M.A. Caplinger, A. Ingersoll, M.A. Ravine, E. Jensen, S. Bolton, G. Orton. Junocam: Juno’s Outreach Camera. Space Sci Rev 2013:475-506, 2017 


How to cite: Eichstädt, G., Hansen, C., and Orton, G.: A Generalized Framework to Investigate Families of Vorticity Distributions in JunoCam Image Data and Beyond, Europlanet Science Congress 2021, online, 13–24 Sep 2021, EPSC2021-667, https://doi.org/10.5194/epsc2021-667, 2021.

Formation and deep atmosphere
EPSC2021-148
Artyom Aguichine, Olivier Mousis, and Jonathan Lunine

The formation mechanism of Jupiter is still under debate, as different scenarios of migration and gas capture reproduce Jupiter's properties [1-4]. Elemental abundances measured in Jupiter's atmosphere are key ingredients to trace the origin of various species. The Galileo probe measured the abundances of several elements (Ar, Kr, Xe, C, O, S and P), which exhibit a uniform enrichment of 2 to 6 times the protosolar abundance, except for O. Recent measurements for NH3 and H2O by the Juno mission give additional information on the abundances of these key condensables in Jupiter's gaseous envelope [5]. Here, we investigate the possible timescale and location of Jupiter's formation using measurements of molecular and elemental abundances in its enveloppe.

To do so, we use a 1D accretion disk model to compute the properties of the protosolar nebula (PSN) that includes radial transport of trace species present in the form of dust and ice particles and their vapors [6]. We focus on radial transport of volatiles crystallization via the computation of their sublimation/condensation rates, computed as they migrate through the disk, along a large set of icelines in the PSN. Initial elemental abundances are protosolar values [7], with elements of interest being C, N, O, P, S, Ar, Kr and Xe.

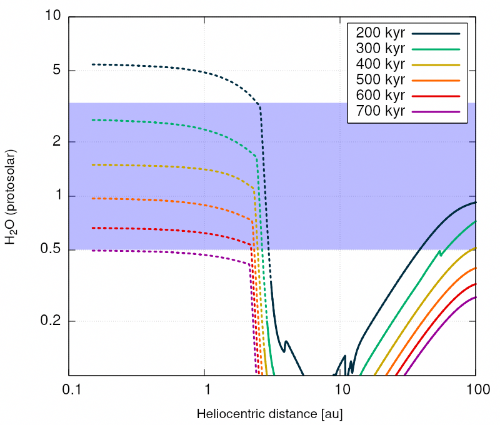
The figure below represents profiles of the ratio between the surface density of H2O to the surface density of the H2-He gas ∑H2O / ∑g normalized to the initial value, thus representing the enrichment to protosolar value, at different times and locations. Solid and dashed lines are used where volatiles are mostly in solid or vapor phase, respectively. The blue box corresponds to the measurement of H2O to protosolar value measured in Jupiter’s atmosphere by Juno [5]. We find that the H2O abundance in the PSN reproduces the value measured in Jupiter’s envelope within the H2O snowline at times of approx 500 kyr.

Our model reproduces Jupiter envelope’s abundance in H2O and other elements within the H2O snowline (where are volatiles are in the form of vapor), but not beyond. This suggests that Jupiter's envelope formed by rapidly accreting the gas from the protosolar nebula close to or within the H2O snowline. The derived timescale is consistent with the time required to form Jupiter's core from planetesimals, followed by a gas-accretion phase. This approach could help discriminate between the proposed scenarios for Jupiter's formation, but also give some clues on the composition and dynamics of the protosolar nebula.


[1] Gautier, D., Hersant, F., Mousis, O., et al. 2001, ApJL, 550, L227.

[2] Mousis, O., Ronnet, T., and Lunine, J. I. 2019, ApJ, 875, 9.

[3] Öberg, K. I. and Wordsworth, R. 2019, AJ, 158, 194.

[4] Miguel, Y., Cridland, A., Ormel, C. W., et al. 2020, MNRAS, 491, 1998.

[5] Li, C., Ingersoll, A., Bolton, S., et al. 2020, Nature Astronomy, 4, 609.

[6] Aguichine, A., Mousis, O., Devouard, B., and Ronnet, T. 2020, ApJ, 901, 97.

[7] Lodders, K., Palme, H., & Gail, H.-P. 2009, Landolt Börnstein, 4B, 712


How to cite: Aguichine, A., Mousis, O., and Lunine, J.: Constraints on the timescale and location of Jupiter's formation from Juno measurements, Europlanet Science Congress 2021, online, 13–24 Sep 2021, EPSC2021-148, https://doi.org/10.5194/epsc2021-148, 2021.

EPSC2021-197
Olivier Mousis, Jonathan Lunine, and Artyom Aguichine

The recent water and ammonia measurements (Bolton et al. 2017; Li et al. 2017, 2020) performed at 100 bars or more by the Juno microwave radiometer in the interior of Jupiter are combined with the data previously acquired by the Galileo probe (Mahaffy et al. 2000; Wong et al. 2004) and the Cassini spacecraft (Fletcher et al. 2009) to derive hints on the composition of solids vaporized in the envelope of the forming Jupiter during its growth.

To do so, we computed the condensation sequence of the ices of astrophysical interest forming in the feeding zone of the growing Jupiter by using the equilibrium curves of pure condensates and various clathrates derived from compilations of laboratory data or fits from models calibrated on experiments. The employed disk model detailing the evolution of temperature and pressure at the location of Jupiter is derived from Aguichine et al. (2020). Our approach allows i) the computation of the composition of ices forming in feeding zone of Jupiter, and ii) the determination of the amount of these solids needed in the giant planet’s envelope to match the measured volatiles enrichments. The Juno water measurement is used to calibrate our model.

Figure 1 represents an example of volatiles enrichments in Jupiter fitted with our planetesimal composition model. In this case, we assume that the abundances of volatiles are protosolar and that only pure ices formed in the protosolar nebula. The figure shows that all species abundances, except that of argon, can be matched in Jupiter. The corresponding amount of ices vaporized in the envelope ranges between 3.9 and 20.7 Earth-masses. Other cases, with increasing water abundance in the protosolar nebula and the presence of clathrates, are currently investigated.

Fig. 1.Ratio of Jovian to protosolar abundances in the case the volatiles part of the building blocks is formed from pure condensates only.


Aguichine, A., Mousis, O., Devouard, B., Ronnet, T. 2020. Rocklines as Cradles for Refractory Solids in the Protosolar Nebula. The Astrophysical Journal 901. doi:10.3847/1538-4357/abaf47

Bolton, S.J. and 42 colleagues 2017. Jupiter's interior and deep atmosphere: The initial pole-to-pole passes with the Juno spacecraft. Science 356, 821–825. doi:10.1126/science.aal2108

Fletcher, L.N., Orton, G.S., Teanby, N.A., Irwin, P.G.J. 2009. Phosphine on Jupiter and Saturn from Cassini/CIRS. Icarus 202, 543–564. doi:10.1016/j.icarus.2009.03.023

Li, C. and 22 colleagues 2020. The water abundance in Jupiter's equatorial zone. Nature Astronomy 4, 609–616. doi:10.1038/s41550-020-1009-3

Li, C. and 16 colleagues 2017. The distribution of ammonia on Jupiter from a preliminary inversion of Juno microwave radiometer data. Geophysical Research Letters 44, 5317–5325. doi:10.1002/2017GL073159

Mahaffy, P.R. and 7 colleagues 2000. Noble gas abundance and isotope ratios in the atmosphere of Jupiter from the Galileo Probe Mass Spectrometer. Journal of Geophysical Research 105, 15061–15072. doi:10.1029/1999JE001224

Wong, M.H., Mahaffy, P.R., Atreya, S.K., Niemann, H.B., Owen, T.C. 2004. Updated Galileo probe mass spectrometer measurements of carbon, oxygen, nitrogen, and sulfur on Jupiter. Icarus 171, 153–170. doi:10.1016/j.icarus.2004.04.010

How to cite: Mousis, O., Lunine, J., and Aguichine, A.: Deciphering the composition of Jupiter’s building blocks from Juno water measurements, Europlanet Science Congress 2021, online, 13–24 Sep 2021, EPSC2021-197, https://doi.org/10.5194/epsc2021-197, 2021.

EPSC2021-262
|
ECP
José Ribeiro, Pedro Machado, Santiago Pérez-Hoyos, and Patrick Irwin

Determining the abundances of chemicals species and their isotopic ratios is fundamental to understand how and when the planets formed, in what conditions and what processes happen in their atmosphere. Jupiter still has some unanswered questions in this regard. The apparent low-temperature origin of the elements that formed the planet, the detailed meteorological processes that happen in its atmosphere remain largely unknown and the chemistry responsible for the colours of clouds of Jupiter is one of its oldest mysteries (Taylor et al., 2006). With this work, we hope to contribute to the progress of unravelling some of these questions.

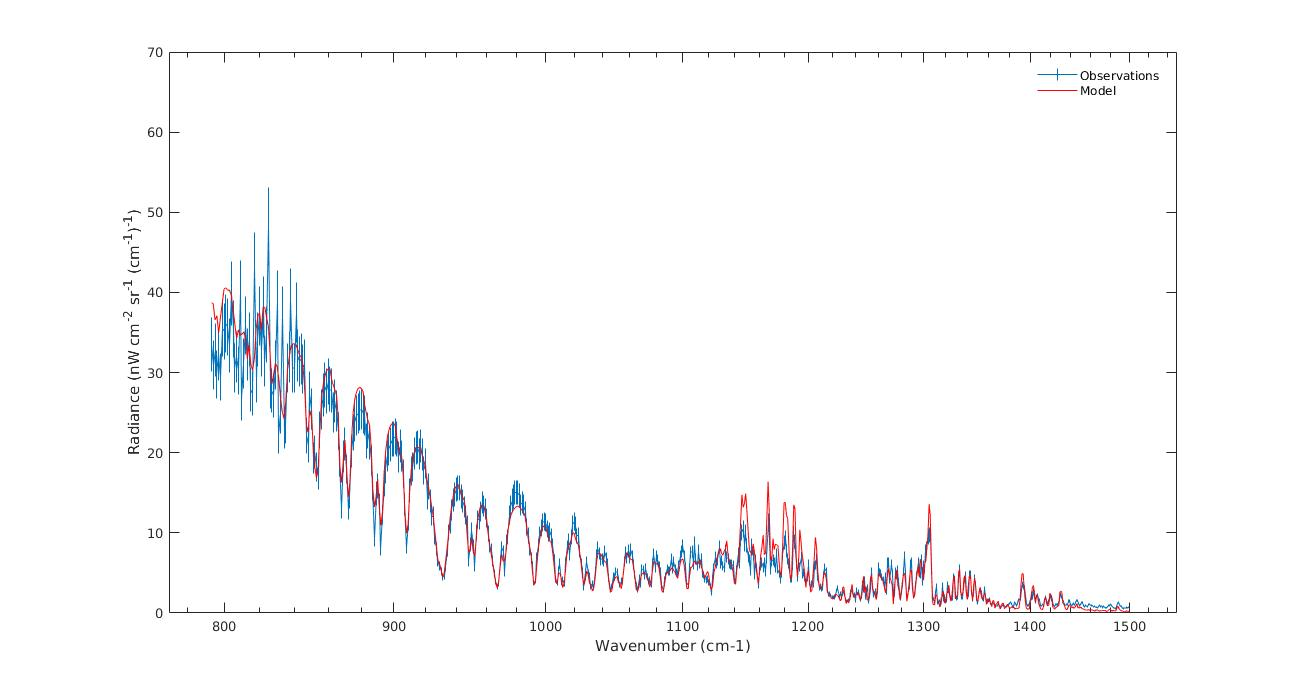
We used the observations of Jupiter from the ESA mission Infrared Space Observatory (ISO) (Kessler et al., 1996) in the 793.65-3125 cm-1 (3.2-12.6 µm) region using the Short-Wave Spectrometer (SWS) (de Graauw et al., 1996). Our work is focused on the 793.65-1492.54 cm-1 (6.7-12.6 µm) region of the spectrum. Even though this data set is old, it was an important step in the study of Jupiter’s atmosphere and with the advancements in atmospheric models and line data, we argue that it warrants a revisit and reanalysis.

Figure 1: Plot of ISO-SWS data and used in this work and model fit.

Firstly, we used the NEMESIS radiative transfer suite (Irwin et al., 2008) to reproduce the results from Encrenaz et al., 1999 as a way to verify the validity of our method. This study is done using the CIRS NEMESIS template as a base adapted to the ISO-SWS data.  We used correlated k-tables compiled for NH3, PH3, 12CH3D, 12CH4, 13CH4, C2H2, C2H6, CH3Br, CH3OH, HCOOH and SF6, with our results showing good agreement [Fig.1].

Having verified our method, we present here our first results of the study of abundances of 12CH3D, 12CH4, 13CH4, C2H2 and C2H6 of Jupiter’s atmosphere as well as our initial study of the pressure-temperature profile of Jupiter. We use the NEMESIS suite to determine the abundances as a function of altitude and retrieve the pressure-temperature profile. We compare our results with the profiles and abundances from Neimann et al., 1998 and Fletcher et al., 2016 with the aim to constrain the number of possible best fit profiles.

We also present our initial study the H/D and 12C/13C isotopic ratio of the Jovian atmosphere from the abundances of 12CH3D, 13CH4 and 12CH4 following the methodology from Fouchet et al., 2000.

Despite the ISO-SWS data used being global, with this preliminary work we hope to further advance the knowledge about the chemical processes that happen in Jupiter, as well as the chemical and temperature vertical distribution. As future work, we expect to extend our frequency domain to the range of ISO/SWS observations and study the 15N/14N ratio.


References

  • de Graauw et al., Observing with the ISO short-wavelength spectrometer, A&A 315, L49-L54, 1996
  • Encrenaz et al., The atmospheric composition and structure of Jupiter and Saturn form ISO observations: a preliminary review, Planetary and Space Science 47, 1225-1242, 1999
  • Fletcher et al., Mid-infrared mapping of Jupiter’s temperatures, aerosol opacity and chemical distributions with IRTF/TEXES, Icarus 278, 128–161, 2016
  • Fouchet et al., ISO-SWS Observations of Jupiter: Measurement of the Ammonia Tropospheric Profile and of the 15N/14N Isotopic Ratio, Icarus 143, 223–243, 2000
  • Irwin et al., The NEMESIS planetary atmosphere radiative transfer and retrieval tool, Journal of Quantitative Spectroscopy & Radiative Transfer 109, 1136–1150, 2008
  • Kessler et al., The Infrared Space Observatory (ISO) mission, A&A 315, L27, 1996
  • Neimann et al., The composition of the Jovian atmosphere as determined by the Galileo probe mass spectrometer, Journal of Geophysical Research Atmospheres 103(E10):22831-45, 1998
  • Taylor et al., Jupiter, The Planet, Satellites and Magnetosphere, Ch.4, Cambridge Planetary Science, Eds. Bagenal, Dowling, McKinnon, 2006


Acknowledgements

We acknowledge support from the Portuguese Fundação Para a Ciência e a Tecnologia (ref. PTDC/FIS-AST/29942/2017) through national funds and by FEDER through COMPETE 2020 (ref. POCI-01-0145 FEDER-007672).

How to cite: Ribeiro, J., Machado, P., Pérez-Hoyos, S., and Irwin, P.: A reanalysis of ISO-SWS Jupiter observations: first results, Europlanet Science Congress 2021, online, 13–24 Sep 2021, EPSC2021-262, https://doi.org/10.5194/epsc2021-262, 2021.

EPSC2021-342
Huazhi Ge, Cheng Li, and Xi Zhang
  • Introduction

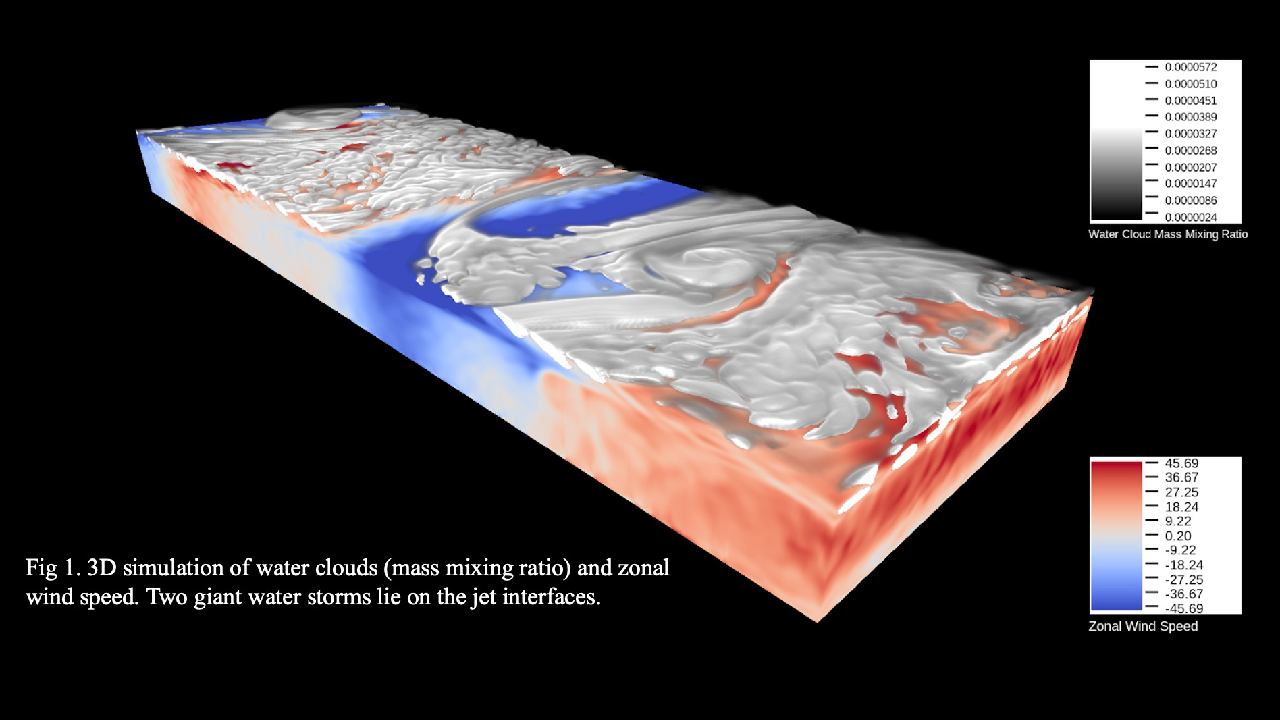
  Moist convection is ubiquitously present in Jupiter’s atmosphere albeit the least understood. Many fundamental questions regarding planetary atmospheres are closely related to moist convection. For example, lightning events are more frequently detected in Jupiter’s belts where the visible layer is dryer and cloudless [1, 2, 3]; chemically inert vapor like ammonia is not uniformly mixed well below its condensation level. To address those puzzles, we create a new Jovian atmospheric model (SNAP) [4], using the vertical-implicit-correction (VIC) scheme [5]. The VIC scheme greatly improves the computational efficiency for simulations with a large horizontal-to-vertical aspect ratio. For a typical synoptic-scale simulation, the efficiency is improved by about 2 orders of magnitudes. We present a beta-plane simulation relevant to Jupiter’s regimes with condensation of water and ammonia to study jet and vortex formations in the mid-latitude. Several cyclones, resembling hurricanes in Earth's atmosphere, are found at the interfaces of eastward jets and westward jets in the water cloud layers. Our simulation is the first nonhydrostatic 3D Jovian atmosphere model that explicitly resolves moist convection. 

  • Model Description

  SNAP is developed on top of the framework of Athena++, which is a finite volume astrophysics code [4, 6]. In our recent work, a VIC scheme is implemented into the model [5]. The VIC scheme solves diagnostic variables (i.e., density, velocities, and total energy) of Euler equations by implicitly treating the vertical flux divergence. This treatment greatly relaxes the Courant-Friedrichs-Lewy (CFL) condition in the vertical direction, allowing larger time steps for large horizontal-to-vertical aspect ratio simulations. The detailed description and test cases are present in Ref [5].

  • Jupiter Beta-Plane Simulation

  We present the result of Jupiter’s beta-plane simulations. The initial condition is set as a uniform moist adiabat across the horizontal plane with water vapor and ammonia vapor. The heavy element abundances are chosen to be 3 times of solar value. We use a linear body cooling scheme to simplify the radiative transfer in Jupiter’s upper troposphere (i.e., above 1 bar pressure level). The bottom temperature is relaxed back to the initial value to mimic the internal heat flux in the real situation. Winds are allowed to evolve in the troposphere freely but are damped in the stratosphere. We tried two scenarios, one with latent heat release from water and ammonia and one without. 

  Multiple eastward and westward jets are produced in both cases. Fig 1, the result of the moist case, shows that two giant cyclonic storms (i.e., radius ~ 1000 km) are also formed at jets’ interfaces where the eastward jets are in the south, and westward jets are in the north. Such regions are belts in Jupiter’s atmosphere where the fluid motion is cyclonic. In the dry case, we find that, although latent heat is removed from the system (i.e., excluding water and ammonia vapors), there are still multiple jets with the same order of magnitude zonal wind speed, but cyclones vanish. Thus, resembling hurricanes on Earth [7], latent heat from the moist convection supplies the energy to form cyclones in Jupiter’s atmosphere. 

  • Conclusions

  Here, we present the first nonhydrostatic Jovian synoptic-scale moist convection simulation to improve our understanding of Jupiter’s atmospheric dynamics. The mid-latitude beta-plane simulation suggests that jets can be freely evolved in a constant-beta plane. But cyclonic moist storms require latent heat to supply the energy for their formation. The project is still ongoing, and we have already discovered many features that resemble Jupiter’s atmosphere.

Reference:

[1] Becker, Heidi N., et al. Nature 584.7819 (2020): 55-58.

[2] Gierasch, P. J., et al. Nature 403.6770 (2000): 628-630.

[3] Little, Blane, et al. Icarus 142.2 (1999): 306-323.

[4] Li, Cheng, and Xi Chen. The Astrophysical Journal Supplement Series 240.2 (2019): 37.

[5] Ge, Huazhi, et al. The Astrophysical Journal 898.2 (2020): 130.

[6] Stone, James M., et al. The Astrophysical Journal Supplement Series 249.1 (2020): 4.

[7] Holton, James R. American Journal of Physics 41.5 (1973): 752-754.

How to cite: Ge, H., Li, C., and Zhang, X.: Cloud-Resolving Simulation of Moist Convection in Jupiter’s Atmosphere, Europlanet Science Congress 2021, online, 13–24 Sep 2021, EPSC2021-342, https://doi.org/10.5194/epsc2021-342, 2021.

EPSC2021-612
|
ECP
Saburo Howard, Tristan Guillot, Michaël Bazot, and Yamila Miguel

Abstract

The Juno spacecraft is providing measurements of Jupiter's gravity field with an outstanding level of accuracy [3], leading to better constraints on the interior of Jupiter. Improving our knowledge of the internal structure of Jupiter is key, to understand the formation and the evolution of the planet [5,6] but also in the framework of exoplanets exploration. Hence, developing interiors models of Jupiter which are consistent with the observations is essential.

Models of giant planets' internal structure are built with the code CEPAM [2] to compute the gravitational moments J2n [1] and compare them to the observational values. As the numerical calculation of the gravitational moments is crucial, we are here using a fast method based on a 4th order development of the Theory of Figures, coupled with the more precise CMS (Concentric MacLaurin Spheroid) method. This allows us to obtain reliable values of J2n in a reasonable amount of time.

MCMC (Markov chain Monte Carlo) simulations are then run to study a wide range of interior models, using the above way to compute the gravitational moments. This bayesian approach leads to a broad investigation of the parameters range such as the chemical abundances, the 1 bar temperature or the transition pressure between the molecular hydrogen and metallic hydrogen layers.

Important questions remain to be clarified like the distribution and amount of the heavy elements inside giant planets, following the hypothesis of a gradual distribution of the heavy elements up to a certain fraction of Jupiter's radius [7]. Throughout this talk, I will pay particular attention on the equations of state used in our models [4]. Indeed, giant planets' internal structure seems strongly linked to the physical properties of its components and it is critical to assess how sensitive to the equations of state our models are.

References

[1] Guillot, T., Miguel, Y. et al.: A suppression of differential rotation in Jupiter's deep interior, Nature, Vol 555, pp. 227-230, (2018).

[2] Guillot, T. and Morel, P.: CEPAM: a code for modeling the interiors of giant planets, Astronomy and Astrophysics Supplement Series 109, 109-123 (1995)

[3] Iess, L. et al.: Measurement of Jupiter's asymmetric gravity field, Nature, Vol 555, pp. 220-222, (2018).

[4] Miguel, Y., Guillot, T. et al.: Jupiter internal structure: the effect of different equations of state. Astron. Astrophys. 596, A114 (2016)

[5] Vazan, A., Helled, R. and Guillot, T.: Jupiter's evolution with primordial composition gradients. Astron. Astrophys. 610, L14 (2018).

[6] Venturini, J., Helled, R.: Jupiter's heavy-element enrichment expected from formation models. Astron. Astrophys. 634, A31 (2020).

[7] Wahl, S. M. et al.: Comparing Jupiter interior structure models to Juno gravity measurements and the role of a dilute core, Geophys. Res. Lett. Vol 44, pp. 4649-4659, (2017).

How to cite: Howard, S., Guillot, T., Bazot, M., and Miguel, Y.: Exploration of the structure of giant planets with fast calculations and a bayesian approach, Europlanet Science Congress 2021, online, 13–24 Sep 2021, EPSC2021-612, https://doi.org/10.5194/epsc2021-612, 2021.

Chairpersons: George Clark, Bertrand Bonfond, Stavros Kotsiaros
EPSC2021-762
|
ECP
Hachem Dhouib, Stéphane Mathis, Florian Debras, Aurélie Astoul, and Clément Baruteau

Gaseous giant planets (Jupiter and Saturn in our solar system and hot Jupiters around other stars) are turbulent rotating magnetic objects that have strong and complex interactions with their environment (their moons in the case of Jupiter and Saturn and their host stars in the case of hot Jupiters/Saturns). In such systems, the dissipation of tidal waves excited by tidal forces shape the orbital architecture and the rotational dynamics of the planets.

During the last decade, a revolution has occurred for our understanding of tides in these systems. First, Lainey et al. (2009, 2012, 2017) have measured tidal dissipation stronger by one order of magnitude than expected in Jupiter and Saturn. Second, unexplained broad diversity of orbital architectures and large radius of some hot Jupiters are observed in exoplanetary systems. Finally, new constraints obtained thanks to Kepler/K2 and TESS indicate that tidal dissipation in gaseous giant exoplanets is weaker than in Jupiter and in Saturn (Ogilvie 2014, Van Eylen et al. 2018, Huber et al. 2019).

Furthermore, the space mission JUNO and the grand finale of the CASSINI mission have revolutionized our knowledge of the interiors of giant planets. We now know, for example, that Jupiter is a very complex planet: it is a stratified planet with, from the surface to the core, a differentially rotating convective envelope, a first mixing zone (with stratified convection), a uniformly rotating magnetised convective zone, a second magnetized mixing zone (the diluted core, potentially in stratified convection) and a solid core (Debras & Chabrier 2019). So far, tides in these planets have been studied by assuming a simplified internal structure with a stable rocky and icy core (Remus et al. 2012, 2015) and a deep convective envelope surrounded by a thin stable atmosphere (Ogilvie & Lin 2004) where mixing processes, differential rotation and magnetic field were completely neglected.

Our objective is thus to predict tidal dissipation using internal structure models, which agree with these last observational constrains. In this work, we build a new ab-initio model of tidal dissipation in giant planets that coherently takes into account the interactions of tidal waves with their complex stratification induced by the mixing of heavy elements, their zonal winds, and (dynamo) magnetic fields. This model is a semi-global model in the planetary equatorial plane. We study the linear excitation of tidal magneto-gravito-inertial progressive waves and standing modes. We take into account the buoyancy, the compressibility, the Coriolis acceleration (including differential rotation), and the Lorentz force. The tidal waves are submitted to the different potential dissipative processes: Ohmic, thermal, molecular diffusivities, and viscosity. We here present the general formalism and the potential regimes of parameters that should be explored. The quantities of interest such as tidal torque, dissipation, and heating are derived. This will pave the way for full 3D numerical simulations that will take into account complex internal structure and dynamics of gaseous giant (exo-)planets in spherical/spheroidal geometry.


How to cite: Dhouib, H., Mathis, S., Debras, F., Astoul, A., and Baruteau, C.: Tidal dissipation modelling in gaseous giant planets at the time of space missions, Europlanet Science Congress 2021, online, 13–24 Sep 2021, EPSC2021-762, https://doi.org/10.5194/epsc2021-762, 2021.

Aurora and ionosphere
EPSC2021-808
|
ECP
|
solicited
James O'Donoghue, Luke Moore, Tanapat Bhakyapaibul, Henrik Melin, Tom Stallard, Jack Connerney, and Chihiro Tao

Jupiter's upper atmosphere is significantly hotter than expected based on the amount of solar heating it receives. This temperature discrepency is known as the 'energy crisis' due to it's nearly 50-year duration and the fact it also occurs at Saturn, Uranus and Neptune. At Jupiter, magnetosphere-ionosphere coupling gives rise to intense auroral emissions and enormous energy deposition in the magnetic polar regions, so it was presumed long ago that redistribution of this energy could heat the rest of the planet. However, most global circulation models have difficulty redistributing auroral energy globally due to the strong Coriolis forces and ion drag on this rapidly rotating planet. Consequently, other possible heat sources have continued to be studied, such as heating by gravity and acoustic waves emanating from the lower atmosphere. Each global heating mechanism would imprint a unique signature on global temperature gradients, thus revealing the dominant heat source, but these gradients have not been determined due a lack of planet-wide, high-resolution data. The last global map of Jovian upper-atmospheric temperatures was produced using ground-based data taken in 1993, in which the region between 45o latitude (north & south) and the poles was represented by just 2 pixels. As a result, those maps did not (or could not) show a clear temperature gradient, and furthermore, they even showed regions of hot atmosphere near the equator, supporting the idea of an equatorial heat source, e.g. gravity and/or acoustic wave heating. Therefore observationally and from a modeling perspective, a concensus has not been reached to date. Here we report new infrared spectroscopy of Jupiter's major upper-atmospheric ion H3+, with a spatial resolution of 2o longitude and latitude extending from pole to equator, capable of tracing the global temperature gradients. We find that temperatures decrease steadily from the auroral polar regions to the equator. Further, during a period of enhanced activity possibly driven by a solar wind compression, a high-temperature planetary-scale structure was observed which may be propagating from the aurora. These observations indicate that Jupiter's upper atmosphere is predominantly heated via the redistribution of auroral energy, and therefore that Coriolis forces and ion drag are observably overcome.

How to cite: O'Donoghue, J., Moore, L., Bhakyapaibul, T., Melin, H., Stallard, T., Connerney, J., and Tao, C.: Global upper-atmospheric heating at Jupiter by the recirculation of auroral energy, Europlanet Science Congress 2021, online, 13–24 Sep 2021, EPSC2021-808, https://doi.org/10.5194/epsc2021-808, 2021.

EPSC2021-113
|
ECP
Chiara Castagnoli, Bianca Maria Dinelli, Francesca Altieri, Alessandra Migliorini, Alessandro Mura, Maria Luisa Moriconi, Alberto Adriani, Roberto Sordini, Federico Tosi, Giuseppe Piccioni, Davide Grassi, Alessandro Moirano, Raffaella Noschese, Andrea Cicchetti, Giuseppe Sidoni, Christina Plainaki, and Angelo Olivieri

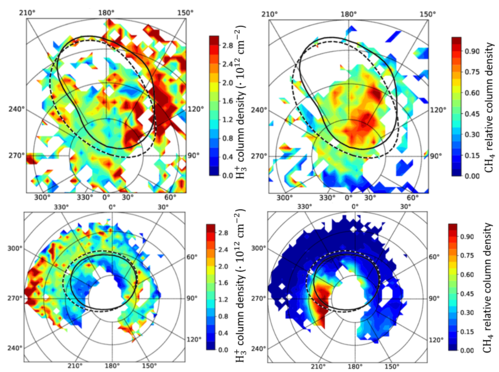
The Jovian InfraRed Auroral Mapper (JIRAM) instrument aboard NASA’s Juno spacecraft, which has been orbiting Jupiter since July 2016, is an imager/spectrometer designed to monitor the atmosphere of Jupiter and its aurorae. Due to Juno’s polar orbit, the poles of the planet have been observed with a much higher spatial resolution than previous space missions. In this work, JIRAM data measured over the polar regions have been used to derive quantitative information on the species CH4 and H3+ and on the variability of their spatial distribution in Jupiter’s auroral regions. During the first Juno’s orbit around Jupiter a large number of measurements have been collected in the auroral regions, showing both the emissions of H3+ and CH4 in the 3-4 µm spectral range. Various analyses have then been performed on JIRAM’s first sequence of observations of Jupiter’s north and south poles. Using the retrieval code developed to analyse JIRAM spectra, the H3+ effective temperatures and column densities (CD) have been retrieved. Moreover, considering the detection of methane emissions in the Jovian aurorae, in the retrieval analysis the CH4 contribution to the spectral signature has been considered and the methane’s column density has also been retrieved. In light of such results, this work aims to integrate the work already done on JIRAM’s auroral observations acquired at nadir over Jupiter’s poles during the first Juno’s orbit and to extend it to the subsequent orbits where the instrument provided an optimal coverage of the auroral regions.

In this study, JIRAM spectra have been analysed in the spectral region from 3 to 4 μm, that is particularly favourable for the study of the auroral emissions due to the quasi-total absorption of the incoming solar radiation from the lowest layers of Jupiter atmosphere. Starting from the data previously analysed for the orbit JM0003, the dataset has been enlarged to include observations outside the auroral ovals with a lower signal and extending the analysis to successive orbits. The first 10 Juno’s orbits, from JM0003 to JM0091, covering overall the period August 2016-October 2017, have been examined to detect the ones with both good polar coverage of the spectrometer measurements and good signal to noise ratio (table1). Along to the JM0003, where both the polar regions have been successfully covered, the orbits JM0071 and JM0081 have been found particularly promising for the study of the southern auroral region.


                                                           table 1 Number of spectra analysed for each of the selected orbits.

The selected spectra show the presence of  and emissions in both the southern and the northern auroras and have been analysed using an inversion technique based on a Bayesian approach. Preliminary tests have allowed the optimization of the a-priori information vector and the corresponding error for the new dataset (table 2). These tests have highlighted that only the abundances of the two species and the H3+ temperature could be independently retrieved. The other parameters have been set to average values found in the preliminary tests where all the variables listed in table 2 have been retrieved.


                                                   table 2 Input values of the retrieval parameters and the relative a-priori errors.

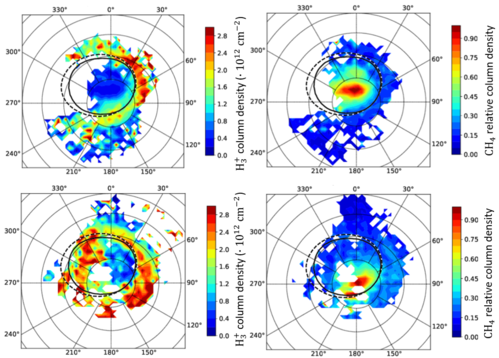
The results of this work have confirmed the presence of a significant concentration of methane within the auroral oval in both polar regions and found comparable abundances of H3+ in the two auroral regions, with values generally ranging from 2.0·1012 cm-2 to 2.8·1012 cm-2 with some peaks larger than 2.8·1012 cm-2 (figure 1 and 2). Moreover, as already suggested by previous studies, an anticorrelation between H3+ CD and T has been observed. The H3+ temperatures appear lower in the south aurora, where on average the values do not exceed 800 K, while in the northern aurora the temperatures span between 800 K  and 950 K . Also, the retrieval of background spectra has highlighted new auroral features, not previously observed. Finally, a comparison of these results with the images acquired by the JIRAM imager has allowed to study the morphology of the Jovian aurorae and to highlight the shifting over the time of a few degrees westward of the south aurora. 


         figure 1 Distribution maps of the (left) and (right) retrieved column densities the orbit JM0003: (top) north pole, (bottom) south pole.


figure 2 Distribution maps of the  (left) and  (right) column densities retrieved in Jupiter’s southern aurora for the orbit JM0071 (top) and JM0081 (bottom).

How to cite: Castagnoli, C., Dinelli, B. M., Altieri, F., Migliorini, A., Mura, A., Moriconi, M. L., Adriani, A., Sordini, R., Tosi, F., Piccioni, G., Grassi, D., Moirano, A., Noschese, R., Cicchetti, A., Sidoni, G., Plainaki, C., and Olivieri, A.: Study of Jupiter’s auroral regions through the measurement of the Juno/JIRAM instrument, Europlanet Science Congress 2021, online, 13–24 Sep 2021, EPSC2021-113, https://doi.org/10.5194/epsc2021-113, 2021.

EPSC2021-753
|
ECP
Joshua Dreyer, Erik Vigren, Oleg Shebanits, Michiko Morooka, Jan-Erik Wahlund, and Jack Hunter Waite

During the Grand Finale of the Cassini mission, the southern hemisphere of Saturn was shadowed by its rings and the substructures within, whose more intense shadows can be mapped to specific ionospheric altitudes. We successfully connect small-scale variations (dips) in the ionospheric H2+ density below 2500 km, measured by the Ion and Neutral Mass Spectrometer (INMS) during orbits 288 and 292, to the shadows of individual ringlets and plateaus in the C Ring. From the H2+ density signatures we estimate lower limits of the associated ringlet or plateau opacities. These will be compared with results obtained from stellar occultations. Potential implications/constraints on the ionospheric dynamics will be discussed. The ringlet and plateau shadows are not associated with obvious dips in the electron density.

How to cite: Dreyer, J., Vigren, E., Shebanits, O., Morooka, M., Wahlund, J.-E., and Waite, J. H.: Identifying ionospheric shadowing signatures of ringlets and plateaus in Saturn's C Ring, Europlanet Science Congress 2021, online, 13–24 Sep 2021, EPSC2021-753, https://doi.org/10.5194/epsc2021-753, 2021.

EPSC2021-821
George Clark, Chris Paranicas, Joseph Westlake, Barry Mauk, Peter Kollmann, Randy Gladstone, Thomas Greathouse, and William Dunn

Remote observations clearly show that soft X-ray emissions at Jupiter concentrate poleward of the main oval forming a so-called “hot spot” (Gladstone et al., 2002; Dunn et al., 2016). One hypothesis proposes that the X-rays are likely produced from precipitating energetic heavy ions that become fully stripped via interactions in Jupiter’s upper atmosphere; however, the details regarding the ion source and acceleration mechanism(s) of the soft X-ray (~2 keV) component is still an active area of research. NASA’s Juno mission – a Jupiter polar orbiting spacecraft – is shedding light onto this mystery with in situ observations of the energetic particle environment over the poles, and coordinated observing campaigns with Earth-orbiting X-ray observatories, e.g., Chandra and XMM-Newton. Recent ideas supported by Juno data include: 1) pitch angle scattering of energetic ions via electromagnetic ion cyclotron waves in the outer magnetosphere (Yao et al., 2021); and 2) acceleration of ions to several MeV over Jupiter’s poles via field-aligned electric potentials (Clark et al., 2017; Haggerty et al., 2017; Clark et al., 2020; Yao et al., 2021). New techniques have been recently developed to push the capabilities of Juno’s Jupiter Energetic particle Detector Instrument (JEDI) to measure the > 10 MeV ions (Westlake et al., 2019; Kollmann et al., 2020). In this presentation, we utilize these techniques to characterize the precipitating fluxes of > 10 MeV ions over Jupiter’s polar region with the goal of better understanding the sources of Jupiter’s X-ray auroral emissions.

How to cite: Clark, G., Paranicas, C., Westlake, J., Mauk, B., Kollmann, P., Gladstone, R., Greathouse, T., and Dunn, W.: Energetic Ion Precipitation in Jupiter’s Polar Auroral Region Observed by Juno/JEDI, Europlanet Science Congress 2021, online, 13–24 Sep 2021, EPSC2021-821, https://doi.org/10.5194/epsc2021-821, 2021.

Magnetosphere
EPSC2021-829
|
solicited
Binzheng Zhang

The classic Dungey cycle plays an essential role in understanding the dynamics of the terrestrial magnetosphere. However, its direct applicability to planetary magnetospheres such as Jupiter is limited, especially when the planetary rotation is much faster than the Earth. We use a series of numerical experiments to show the transition of the terrestrial magnetosphere from a classic Dungey cycle, convection-dominated system to rotation-dominated configurations. The numerical experiments use the Earth's magnetosphere-ionosphere system as a testbed, with modified rotation speed to increase the influence of planetary rotation over solar wind driving, characterized by the ratio between the solar wind merging potential and the polar cap rotation potential. Results show that when the rotation potential of the polar magnetosphere becomes comparable to the merging potential of the solar wind, the classic Dungey cycle is modified by azimuthal transport of magnetic flux, resulting in a more closed polar magnetosphere with a crescent-shaped open flux region in the ionosphere. These numerical experiments provide a theoretical framework for understanding the fundamentals of magnetospheric physics, which is potentially applicable to the Saturn, Jupiter, and exo-planetary systems.

How to cite: Zhang, B.: The Open Polar Cap of Rotating Magnetospheres, Europlanet Science Congress 2021, online, 13–24 Sep 2021, EPSC2021-829, https://doi.org/10.5194/epsc2021-829, 2021.

EPSC2021-569
|
ECP
Aneesah Kamran, Emma Bunce, Stanley Cowley, Jonathan Nichols, and Gabrielle Provan

We present a comparison of magnetic field data collected by the NASA Juno spacecraft, with the magnetosphere-ionosphere (MI) coupling model for the Jovian system developed by the University of Leicester. We study the magnetic field of Jupiter, in the Northern Hemisphere, for Perijoves 1-13. By virtue of the offset of the magnetic field to the rotation axis and the subsequent “wobble” of the Juno trajectory in magnetic coordinates, these northern hemisphere portions of PJs 1-13 see the spacecraft traversing the magnetic field lines connecting to the inner, middle, outer and tail regions of the magnetosphere. As such, even away from the close Perijove period, the observations contain evidence of the expected magnetic field perturbations associated with field-aligned currents associated with this fundamental MI coupling. In this study, therefore, we focus on investigating the nature of the field-aligned current signatures evident in the residual azimuthal field (having subtracted the Connerney et al 2018 JRM09 internal magnetic field model) along the magnetic field lines outside of the close periapsides. We map the residual azimuthal field signatures into the ionosphere, and calculate the corresponding ionospheric Pedersen current on an orbit by orbit basis. We compare the magnitude and distribution of these field-aligned current signatures to those expected from the Leicester model, and consider the observed orbit-by-orbit variation as a function of ionospheric colatitude and longitude. We deduce estimates for the field-aligned current densities on auroral field lines for each observation using the Pedersen currents and their distribution in co-latitude, and compare to the previous work of Kotsiaros et al [2019]. We discuss possible reasons for the variations we see, and present the next steps of our broader analysis.

How to cite: Kamran, A., Bunce, E., Cowley, S., Nichols, J., and Provan, G.: Azimuthal field signatures associated with magnetosphere-ionosphere coupling in the Jovian magnetosphere: Comparison between Juno observations and theoretical modelling, Europlanet Science Congress 2021, online, 13–24 Sep 2021, EPSC2021-569, https://doi.org/10.5194/epsc2021-569, 2021.

EPSC2021-439
|
ECP
Zhi-Yang Liu, Qiu-Gang Zong, and Michel Blanc

Jupiter's magnetosphere contains a current sheet of huge size near its equator. The current sheet not only mediates the global mass and energy cycles of Jupiter's magnetosphere, but also provides an occurring place for many localized dynamic processes, such as reconnection and wave-particle interaction. To correctly evaluate its role in these processes, a statistical description of the current sheet is required. To this end, here we conduct statistics on Jupiter's current sheet, with four-year Juno data recorded in the 20-100 Jupiter radii, post-midnight magnetosphere. The results suggest a thin current sheet whose thickness is comparable with the gyro-radius of dominant ions. Magnetic fields in the current sheet decrease in power-law with increasing radial distances. At fixed energy, the flux of electrons and protons increases with decreasing radial distances. On the other hand, at fixed radial distances, the flux decreases in power-law with increasing energy. The flux also varies with the distances to the current sheet center. The corresponding relationship can be well described by Gaussian functions peaking at the current sheet center. In addition, the statistics show the flux of oxygen- and sulfur-group ions is comparable with the flux of protons at the same energy and radial distances, indicating the non-negligible effects of heavy ions on current sheet dynamics. From these results, a statistical model of Jupiter's current sheet is constructed, which provides us with a start point of understanding the dynamics of the whole Jupiter's magnetosphere.

How to cite: Liu, Z.-Y., Zong, Q.-G., and Blanc, M.: Statistics on Jupiter's Current Sheet with Juno Data: Geometry, Magnetic Fields and Energetic Particles, Europlanet Science Congress 2021, online, 13–24 Sep 2021, EPSC2021-439, https://doi.org/10.5194/epsc2021-439, 2021.

EPSC2021-603
Elias Roussos, Christina Cohen, Peter Kollmann, Marco Pinto, Patricia Gonçalves, Norbert Krupp, and Konstantinos Dialynas

Jupiter's radiation belts constitute a multi-component system, trapping high intensities of electrons, protons and heavier ions. We revisit measurements from Galileo's Heavy Ion Counter (HIC) instrument, a high-quality dataset that extends considerably the energy range covered by Galileo/EPD and Juno/JEDI (<10 MeV/n) up to ~100 MeV/n, providing key complementary observations for those two instruments in the equatorial radiation belts. Thanks to HIC's large geometry factor and event-based measurement capabilities, the instrument clearly resolves trace ions of both heliospheric and magnetospheric origin, such as Carbon, Nitrogen, Sodium, Magnesium, Iron and others, besides the much more abundant Oxygen and Sulfur. In this work we re-evaluate aspects of HIC's calibration, particularly for the analysis of measurements obtained at the innermost, intense radiation belts of Jupiter, which are currently monitored by Juno. We concentrate on previously unpublished observations from Galileo's last two orbits, reaching inward of Amalthea's orbit, including a close flyby of this moon. We show that the structure and composition of the heavy ion belts depends strongly on energy, L-shell and pitch angle. We find that above 50 MeV/n, Jupiter's heavy ion radiation belts are dominated by oxygen, appearing stable and are highly structured by strong losses at the orbits of Io, Thebe and Amalthea, a structure reminiscent of that observed in Saturn's proton radiation belts. In addition, heavy ion spectra and the corresponding phase space density profiles indicate that a local source of energy exists at least inward of Amalthea, accelerating oxygen above 100 MeV/n and sulphur above ˜50 MeV/n. Between the orbits of Io and Amalthea, PSD profiles indicate contributions from local and adiabatic acceleration for both ion species, with the former dominating at the highest energies resolved in that region (˜50 MeV/n). In conclusion, unlike Earth's radiation belts, where the highest energy protons or ions observed reach the terrestrial magnetosphere pre-accelerated to the MeV range in the form of solar, anomalous or galactic cosmic rays, Jupiter can efficiently accelerate oxygen and sulphur, which originate at at eV energies at Io and its torus, by 7-8 decades in energy.

How to cite: Roussos, E., Cohen, C., Kollmann, P., Pinto, M., Gonçalves, P., Krupp, N., and Dialynas, K.: Evidence for local acceleration of heavy >10 MeV/n oxygen and sulphur in Jupiter's innermost radiation belts, Europlanet Science Congress 2021, online, 13–24 Sep 2021, EPSC2021-603, https://doi.org/10.5194/epsc2021-603, 2021.

EPSC2021-624
Noé Clément, Sariah Al Saati, Michel Blanc, Yuxian Wang, Nicolas André, Corentin Louis, Laurent Lamy, Pierre-Louis Blelly, Philippe Louarn, Aurélie Marchaudon, and Chihiro Tao

The dynamics of the Kronian magnetosphere is controlled by the complex interplay of the planet’s fast rotation, its solar-wind interaction and its main plasma sources at Enceladus and other moons. At the ionospheric level, these MIT coupling processes can be characterized by a set of key parameters which include ionospheric conductances, currents and electric fields, exchanges of particles along field lines and auroral emissions. Knowledge of these key parameters in turn makes it possible to estimate the net deposition/extraction of momentum and energy into/out of the Kronian upper atmosphere. In this talk we will apply to Cassini high-inclination, F-ring and Grand Finale orbits the method developed and tested by Wang et al. (JGR 2021, under review) for Juno studies. We will combine Cassini multi-instrument data (MAG, CAPS, MIMI, UVIS and RPWS) with adequate modelling tools and data bases to retrieve these key parameters along the Cassini magnetic footprint and across the north and south auroral ovals. We will present preliminary distributions of conductances, electric currents and electric fields obtained from these orbits and will compare them with model predictions.

How to cite: Clément, N., Al Saati, S., Blanc, M., Wang, Y., André, N., Louis, C., Lamy, L., Blelly, P.-L., Louarn, P., Marchaudon, A., and Tao, C.: Magnetosphere-Ionosphere-Thermosphere Coupling study at Saturn Based on Cassini high-latitude and Grand Finale Orbits and Modelling Tools, Europlanet Science Congress 2021, online, 13–24 Sep 2021, EPSC2021-624, https://doi.org/10.5194/epsc2021-624, 2021.

EPSC2021-707
Laurent Lamy, Lucas Colomban, and Philippe Zarka

The prominent component of Jovian decametric (auroral) emissions is induced by Io. Io decametric emissions (Io-DAM) have thus been monitored on a regular basis by Earth- or Space-based radio observatories for several decades. They display a typical arc-shaped structure in the time-frequency plane which results from the motion of the Io flux tube relative to the observer convolved with the anisotropic radio emission cone. Remote determination of the Io-DAM beaming pattern was used to check the emission conditions at the source (e.g. Queinnec & Zarka, 1998). It has been done at several occasions using various models of magnetic field/lead angles which introduce significant uncertainties. Nevertheless, Io-DAM arcs were shown to be consistent with oblique emissions triggered by the Cyclotron maser Instability from loss-cone electron distributions of a few keVs (Hess et al., 2008). The CMI validity for Jovian DAM and the prominence of loss cone electron distributions has been later confirmed by Juno in situ measurements (e.g. Louarn et al, 2017). In this study, we took advantage of simultaneous radio/UV or bi-point stereoscopic radio measurements provided by Juno/Waves, the Nançay Decameter Array and the Hubble Space Telescope to unambiguously derive the beaming pattern of several Io-DAM arcs and compare it with theoretical expectations. We then assess the energy of CMI-unstable auroral electrons at the source and discuss our results at the light of similar independent studies reaching different conclusions.

How to cite: Lamy, L., Colomban, L., and Zarka, P.: Probing the Jupiter-Io interaction with synergistic measurements of radio and ultraviolet auroral emissions from Juno, Nançay and HST observatories, Europlanet Science Congress 2021, online, 13–24 Sep 2021, EPSC2021-707, https://doi.org/10.5194/epsc2021-707, 2021.

EPSC2021-734
Sariah Al Saati, Noé Clément, Michel Blanc, Yuxian Wang, Nicolas André, Corentin Louis, Laurent Lamy, Pierre-Louis Blelly, Philippe Louarn, Aurélie Marchaudon, Jean-Claude Gérard, Bertrand Bonfond, Denis Grodent, Bianca Maria Dinelli, Alberto Adriani, Alessandro Mura, Barry Mauk, George Clark, Frederick Allegrini, and Scott Bolton and the co-authors

The dynamics of the Jovian magnetosphere is controlled by the complex interplay of the planet’s fast rotation, its solar-wind interaction and its main plasma source at the Io torus. At the ionospheric level, these MIT coupling processes can be characterized by a set of key parameters which include ionospheric conductances, currents and electric fields, exchanges of particles along field lines and auroral emissions. Knowledge of these key parameters in turn makes it possible to estimate the net deposition/extraction of momentum and energy into/out of the Jovian upper atmosphere. In this talk we will extend to the first thirty Juno science orbits the method described in Wang et al. (JGR 2021, under review) which combines Juno multi-instrument data (MAG, JADE, JEDI, UVS, JIRAM and WAVES), adequate modelling tools and data bases to retrieve these key parameters along the Juno magnetic footprint and across the north and south auroral ovals. We will present preliminary distributions of conductances, electric currents and electric fields obtained from these orbits and will compare them with model predictions.

How to cite: Al Saati, S., Clément, N., Blanc, M., Wang, Y., André, N., Louis, C., Lamy, L., Blelly, P.-L., Louarn, P., Marchaudon, A., Gérard, J.-C., Bonfond, B., Grodent, D., Dinelli, B. M., Adriani, A., Mura, A., Mauk, B., Clark, G., Allegrini, F., and Bolton, S. and the co-authors: Magnetosphere-Ionosphere-Thermosphere Coupling study at Jupiter Based on Juno First 30 Orbits and Modelling Tools, Europlanet Science Congress 2021, online, 13–24 Sep 2021, EPSC2021-734, https://doi.org/10.5194/epsc2021-734, 2021.

EPSC2021-751
Igor Alexeev, Anastasiia Lukashenko, Yuri Sasunov, Elena Belenkaya, and Alexander Lavrukhin

Jovian magnetosphere has a huge equatorial plasma disk, which is also known as the current sheet or magnetodisk. This current sheet enlarges the subsolar magnetosphere size more than twice compared to a purely planetary dipole magnetosphere. Past and current space missions, such as Galileo, JUNO, etc. have shown showed the presence of different sorts of particles in the plasma disk that emphasizes the multi-kinetic nature of Jovian magnetodisk.

In our work we develop a multi-spices self-consistent model of the Jovian plasmadisk based on the kinetic approach. As the initial magnetic field model we use a model of infinitely thin magnetodisk (Alexeev & Belenkaya, 2005). Calculations revealed that different spices contribute to the current at different scales, also it was possible to show that different particles with different energies and pitch angles can significantly increase the electric current locally. The kinetic scales of the self-consistent plane current sheets have been studied by Sasunov et al. (2015, 2021) and we, following these trajectories methods, generalized the results to the geometry of the radial plasma outflow.

Shortly a plan of the study is:

1. We start from test particles calculation, in which magnetic field is determined as a sum of the Jupiter's dipole and equatorial disk current's field from the Alexeev and Belenkaya (2005). The described region is located from the planet, RJ, till spherical surface with radius about 100 RJ. The main attention is focused on the middle magnetosphere between 20 RJ and 60 RJ. As demonstrated by our analysis, near to the equatorial plane the magnetospheric field can be described by the simple model with opposite direction of the Bρ and Bφ in the northern and southern hemispheres. Both components of the field vector, as well as normal component Bθ, decrease with distance ρ as ρ-1. As a result, the same behavior will have an azimuthal and radial currents in the disk. The field lines inclination angle to equatorial plane is small and approximately constant (about 20°).

2. Outside of the plasma disk (z> D, where D~2.5 RJ is a disk thickness) the adiabatic approach is valid, and we can calculate the moments of the distribution function f(r,v) in a drift approximation. Out of the disk the electric current created by particles is small, but near the disk (z< D) the particles with small pitch angles form the current. If particle density is high enough, then 2Bρ0 Jφ, where Jφ=∫evφf(r,v)dГ, where is a volume element of the phase space. So, the structure is self-consistent. The plasma sources include both iogenic and ionospheric (upper thermospheric) cold ions, which are accelerated by electric field at the disk region. Finally, the plasma velocity is about Alfvenic velocity.

3. In numerical calculations we control a phase position at z=0 (in the equatorial plane).

4. Comparison of the results with trajectories which can be found from condition of the particle magnetic moment conversation.

5. Azimuthal symmetry leads to conversation of the general moment of particle and this integral of motion limits the radial distance interval, in which the equatorial distances of the guiding center field lines are confined.

Figure 1. 3D trajectories of particles with different phase angles, crossing the infinitely thin current sheet at z=0 (coloured red and brown). Magnetic field line is shown (purple dotted line). Here, six particles with small pitch-angles, which crossed equatorial plane 4 times before reflection from equatorial plane (3 particles) or going to bottom hemisphere (also 3 particles) are shown. All particles have the same initial pitch-angle but different Larmor phases. The destiny of particles depends on the phase value, but a final (after moving away from the disk) pitch angle is the same and is determined by magnetic moment conservation.

References

1) Alexeev, I. I. and Belenkaya, E. S.: Modeling of the Jovian Magnetosphere, Ann. Geophys., 23, 809–826, https://doi.org/10.5194/angeo-23-809-2005, 2005.

2) Sasunov, Y. L.Khodachenko, M. L.Alexeev, I. I.Belenkaya, E. S.Semenov, V. S.Kubyshkin, I. V., and Mingalev, O. V. (2015), Investigation of scaling properties of a thin current sheet by means of particle trajectories studyJ. Geophys. Res. Space Physics1201633– 1645. doi: 10.1002/2014JA020486.

3) Yu. L. SasunovM. L. KhodachenkoI. V. KubyshkinN. DwivediI. I. AlexeevE. S. BelenkayaH. V. Malova, and N. Kulminskaya, "Transient particle acceleration by a dawn–dusk electric field in a current sheet", Physics of Plasmas 28, 042902 (2021) https://doi.org/10.1063/5.0037060

Acknowledgements

This research work is partly supported by the joint RFBR and DFG grant No 21-52-12025\21. Authors thanks the Europlanet RI 2024 grant and virtual observatory VESPA for cooperations.

How to cite: Alexeev, I., Lukashenko, A., Sasunov, Y., Belenkaya, E., and Lavrukhin, A.: Kinetic nature of Jovian magnetodisk, Europlanet Science Congress 2021, online, 13–24 Sep 2021, EPSC2021-751, https://doi.org/10.5194/epsc2021-751, 2021.

EPSC2021-794
Dave Constable, Licia Ray, Sarah Badman, Chris Arridge, Chris Lorch, and Herbert Gunell

Since arriving at Jupiter, Juno has observed instances of field-aligned proton and electron beams, in both the upward and downward current regions. These field-aligned beams are identified by inverted-V structures in plasma data, which indicate the presence of potential structures aligned with the magnetic field. The direction, magnitude and location of these potential structures is important, as it affects the characteristics of any resultant field-aligned current. At high latitudes, Juno has observed potentials of 100’s of kV occurring in both directions. Charged particles that are accelerated into Jupiter’s atmosphere and precipitate can excite aurora; likewise, particles accelerated away from the planet can contribute to the population of the magnetosphere.

Using a time-varying 1-D spatial, 2-D velocity space Vlasov code, we examine magnetic field lines which extend from Jupiter into the middle magnetosphere. By applying and varying a potential difference at the ionosphere, we can gain insight into the effect these have on the plasma population, the potential structure, and plasma densities along the field line. Utilising a non-uniform mesh, additional resolution is applied in regions where particle acceleration occurs, allowing the spatial and temporal evolution of the plasma to be examined. Here, we present new results from our model, constrained, and compared with recent Juno observations, and examining both the upward and downward current regions.

How to cite: Constable, D., Ray, L., Badman, S., Arridge, C., Lorch, C., and Gunell, H.: Magnetic Field Aligned Potentials as an Acceleration Mechanism at Jupiter, Europlanet Science Congress 2021, online, 13–24 Sep 2021, EPSC2021-794, https://doi.org/10.5194/epsc2021-794, 2021.

EPSC2021-816
|
ECP
Georgios Xystouris, Christopher Stephen Arridge, Michiko Morooka, and Jan-Erik Wahlund

The Langmuir Probe (LP) onboard Cassini was one of the three experiments that could measure the cold inner magnetospheric plasma, along with the Radio and Plasma Waves Science (RPWS) and the Cassini Plasma Spectrometer (CAPS). While the century-old LP theory looks quite straight-forward, in reality things are much more complicated.

The operation of the LP is quite simple: by applying positive bias voltages, the probe attracts the electrons and repels the ions of the surrounding plasma. From the resulting current-voltage curve characteristics of the ambient electrons can be estimated, i.e. density and temperature. When negative bias voltages are applied to the probe the characteristics of the ambient ions can be estimated, i.e. density, temperature, and mass.

Though the LP operation and interpretation are quite simple and straightforward, there are assumptions made and therefore the theoretical models may not always reflect the actual plasma conditions in Saturn’s magnetosphere. For this study we are focused on the effect of the photoelectrons, i.e. electrons that are generated by the incident sunlight on Cassini’s surfaces, which are difficult to be observed and corrected for in a laboratory plasma.

We developed a robust algorithm that identifies the transitions of the LP in and out of shadow caused by the Saturn and its rings. The LP data inside and outside the eclipses are compared using the algorithm developed. In this presentation we will discuss the impact of the photoelectron generation from the spacecraft surfaces to the LP current-voltage curves, and understand the variations of the measured plasma density connected with the photoelectrons.

How to cite: Xystouris, G., Arridge, C. S., Morooka, M., and Wahlund, J.-E.: Studying Cassini’s photoelectrons during a series of solar eclipses in Saturn, using data from Cassini's Langmuir Probe, Europlanet Science Congress 2021, online, 13–24 Sep 2021, EPSC2021-816, https://doi.org/10.5194/epsc2021-816, 2021.