
Blocks Size Frequency Distribution in the Tiger Stripes area (Enceladus)
 1,1,
1,1,- 1INAF-Astronomical Observatory of Padova, Vic. Osservatorio 5, 35122 Padova, (maurizio.pajola@inaf.it)
- 2Department of Physics and Astronomy “G. Galilei”, Università di Padova, 35122 Padova, Italy.
Introduction
Enceladus is a heavily cratered, ~500 km-size icy moon of Saturn [1], orbiting at ~4 Saturn radii from the planet. In 2005, the Cassini ISS-NAC camera [2] took high-resolution images of the moon’s surface [3], revealing an almost craterless, fracture-dominated and geologically active province surrounding the South Pole of Enceladus, called the South Polar Terrain (SPT, [4]). Inside the SPT cryovolcanic and tectonic activities are evident [4–6], with icy geysers emanating water vapor plumes from four fractures [3], called tiger stripes (hereafter named TS). The cause of such jets is related to normal tensile stresses that open vertical pathways inside the TS [7]. The fractures open and close from apocenter to pericenter [8], hence reaching the ocean that is located between 5 to 40 km underneath [9,10].
To study the TS rugged floors, three Enceladus close flybys have been performed by Cassini in 2008-2009. The returned m-scale images showed that the spacing of geysers is uniform along the three most active tiger stripes (Damascus, Bagdad and Cairo Sulci, [11]). Moreover, the ISS-NAC images revealed the presence of icy blocks located in the SPT (hereafter called blocks), situated in close proximity to the TS. Martens et al. [12] focused on the spatial density of such features, highlighting how impact cratering cannot be considered as the source of the SPT blocks, nor seismic disturbance or mass wasting. Instead, sublimation processes and ballistic emplacement through geysers eruption and/or tectonic disruption of lithospheric ice can be the source of the blocks.
The identification of the size-frequency distribution (SFD) of blocks and the corresponding curve fitting is a useful mean to provide hints on formative and/or degradation processes of such features, as showed on the Moon, Mars, asteroids and comets [13-16]. Therefore, we decided to expand the work of [12] analyzing the size-distance relation between the blocks and the fractured TS, and obtaining the SFD of the blocks in the TS area, hence suggesting their generation processes.
Dataset and Results
Through eight ISS-NAC images of the TS (with resolutions from 11.5 to 31.9 m, Fig. 1), we have identified 17070 blocks with sizes from ~30 to 366 m. The resulting histogram of all counts is presented in Fig. 2A. Afterwards, we identified the blocks SFD and its fitting curve to provide new insights into the formation and/or degradation processes characterizing these features. By using the Clauset et al. [17] methodology we derived that the TS blocks SFD can be fitted by a power-law curve, with a power-law of -5.4±0.4 (Fig. 2B).
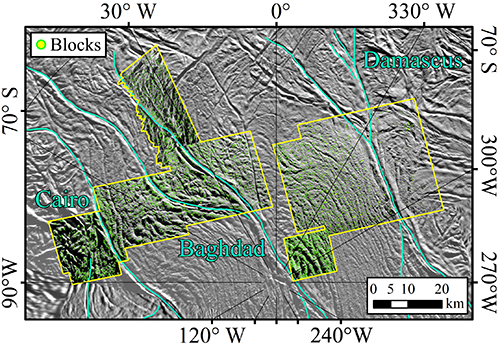
Figure 1. The blocks identified in the TS area.
To evaluate any possible differences in SFD per km2, we decided to split the full dataset of blocks into three main groups [18]: the Damascus, Baghdad and Cairo ones. The same methodology applied on the three TS returned a power-law index of -5.1±0.4 for the Damascus case, -5.1±0.3 for Baghdad TS, while a power-law index of -6.3±0.3 for the Cairo area. We explain these results considering that different processes concur in the formation and evolution of such blocks [18], in particular sublimation and cryovolcanic ejection mechanisms [12].
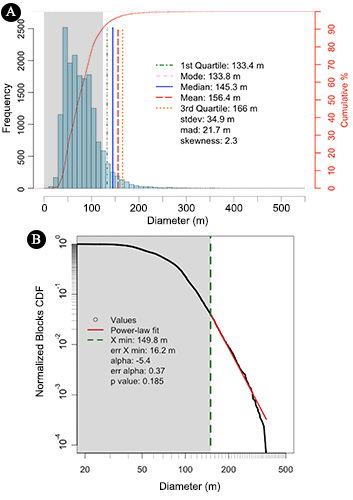
Figure 2. A) Frequency histogram of all blocks identified. B) Normalized CDF.
Discussion and Conclusion
To support our findings, we compared the TS SFDs with comet 67P, the only other case of an icy surface with boulders’ fields located on different morphological settings identified so far. In particular, the 67P Hathor cliff shows ubiquitous fracture pattern with several departing jets, and it presents a similar SFD (-5.2+0.5/-0.6, [19]) to the Damascus and Baghdad ones. The sublimation and fracturing processes explaining the Hathor SFD can be applied also to the TS SFD, suggesting that such mechanisms may favor similar fractures development in the icy matrix, resulting in comparable block disaggregation. For the Cairo case, the steeper power-law index may be indicative of a high degree of fragmentation that could be related to a locally higher degree of tectonic disruption of lithospheric ice, resulting in a larger presence of smaller size blocks. Since Cairo’s morphological setting shows no specific differences with respect to Damascus or Baghdad, this steeper power-law index requires further investigation.
We also investigated the block diameter versus TS distance trend to test if the cryovolcanic ejection mechanism suggested by [12] can be a possible block formation process. From our counts (Fig. 3), we identified that the smallest blocks are present from tens of m to maximum distances of 25 km from the TS fissures, while the largest blocks (100s m wide) are generally found at much closer range. This result positively supports the vent eruption hypothesis, which foresees that larger blocks usually land closer to the ejection point.
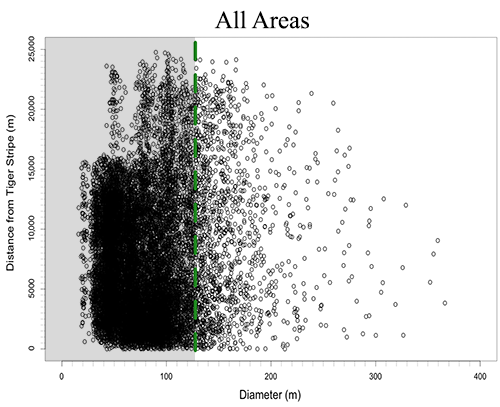
Figure 3: Diameter versus TS distance obtained for all counts.
In this context, future space missions dedicated to icy worlds will be fundamental. In particular, the images of the ESA/JUICE and NASA/EuropaClipper missions will allow to compare and expand the presented study also to the icy surfaces of Europa, Ganymede and Callisto.
Acknowledgments: This activity has been realized under the ASI-INAF contract 2018-25-HH.0.
References: [1] Smith, B.A., et al., 1981. Science 212, 163. [2] Porco, C.C., et al., 2004. SpaceSci.Rev. 115, 363. [3] Porco, C.C., et al., 2006. Science, 311, 1393. [4] Crow-Willard, E.N. & Pappalardo, R.T, 2015. JGRPlanets, 120, 928. [5] Yin, A., & Pappalardo, R. T. (2015). Icarus, 260, 409. [6] Rossi, C. et al., 2020. JGRPlanets, 125, e2020JE006471. [7] Porco, C.C, et al., 2014. Astron.J., 148:45. [8] Hedman, M.M., et al., 2013. Nature, 500, 182. [9] Iess, L., et al., 2014. Science 344, 78. [10] Lucchetti, A., et al., 2017. Icarus, 297, 252. [11] Helfenstein, P. & Porco, C.C., 2015. Astron.J., 150:93. [12] Martens, H. R., et al., 2015. Icarus, 245, 162. [13] Pajola, M., et al., 2019. Planet.SpaceSci. 165, 99. [14] Pajola, M., et al., 2017. Icarus 296, 73. [15] DellaGiustina, D.N., et al., 2019. Nat.Astron., 3(4), 341. [16] Pajola, M., et al., 2017. Nat.Astron. 1, 0092. [17] Clauset, A., et al., 2009. SIAMReview, 51(4), 661. [18] Pajola, M. et al., 2021. Universe, 7, 82. [19] Pajola et al., 2015. A&A 583, A37.
How to cite: Pajola, M., Lucchetti, A., Senter, L., and Cremonese, G.: Blocks Size Frequency Distribution in the Tiger Stripes area (Enceladus) , European Planetary Science Congress 2021, online, 13–24 Sep 2021, EPSC2021-2, https://doi.org/10.5194/epsc2021-2, 2021.