OPS2
Session assets
Please decide on your access
Please use the buttons below to download the presentation materials or to visit the external website where the presentation is linked. Regarding the external link, please note that Copernicus Meetings cannot accept any liability for the content and the website you will visit.
Forward to presentation link
You are going to open an external link to the presentation as indicated by the authors. Copernicus Meetings cannot accept any liability for the content and the website you will visit.
We are sorry, but presentations are only available for users who registered for the conference. Thank you.
Oral and Poster presentations and abstracts
Abstract
The Juno Extended Mission (EM) presents the first opportunity to acquire gravity measurements of the Galilean satellites after the Galileo mission, ended almost 20 years ago. On June 7th, 2021, Juno will flyby Ganymede with a closest approach altitude of ~1050km and a relative velocity of ~18.5 km/sec. This will be the first time that a probe acquires gravity measurements of Ganymede since December 28th, 2000, when Galileo performed G29, its last flyby of this Galilean moon.
In total, the Galileo probe performed 6 flybys of Ganymede, among which only 4 had coherent two-way S-band Doppler tracking during the closest approach, and could be used to estimate the gravity field of Ganymede. The very first analysis of these data, used only two flybys, G1 and G2, and estimated J2 and C22 applying the hydrostatic equilibrium constraint (J2/C22 = 10/3) (Anderson et al., 1996). The analysis concluded that Ganymede’s internal structure is likely formed by a metallic core surrounded by a silicate mantle enclosed by an ice shell. A subsequent gravity field analysis was unable to fit all tracking data (G1, G2, G7 and G29) without including a high degree gravity field nor obtain a physical interpretation of the results (Schubert et al., 2004). These problems could be solved only by adding mass anomalies to the dynamical model of Ganymede’s interior (Anderson et al., 2004; Palguta et al., 2006).
This new encounter, (G34), during Juno’s EM, offers the possibility of improving the knowledge on the gravity field of Ganymede. The gravity field of a body can be estimated through the reconstruction of the probe’s trajectory during a close encounter, exploiting the dynamical Doppler shift of a highly stable microwave carrier, induced by the relative motion between the DSN stations on the Earth and the probe. During G34, through which Juno will also perform a radio occultation experiment, the spacecraft will use simultaneously the X/X and X/Ka radio links. An accurate range-rate noise budget led us to the conclusion that we can expect an accuracy of 0.025 mm/s, at 60 s integration time, compatible to the accuracy acquired during PJ13 and PJ27, where the same radio link configuration was adopted. By comparison, the Galileo range-rate data had an accuracy of 0.34 mm/s, because of the use of S-band link and the onboard Low Gain Antenna. Moreover, this link configuration allows to use the multi-frequency link calibration technique to remove the downlink plasma contribution, preventing biases from local dispersive noises as the possible Ganymede’s ionosphere or the Io plasma torus.
Nevertheless, our results from a covariance analysis indicate that, by itself, G34 cannot provide an improvement to the current knowledge on Ganymede’s interior structure, being only able to constraint the hydrostatic ratio J2/C22 to the ~45%. This is mainly due to the flyby characteristics, and in particular the high relative velocity. However, a joint analysis with the coherent S-band radio tracking data of the Galileo spacecraft (Figure 1), acquired more than 2 decades ago, represents an opportunity to shed some light on the gravity field of this Galilean satellite.
Preliminary results from numerical simulations, performed using JPL’s orbit determination program, MONTE (Evans et al., 2018), using a setup similar to the one used for Jupiter’s gravity determination (Durante et al., 2020), indicates that the hydrostatic ratio J2/C22 could be constrained to within ~10% (1-sigma).
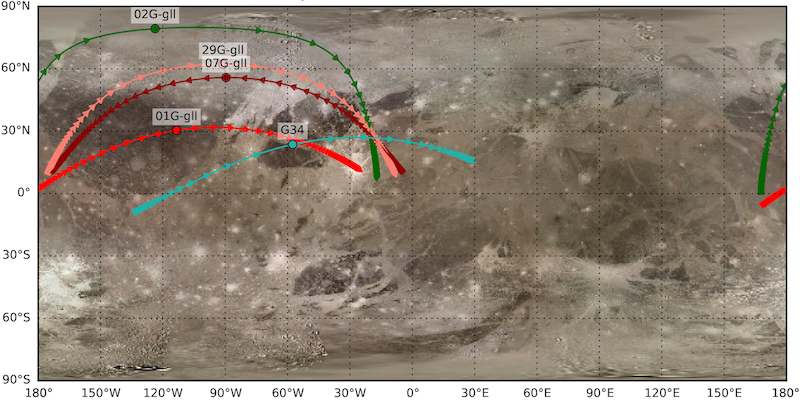
Figure 1: Juno and Galileo ground-tracks over Ganymede during the different encounters. The ticks are separated by 60 s.
This work will present an updated gravity field of Ganymede, showing the possible implications in terms of interior modelling. This will be the outcome of a joint analysis of all the available real data acquired during G34 and the Galileo flybys, applying modern orbit determination techniques used in the past in the Cassini gravity analyses (Durante et al., 2019, Zannoni et al., 2020). The real data used in this analysis will be the last gravity measurements of Ganymede acquirable until future flybys, of Juice and Europa Clipper missions, in the next decade.
Acknowledgements
LGC, MZ and PT are grateful to the Italian Space Agency (ASI) for financial support through Agreement No. 2017-40-H.0, and its extension 2017-40-H.1-2020, for ESA’s BepiColombo and NASA’s Juno radio science experiments. The work of RP, DB, MP, and SL was carried out at the Jet Propulsion Lab, California Institute of Technology, under a contract with the National Aeronautics and Space Administration. Government sponsorship acknowledged.
References
- Anderson, J. D., Lau, E. L., Sjogren, W. L., Schubert, G., & Moore, W. B. (1996). Gravitational constraints on the internal structure of Ganymede. Nature, 384(6609), 541-543.
- Anderson, J. D., Schubert, G., Jacobson, R. A., Lau, E. L., Moore, W. B., & Palguta, J. L. (2004). Discovery of mass anomalies on Ganymede. Science, 305(5686), 989-991.
- Durante, D., Hemingway, D. J., Racioppa, P., Iess, L., & Stevenson, D. J. (2019). Titan's gravity field and interior structure after Cassini. Icarus, 326, 123-132.
- Durante, D., Parisi, M., Serra, D., Zannoni, M., Notaro, V., Racioppa, P., ... & Bolton, S. J. (2020). Jupiter's gravity field halfway through the Juno mission. Geophysical Research Letters, 47(4), e2019GL086572.
- Evans, S., Taber, W., Drain, T., Smith, J., Wu, H. C., Guevara, M., ... & Evans, J. (2018). MONTE: The next generation of mission design and navigation software. CEAS Space Journal, 10(1), 79-86.
- Palguta, J., Anderson, J. D., Schubert, G., & Moore, W. B. (2006). Mass anomalies on Ganymede. Icarus, 180(2), 428-441.
- Schubert, G., Anderson, J. D., Spohn, T., & McKinnon, W. B. (2004). Interior composition, structure and dynamics of the Galilean satellites. Jupiter: The planet, satellites and magnetosphere, 1, 281-306.
- Zannoni, M., Hemingway, D., Casajus, L. G., & Tortora, P. (2020). The gravity field and interior structure of Dione. Icarus, 345, 113713.
How to cite: Gomez Casajus, L., Zannoni, M., Tortora, P., Park, R., Buccino, D., Parisi, M., Levin, S., and Bolton, S.: The gravity field of Ganymede after the Juno Extended Mission, Europlanet Science Congress 2021, online, 13–24 Sep 2021, EPSC2021-537, https://doi.org/10.5194/epsc2021-537, 2021.
Introduction: Chaotic terrains on the icy moon Europa are among the youngest surface features within the satellite’s visible geological history [1]. These regions appear as highly disrupted surfaces formed by irregular groups of isolated plates surrounded by a lumpy matrix material [2]. They are often covered in a reddish-brown material that is interpreted to consist of hydrated sulfates [3] or sulfuric acid hydrate [4]. Current models of chaos formation include a melt-through of the surface provoked by an internal heat source (i.e. a hydrothermal plume) [5], or the mobilization of brines trapped near the surface, in response to partial melting of the outer shell induced by icy diapirs rising through the crust [6]. We investigated two chaotic terrains named Thrace Macula and Thera Macula, both located on the southern hemisphere of Europa. Among the hypotheses proposed to explain their origin are the upwarping of the surface followed by an extrusion of low-viscosity liquids [7, 8], the collapse of large-scale domes [9], or interactions between the ice and shallow subsurface water lenses [10]. Here we provide a geomorphological and stratigraphic analysis of Thrace and Thera Macula, derived from an extensive geological mapping based on the highest-resolution images of the area acquired throughout the Galileo space mission. We also provide preliminary results of a topographic analysis performed on photoclinometric DEMs obtained using Ames Stereo Pipeline [11, 12].
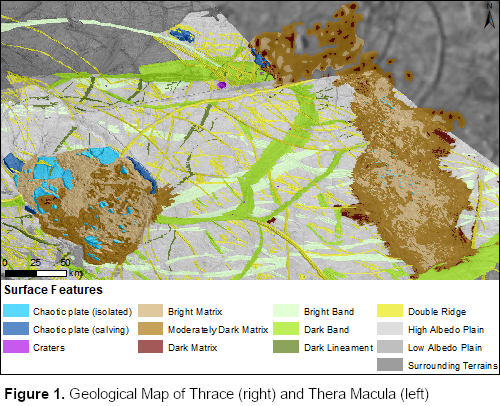
Results: The mapped area includes plains dominated by ridge complexes, bands, linear features (double ridges, troughs), craters (for less than 1%), and chaotic terrains (Fig. 1). Local displacements of band margins and double ridges suggest the occurrence of crustal movements along tectonic faults.
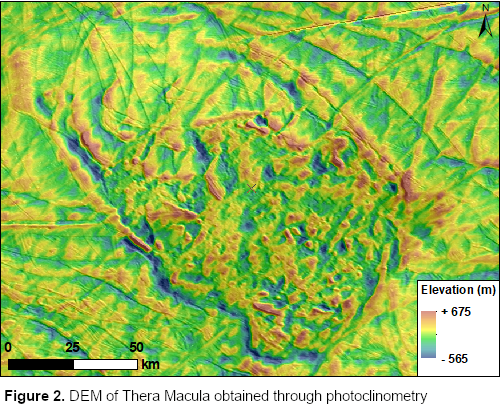
Thera Macula is characterized by a distinctive dichotomy between its northern, partly fractured icy plain, and the southern complex of low-albedo chaotic terrains. The margins of the macula, particularly to the north, appear heavily fractured and forming a complex of steep scarps faced towards the macula, with elevations ranging from -30 to -390 m (Fig. 2). The southern lobe is the only one displaying a positive relief up to 360 m in height. The dark, chaotic terrain consists for 85% of matrix material, and for 15% of large plates that show signs of displacement. On average, plates rise up to 320 m from the surrounding matrix, and some can exceed 700 m in height. Apparently, the matrix has replaced a pre-existing terrain which underwent a strong degradation process.
Thrace Macula exhibits a larger proportion of matrix material, which makes up to 98% of the macula’s surface, while the remaining 2% is composed of blocks. The latter are represented either by large plates not completely detached from the margins (only identified in the northern sector), or by small sub-kilometer, often tilted blocks found in the center of the macula. In contrast to Thera, the boundaries are not marked by steep scarps, and the matrix looks domed up above the surrounding plain. The macula’s northern and central sectors are separated by a bright, roughly linear stripe that could be an intersecting double ridge postdating the formation of the macula. The high-resolution images of the southern lobe show the presence of a higher-albedo matrix, where any pre-existing structure is no longer recognizable, and a lower-albedo matrix, where the pre-existing features are still preserved and appear mostly unaltered.
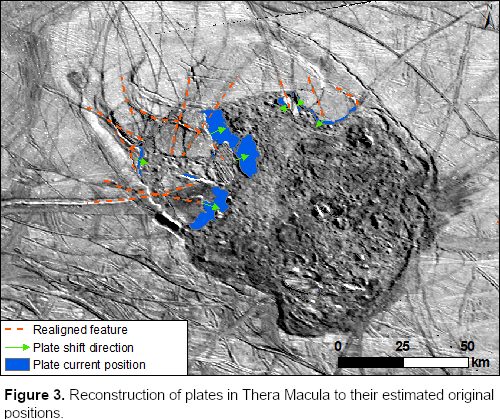
Discussion: Geological mapping has revealed that around the “non-chaotic” plains are structures intersected by linear features (troughs, double ridges, bands), that appear displaced along two opposite directions. A graphic reconstruction of the original placement of surface units has confirmed that lateral and extensional motion of the icy crust has occurred at some point during Europa’s geological history, generating linear displacements up to 7.50 km in length. Furthermore, the morphology and the orientation of the plates surrounded by the chaotic matrix in Thera Macula indicates they must have undergone shifting, rotation and tilting upon their formation. A reconstruction of the original placement of 17 plates has confirmed that 47% of them have undergone horizontal translation, moving between 0.7 and 9.2 km (Fig. 3). Also, 30% of the plates have rotated by an average of 10.6°, either clockwise or counterclockwise, whereas motion of the plates has prevalently occurred from the inward-facing scarps towards the innermost areas.
Finally, we inferred the relative age of the two maculae and the variety of geological features that comprise the surrounding plains by performing a detailed analysis of cross cutting relationships. The resulting stratigraphic column (Fig. 4) can be summarized in a four-stage sequence of events: 1) Formation of plains, including ridge complexes and smooth plains; 2) Formation of bright bands and isolated double ridges; 3) Formation of dark bands and additional linear features; 4) Formation of impact craters and chaos regions, with Thrace Macula possibly having formed earlier than Thera.
Acknowledgments: GM acknowledges support from the Italian Space Agency (2018-25-HH.0).
References: [1] Prockter L. M. et al. (1999), JGR, 104, 16531-16540. [2] Collins G. and Nimmo F. (2009), in Europa, U. Arizona Press, 259-281. [3] Dalton J. et al. (2005), Icarus, 177, 472-490. [4] Carlson R. W. et al. (2002), Icarus, 157, 456-463. [5] Greenberg R. et al. (1999), Icarus, 141, 263–286. [6] Head J. W. and Pappalardo R. T. (1999), JGR, 104, 1999. [7] Fagents S. A. (2003), JGR, 108, 2003. [8] Miyamoto H. et al. (2005), Icarus, 177, 413-424. [9] Mével L. and Mercier E. (2007), PSS, 55, 915-927. [10] Schmidt B. et al. (2011), Nature, 479, 502–505. [11] Beyer R. et al. (2018), Earth Space Sci, 5. [12] Lesage E. et al. (2021), Icarus, 361, 114373.
How to cite: Chiarolanza, G., Mitri, G., and Pondrelli, M.: Geological Mapping, Topography and Stratigraphy of Thrace and Thera Macula, Europa, Europlanet Science Congress 2021, online, 13–24 Sep 2021, EPSC2021-329, https://doi.org/10.5194/epsc2021-329, 2021.
Introduction: The Galilean satellites’ surfaces and subsurfaces will be explored by robotic spacecraft in the late 2020s and early 2030s, but significant advances from ground-based astronomical facilities will be possible in the coming decade. Ganymede’s surface is composed of regions of brighter young terrain with similar composition to Europa’s young surface, and older dark terrain that has a higher abundance of silicate-rich material [11,16]. Infrared spectra from the Galileo orbiter Near-Infrared Mapping Spectrometer (NIMS) provided high-spatial-resolution IR spectra of Ganymede but with limited spatial coverage in many locations. In recent years, ground-based adaptive optics observations in the infrared with Keck/OSIRIS and VLT/SINFONI have provided new insights into the distributions of surface materials on the Galilean satellites [2,4,10,11].
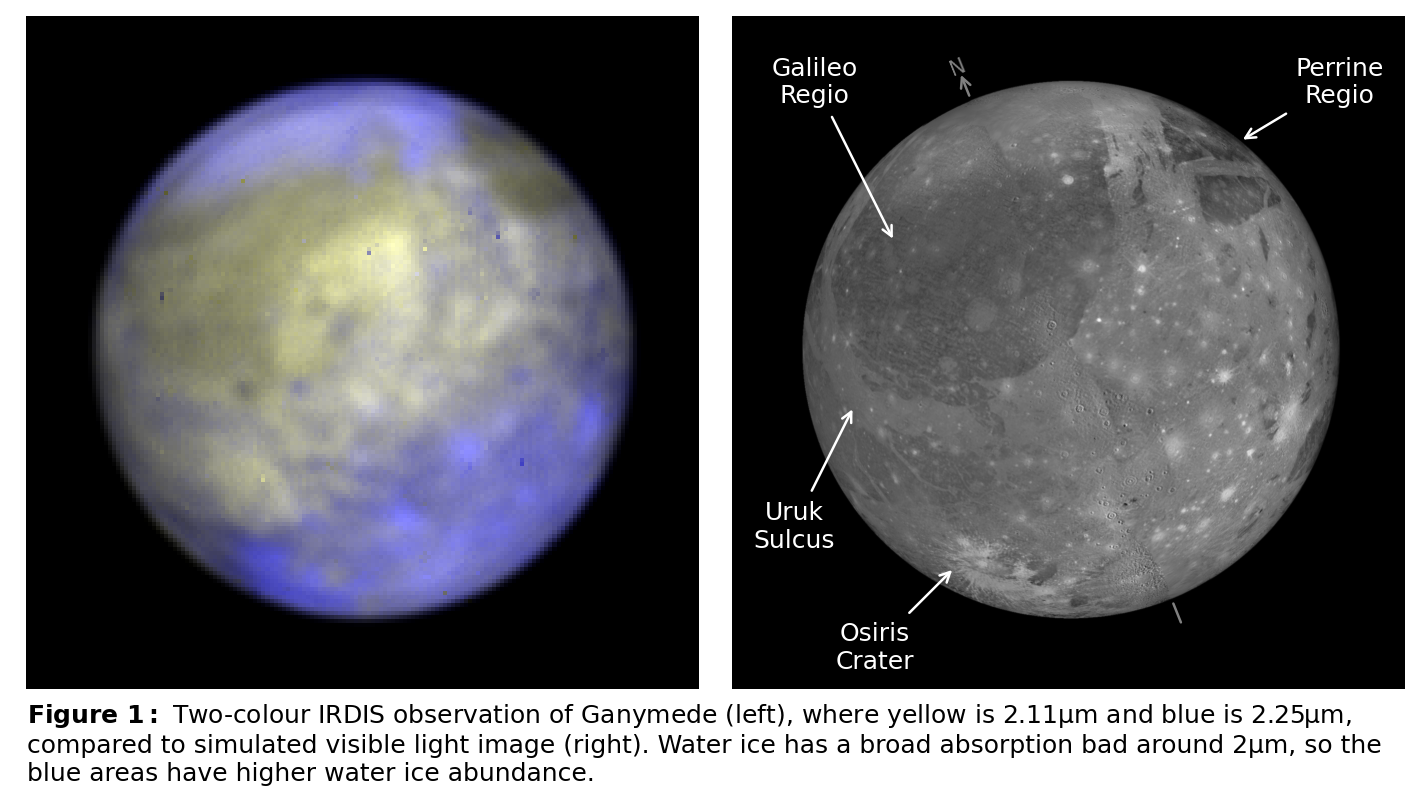
Datasets: Near-IR observations of Ganymede were taken during VLT/SPHERE [1] science verification in 2014 and 2015, observing Ganymede’s leading/anti-jovian hemisphere (sub-observer longitude of 116°W). Data were taken in IRDIFS_EXT mode, allowing simultaneous imaging with the Integral Field Spectrograph (IFS) and Infrared Differential Imaging Spectrometer (IRDIS) sub-systems of the SPHERE instrument. IFS [5,13] produces image cubes with spectra from 0.95 to 1.65 μm (R∼30). It has a high spatial resolution, with a pixel size of 7.46 mas/px, corresponding to ∼25 km/px at Jupiter. Accounting for diffraction, this allows features ∼150 km across to be resolved. IRDIS produced simultaneous imaging through two filters, with transmissions centred on 2.11 and 2.25 μm that enables measurement of the strength of water ice absorption around 2 µm (Figure 1). We have also analysed a series of Galileo/NIMS observations with similar spectral and spatial coverage to our SPHERE data. The NIMS detector covering the 0.99 to 1.26 µm wavelength range failed early in the Galileo mission at Jupiter, meaning the NIMS coverage of the SPHERE spectral range is limited.
The dataset has been reduced and cleaned to produce mapped spectral cubes of Ganymede’s observed hemisphere. Images are photometrically corrected to remove the variation in brightness towards the edge of the observed disc caused by varying viewing angles and illumination levels of the surface. Our photometric correction uses the Oren-Nayar model, which generalizes the Lambertian model to more accurately represent rough surfaces [15]. This enables regions at large emission angles to be mapped accurately, providing significant improvements over the Lambertian model that overcorrects the brightness towards the edge of the disc. The Oren-Nayar correction allows our mapping to reach emission angles of ∼70°, higher than previous studies that extend to 50° to 60° [2,7,10].
Spectral modelling: We analyse the mapped cubes by fitting to laboratory spectra from reference cryogenic libraries. These reference spectra include water ice, sulfuric acid, and hydrated salts [3,8,12]. We have developed an implementation of the Hapke bidirectional reflectance model [9], which we use to model a range of ice grain sizes. We also include ‘synthetic’ black and white spectra which are used to model spectrally-flat (e.g., silicate) material.
Our fitting routine is run for each observed location to produce compositional maps of Ganymede’s observed hemisphere. We treat each observed spectrum as a linear combination of discrete endmembers Ei(λ) with respective abundances ai, where the modelled spectrum is calculated as M(λ)=ΣiaiEi(λ). Our routine uses Markov Chain Monte Carlo techniques [6] to model an observed spectrum, producing a posterior distribution of fitted abundance values for each endmember, and combinations of different endmembers (Figure 2).
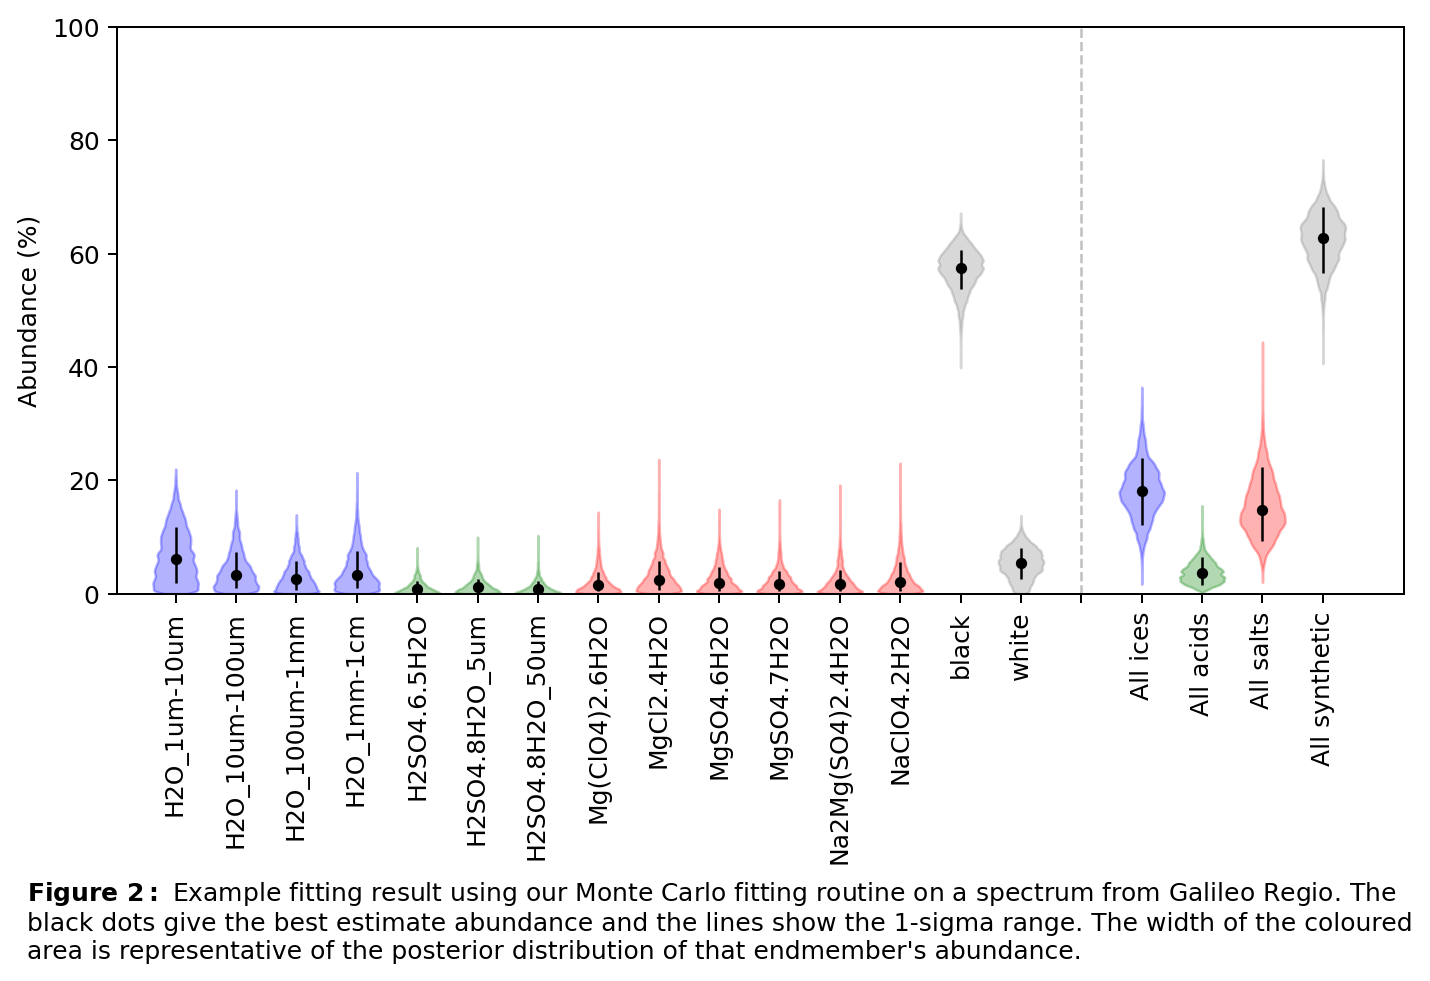
The median of each distribution is used as the best estimate abundance for each endmember, and the width of the distribution is used to estimate the uncertainty on that central value. The posterior distributions of combinations of endmembers can likewise be calculated, accounting for correlations in the uncertainties of the summed endmembers. Whilst the uncertainty on a specific endmember’s abundance may be large (e.g., a specific ice grain size), the uncertainty of the abundance of a combination of endmembers is often much smaller (e.g., the total abundance of all ice endmembers). The use of Monte Carlo techniques allows better exploration of the endmember parameter space than a simple linear fit, and the uncertainty estimates allow more detailed understanding of potential detections.
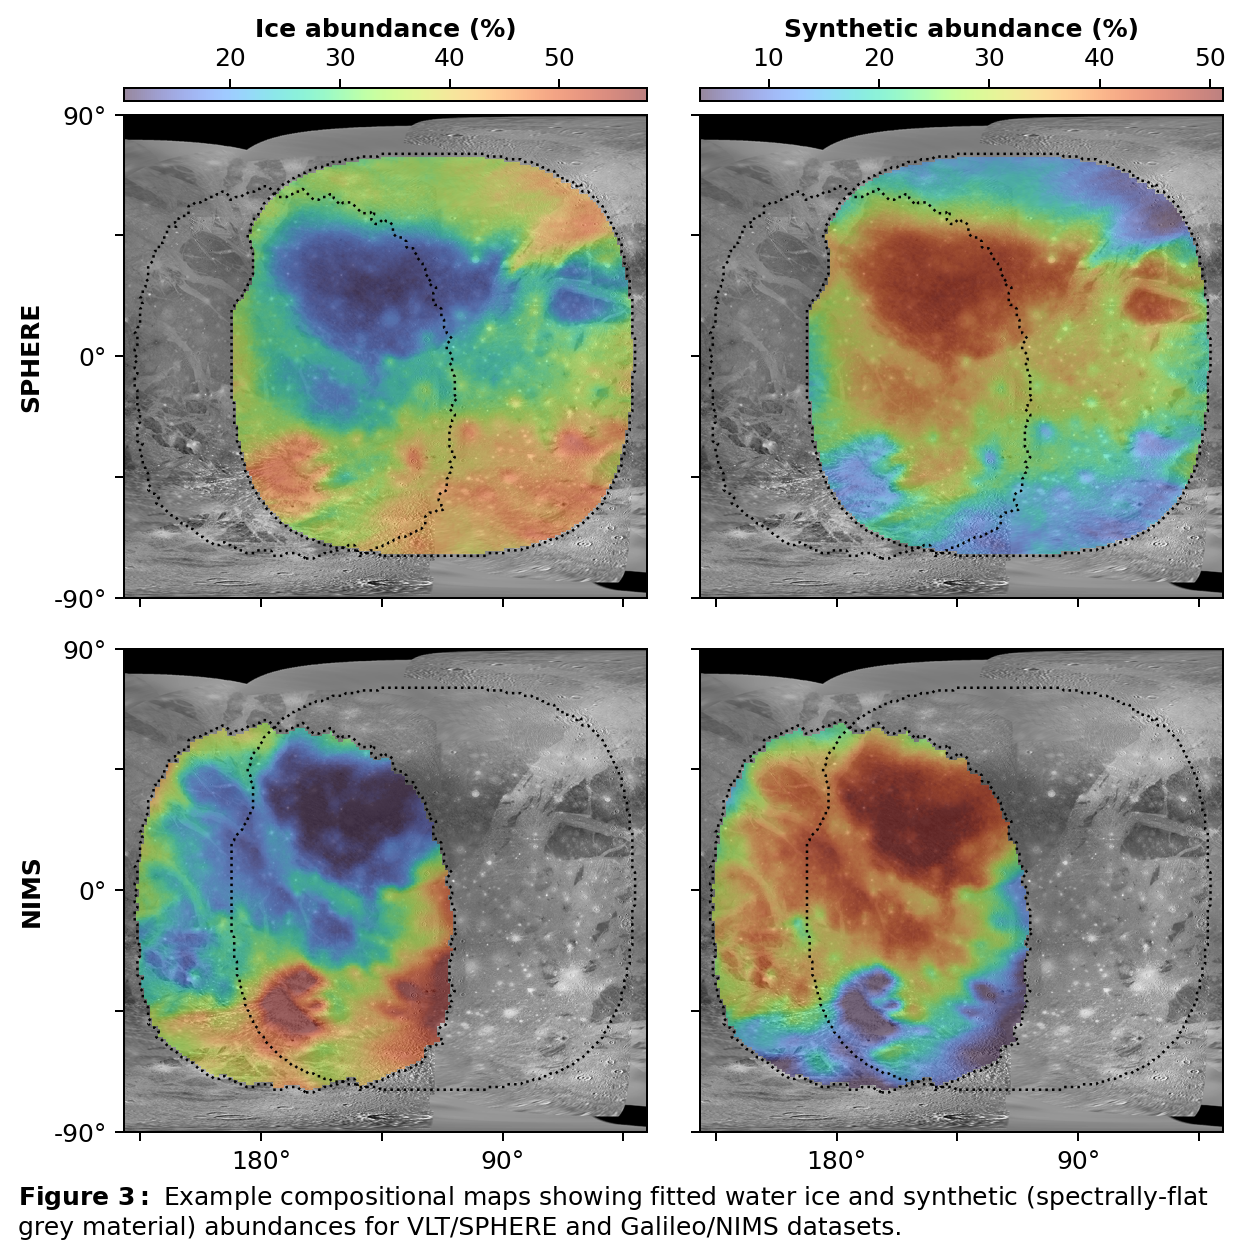
Modelling results from the SPHERE and NIMS datasets show strong similarities and are consistent with previously observed compositional features (Figure 3). These include Ganymede’s younger brighter terrain having higher water ice abundances and the older terrain has a high abundance of spectrally-flat (i.e., grey) material. This spectrally-flat material has a uniformly low albedo and is consistent with higher silicate abundance in Ganymede’s old dark terrain.
Additional SPHERE observations were planned to achieve full longitude coverage of Ganymede in 2020, however this observing campaign has been delayed due to the COVID-19 pandemic. This full observing campaign will allow ~95% of Ganymede’s surface areas to be mapped using SPHERE.
Acknowledgments: We would like to thank the Royal Society for supporting this work.
References: [1] Beuzit et al., 2019, arXiv:1902.04080. [2] Brown & Hand, 2013, AJ. [3] Carlson, Johnson, & Anderson, 1999, Science. [4] Carlson et al., 1992, Galileo Mission. [5] Claudi et al., 2008, SPIE. [6] Foreman-Mackey et al., 2013, Astronomical Society of the Pacific. [7] Grundy et al., 2007, Science. [8] Hanley et al., 2014, JGR-Planets. [9] Hapke, 1993, Theory of reflectance and emittance spectroscopy. [10] Ligier et al., 2016, AJ. [11] Ligier et al., 2019, Icarus. [12] McCord et al., 1999, JGR-Planets. [13] Mesa et al., 2015, A&A [15] Oren & Nayar, 1994. [16] Pappalardo et al., 2004, Jupiter: The Planet, Satellites and Magnetosphere.
How to cite: King, O. and Fletcher, L.: Compositional Mapping of Ganymede with VLT/SPHERE and Galileo/NIMS using Markov Chain Monte Carlo Spectral Analysis, Europlanet Science Congress 2021, online, 13–24 Sep 2021, EPSC2021-279, https://doi.org/10.5194/epsc2021-279, 2021.
The JUICE (JUpiter ICy moons Explorer) mission was selected in May 2012 as the first Large mission (L1) in the frame of the ESA Cosmic Vision 2015-2025 program and it will be launched in 2022. The mission aims to perform an in-depth characterization of the Jovian system, with an operational phase of about 3.5 years [1]. Main targets for this mission will be the vast Jovian system, including Jupiter itself, its magnetosphere, satellites, rings, neutral gas tori and the complex interplays among all those system components. Detailed investigations of three of Jupiter's Galilean icy satellites (Ganymede, Europa, and Callisto) will be achieved thanks to a large number of fly-bys and 9 months in orbit around Ganymede.
JANUS (Jovis, Amorum ac Natorum Undique Scrutator) is the scientific camera system onboard JUICE [2]. Despite the resource limitations, and the environmental constraints, the instrument architecture and design will be able to satisfy the great variability of observing conditions for its different targets, benefiting from the spacecraft and orbit design to its maximum. The JANUS design has to cope with a wide range of targets, from Jupiter’s atmosphere, to solid satellite surfaces and their exospheres, rings, and transient phenomena like lightning. In order to obtain multispectral observations of scientific targets as well as specific observations in narrow bands, JANUS is equipped with a filter wheel mechanism with 13 wide and narrow-band filters, allowing wavelength coverage in the 340 - 1080 nm range. JANUS will greatly improve spatial coverage, resolution and time coverage on many targets in the Jupiter system. JANUS ground sampling ranges from 400 m/pixel to < 3 m/pixel for the three main Galilean satellites, and from few to few tens of km/pixel for Jupiter and other targets in the Jovian system, such as Io, the minor inner and outer irregular moons, and Jupiter’s rings. JANUS observations of Jupiter’s atmosphere will range from full mapping to regional imaging at spatial resolutions down to 10 km/pix. Global wind fields with accuracies better than 1.0 m/s will be obtained several times during the mission.
Assuming the availability of scientific data volume (during operations about 20% of 1.4 Gbit/day is allocated to JANUS), JANUS observations will fully cover Ganymede in 4 colours with a resolution of about 100 m/pix as a goal, also providing regional DTMs. About 3% of the surface of Ganymede will be covered with a resolution of 10 - 30 m/pix for selected Regions of Interest, using both panchromatic and colour filters, and providing stereo images for the 3D reconstruction of the surface. This will represent dramatic improvements in imaging with respect to Galileo coverage in all the science targets covered by JUICE/JANUS.
In addition to presenting the science goals that we are aiming to achieve during the JUICE science phase, we will show examples of a case study of operations, to highlight how the achievement of science goals is strictly related to the resources available to the instrument.
References: [1] Grasset et al., (2013), PSS, 78, 1-21. [2] Palumbo et al., (2014), EGU conference
Acknowledgements: The activity has been realized under the ASI-INAF contract 2018-25-HH.0. LML acknowledges financial support from the State Agency for Research of the Spanish MCIU through the ‘Center of Excellence Severo Ochoa” award to the Instituto de Astrofısica de Andalucia (SEV-2017-0709) and from project PGC2018-099425-B-I00 (MCI/AEI/FEDER, UE).
How to cite: Tubiana, C., Lucchetti, A., Denk, T., Hueso, R., Lara, L. M., Roatsch, T., Stephan, K., Tosi, F., Abudan, A., Bilotta, T., Della Corte, V., Dattolo, A., Hviid, S., Martens, V., Matz, K.-D., Politi, R., Schroedter, R., Trauthan, F., Zusi, M., and Palumbo, P. and the JANUS team: JANUS: the camera system onboard JUICE. Operational approach and scientific capabilities from operations case studies., Europlanet Science Congress 2021, online, 13–24 Sep 2021, EPSC2021-499, https://doi.org/10.5194/epsc2021-499, 2021.
Studying the presence of water and characterizing the tectonic structure in the firsts tens of kilometers of the crust of the Galilean icy moons are crucial to understand the formation and evolution of these bodies and could provide an insight into the setting for extra-terrestrial life within our solar system (Nimmo and Pappalardo, 2016). The most promising technique for directly detecting subsurface oceans is a penetrating radar and the use of low frequencies (< 30 MHz) is preferred to probe the moons' subsurfaces since the losses due to the surface roughness and absorption of the ice are reduced (Bruzzone et al., 2011). However, Jupiter has a loud radio environment for frequencies < 40 MHz (Cecconi et al., 2012), and the use of a passive mode, which would exploit Jupiter’s decametric radio emissions, is considered to operate the radar with low frequencies in the sub-Jovian hemispheres. However, the passive radar operates in a complex bistatic 3D geometry where Doppler and delay information are not separable. This justifies the use of simulations with realistic orbitographies to identify which configurations will lead to the best and worst performances, which is necessary to establish the scenarios of observation of the radar. In this paper, we compute the impact of the geometry on the final bistatic performances, using planned Juice orbits.
In order to study the influence of the geometry only, we do not take into consideration the stochastic character of Jupiter’s noise. The emission is then a simple impulsion located in the Jupiter auroral coronas: we regard four sources, at the Eastern and Western borders of Jupiter’s North and South auroral coronas, as presented in Figure 1.
In this geometry, the passive radar is orbiting around Ganymede and studies the reflection of the Jovian signal by a point target at the nadir in a monostatic geometry, or a point making a specular reflection in the bistatic case. To recognize weak, delayed, and Doppler-shifted contributions of the Jovian signal (also called reference signal), cross-correlation is carried out between the registered Jovian signal and the measured reflection. The next signal processing is the computation of the SAR synthesis to retrieve a Range-Doppler map of the surface probed.
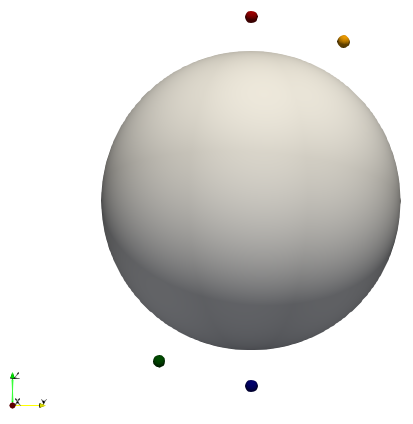
Figure 1. Considered location for the four sources of emission of Jupiter’s radio emissions, and Jupiter. The sources will then be referred to as red source, blue source, yellow source, and green source.
To compute the performances of the radar, we simulate the signal scattered in monostatic and bistatic cases, for three different scenarios (figure 2, table 1) using different integration times, perform SAR synthesis and compute on the images the size of the resolution cell. We depict in table 2 the area of the resolution cell for each scenario, as well as the size of the Fresnel zone.
The area of the resolution cell is always better than the size of the Fresnel zone, but table 2 depicts that with an integration time of one minute, probing close to the center of the sub-Jovian hemisphere provides the best resolution (1.33 km²). However, this conclusion changes when the integration times are increased to two minutes, and probing with an incidence angle of 38° becomes more favorable than along the nadir (0.28 km²). Indeed, in this geometry, the Range and Doppler sidelobes are not separated, and this non-separability increases with the integration.
Thus, while the along-track resolution is predictably worsened in the bistatic case compared to the monostatic scenario and improves with increasing integration time, the resolution in across-track varies as well with the integration time. For orbit 2, it improves with an increasing integration time, while, for orbit 1 and 3, which are aligned with nadir, the integration time does not seem to largely impact it. This means that, while probing along the center of the sub-Jovian hemisphere seems more efficient with small integration times, probing different parts of the sub-Jovian hemisphere might become of interest if increasing the integration time is possible.
This study showed that, as expected, the resolutions obtained are largely dependent on the geometry, but as well on the integration time. These conclusions will have to be kept in mind will preparing the probing strategy of Jupiter’s moons.
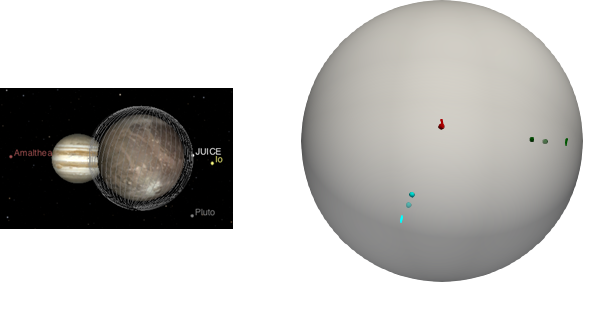
Figure 2.
Left: JUICE orbits as visualized on Cosmographia (https://www.cosmos.esa.int/web/spice/cosmographia)
Right: Position of the three considered orbits ( orbit n°1 in red, orbit n°2 in green, and orbit n°3 in cyan), with the bistatic specular point in bright color, and the nadir point with an opacity.
Table 1 Description of each scenario.
| Orbit | Associated color | Date | Center Time | Incidence |
| Orbit n°1 | Red | 18/03/2033 | 15:41 | 2 |
| Orbit n°2 | Green | 21/03/2033 | 09:46 | 38 |
| Orbit n°3 | Cyan | 27/04/2033 | 08:02 | 27 |
Table 2 Performances resulting from each orbit. ρ2 is the area of the resolution cell while Fresnel depicts the area of the Fresnel zone.
| ρ2 (km2) |
Fresnel (km2) | |||
| Orbit n°1 | 1 mn | Monostatic | 0.503 | 22 |
| Bistatic | 1.33 | 38 | ||
| 2 mn | Monostatic | 0.25 | 22 | |
| Bistatic | 0.655 | 38 | ||
| Orbit n°2 | 1 mn | Monostatic | 0.518 | 22 |
| Bistatic | 1.78 | 55 | ||
| 2 mn | Monostatic | 0.25 | 22 | |
| Bistatic | 0.28 | 55 | ||
| Orbit n°3 | 1 mn | Monostatic | 0.518 | 22 |
| Bistatic | 1.92 | 46 | ||
| 2 mn | Monostatic | 0.28 | 22 | |
| Bistatic | 0.953 | 46 |
How to cite: Gassot, O., Herique, A., Kofman, W., and Witasse, O.: Passive radar probing of the Galilean Moons, Europlanet Science Congress 2021, online, 13–24 Sep 2021, EPSC2021-521, https://doi.org/10.5194/epsc2021-521, 2021.
The presence of a subsurface ocean on Europa [1] in direct contact with the silicate mantle, along with the spectacular volcanic activity exhibited by its neighboring satellite Io [2] raise the possibility of seafloor volcanic activity [3,4], which has significant implications for Europa’s ocean habitability.
Observational constraints concerning the heat budget of Jupiter’s moons exist only for Io. The total power emitted at its surface is estimated to about 100 TW at present [5], which is several orders of magnitude higher than can be explained by radiogenic heating alone. Tidal dissipation in a partially molten layer at the top of the silicate mantle appears consistent with the prodigious heat flux emitted from Io [6,7], but it is still unclear how Io reached such a highly dissipative state.
Unlike Io, the heat flux at the surface of Europa’s rock mantle is unknown. Due to a larger distance from Jupiter and a smaller size, dissipation in Europa's mantle is expected to be considerably smaller than on Io [8], but still could be comparable to present-day radiogenic heating [4]. From 3D models, we recently showed that combined radiogenic heating and tidal heating can sustain partial melting in Europa's mantle during billions of years [4], especially during periods of enhanced eccentricity, which may lead to melt accumulation in the asthenosphere. Even if the melt production in Europa’s mantle is much smaller than Io’s, evaluating the coupling between melt generation and tidal heat production is essential to assess the extent of seafloor volcanism on Europa.
In the present study, we follow the approach developed to model the solid tides in Io’s partially molten interior [7], and adapt it to the context of Europa, corresponding to a deeper asthenosphere than on Io with presumably a smaller amount of melt present. We test the influence of partially molten zones on the tidal dissipation rate in Europa’s mantle (Figure 1), assuming rheological laws including the effect of melt on anelastic properties of rocks. Using the 3D model prediction of Běhounková et al. [4] for melt production, we estimate the effect of melt accumulation in Europa’s mantle on local dissipation rate and re-assess the consequences in terms of melt production rate. We investigate different scenarios for the eccentricity evolution and provide upper limits in terms of global power generated by tidal heating in Europa’s mantle through its evolution.
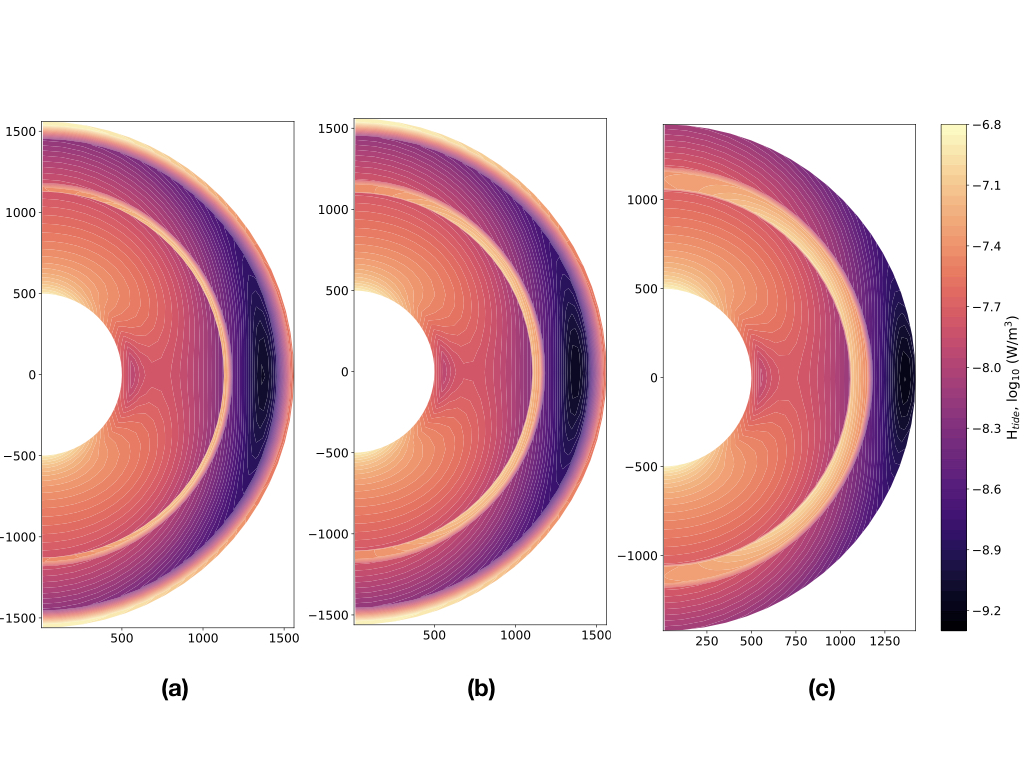
Figure 1: Spatial distribution of the averaged volumetric heating rate in Europa’s mantle including a 25 (a), a 50 (b) and a 100-km thick (c) partially molten layer with a melt fraction of 20%.
[1] Khurana, KK., et al., Nature, Vol. 395, pp. 777 (1998).
[2] Lopes, R. M., and Williams, D. A., Io after Galileo. Reports on Progress in Physics, 68(2), 303 (2005).
[3] Thomsom, R. and Delaney, J., JGR: Planets, Vol. 106, pp. 12355-12365 (2001).
[4] Běhounková et al., GRL, (2021).
[5] Veeder, G. et al., JGR: Planets, Vol. 99, pp. 17095-17162 (1994).
[6] Segatz, M. et al., Icarus, Vol. 75, pp 187-206 (1988).
[7] Kervazo et al., A&A, (2021).
[8] Tobie, G. et al., Icarus, Vol. 177, pp. 534-549 (2005).
Acknowledgements: This research received funding from the French “Agence Nationale de Recherche” A.N.R. (OASIS project, ANR-16-CE31-0023-01,( G.T., G.C., M.K., C.D.), from CNES (JUICE and Europa Clipper missions, G.T., G.C., M.K., C.D.) and from Czech Science Foun- dation through project No. 19-10809S (M.B.)
How to cite: Kervazo, M., Běhounková, M., Tobie, G., Choblet, G., and Dumoulin, C.: Impact of partial melting on tidal dissipation in Europa's silicate mantle, Europlanet Science Congress 2021, online, 13–24 Sep 2021, EPSC2021-274, https://doi.org/10.5194/epsc2021-274, 2021.
Introduction: Jupiter’s moon Europa is a prime target in our exploration of potentially habitable worlds beyond Earth, and of ocean worlds in the outer solar system. The exploration of Europa presents an important target for both astrobiology and comparative oceanography, i.e., the opportunity to study liquid water oceans as a planetary process. Europa’s icy shell also offers the opportunity to study tectonics and geologic cycles across a range of mechanisms (e.g., Earth’s cooling versus Europa’s tidal dissipation) and compositions (silicate in the case of the Earth, versus ice in the case of Europa). Europa is a scientifically important and strategic target for both planetary science and astrobiology.
Critically, Europa’s subsurface ocean has likely existed for much of the history of the solar system, potentially providing a persistent, stable environment in which a second, independent origin of life may have arisen. Observations and models indicate that the ocean is likely in contact with a rocky, silicate seafloor, and the ice shell may have tectonic activity that could allow reductant-oxidant cycling. This scenario could lead to an ocean rich in the elements and energy needed for the emergence of life, and for potentially sustaining life through time. The persistence of Europa’s ocean means that life could be alive there today – i.e., signs of extant life could be found within the ice and ocean of Europa. The discovery of signs of extant life is critical if we are to understand biology as a universal process: Does it contain DNA or does it function on some other large biomolecules for information storage, replication, and repair? Are there many separate ‘trees of life’ within our solar system, or is the tree of life on Earth the only one? The search for past life on worlds like Mars is very important, but the search for extant life is how we will truly revolutionize biology (if life exists beyond Earth).

Figure 1. Science goals and objectives of the Europa Lander mission concept. Within each Goal are the high level Objectives, represented as a “fan” across each Goal.
The high-level science goals of the Europa Lander Mission Concept are:
- Search for evidence of biosignatures on Europa.
- Assess the habitability of Europa via in situ techniques uniquely available to a lander.
- Characterize surface and subsurface properties at the scale of the lander to support future exploration.
These goals are achieved by employing a lander on the surface that collects and processes a minimum of three separate samples, each of at least seven cubic centimeter in volume, and acquired from a depth of at least 10 cm.
Overview of Mission Concept: Here we provide an overview of significant milestones, developments, and technology advancements that have been made, or are ongoing, to retire science, technology, cost, and schedule risks associated with the mission concept.
- The mission concept achieves high value science without requiring an excessive number of engineering ‘miracles’; this mission aims to be the right ‘first’ mission to the surface of Europa and balances technical risk with science return and cost.
- The technology and instrumentation investments made to date (which exceed $300M) could enable a new era of planetary exploration. Many of the technologies that have, or are, being developed for the Europa Lander Mission Concept can be utilized for landing on other ocean
- The Europa Lander builds on the investment in Europa Clipper, using data from that mission for landing site There would be at least five years of time between the end of Clipper’s prime mission and the landing site selection date. Importantly, data from Clipper would be unlikely to dramatically change our approach to de-orbit, descent, and landing (DDL). The mission concept team examined a variety of mechanical configurations and concluded that even after the acquisition of the Clipper data, the DDL and mechanical architectures would not significantly change. Uncertainty about parameters such as porosity and structure at the sub-meter scale would still require the intelligent landing system, with terrain relative navigation and hazard avoidance. Furthermore, the lander would still need to employ the ‘snowshoe belly pan’ and ‘grasshopper’ adaptive stabilizer legs to accommodate soft and variable surfaces at the sub-meter scale.
- The Lander concept uses primary batteries and could survive for many weeks to >60 days on the surface, depending on sampling and idle power usage The choice of primary batteries was, in part, to save on cost and complexity. A longer-lived mission concept with a radioisotope power system was studied, but planetary protection, thermal management, and mass were found to contribute to increasing cost and technical risk.
How to cite: Cameron, M., Hand, K., Phillips, C., Maize, E., Pitesky, J. E., Brooks, S., Craft, K., Crum, R., Hofgartner, J., Hofmann, A., Hurst, K., Kennedy, B., Klonicki, E., Reeves, G., Roberts, E., San Martin, A. M., Scully, J., Shiraishi, L., and Tan-Wang, G. and the Project Science and Engineering Teams: The Europa Lander Mission Concept: In Situ Exploration of an Ocean World, Europlanet Science Congress 2021, online, 13–24 Sep 2021, EPSC2021-386, https://doi.org/10.5194/epsc2021-386, 2021.
The upcoming JUpiter ICy moons Explorer (JUICE) (ESA) and Europa Clipper (NASA) missions will perform detailed observations of the giant gaseous planet Jupiter and three of its largest moons (Ganymede, Callisto, and Europa).
A series of experiments was performed to measure the thermal conductivity and calorimetry of macroscopic frozen salt solutions of particular interest in Jovian icy moons. The following salts were investigated: Na-chloride (NaCl), Mg-sulphate (MgSO4), sodium sulphate (Na2SO4), and Magnesium chloride (MgCl2). Measurements were performed at atmospheric pressure and temperatures from 0 to -70ºC in a climatic chamber. Temperature and thermal conductivity were measured during the course of the experiments. A small sample of the liquid salt-water solution was set aside for the calorimetry measurements. A side effect of the measurements is that they served to spot phase changes in the ice mixtures with high sensitivity. An important result is that, the phase changes observed in the standard calorimetric tests, could be monitored in situ with high sensitivity in the thermal conductivity measurements. Indeed, when a phase change occurs, a large peak appeared in the thermal conductivity values as the result of the natural heat release that accompanied the phase change.
How to cite: González Díaz, C., Muñoz Caro, G. M., Carrascosa de Lucas, H., Aparicio Secanellas, S., González Hernández, M., Anaya Velayos, J. J., Anaya Catalán, G., Prieto-Ballesteros, O., Muñoz-Iglesias, V., Ercilla Herrero, O., Lorente, R., Altobelli, N., and Witasse, O.: Thermal conductivity measurements of frozen salt solutions in Jovian moons to support future JUICE mission., Europlanet Science Congress 2021, online, 13–24 Sep 2021, EPSC2021-714, https://doi.org/10.5194/epsc2021-714, 2021.
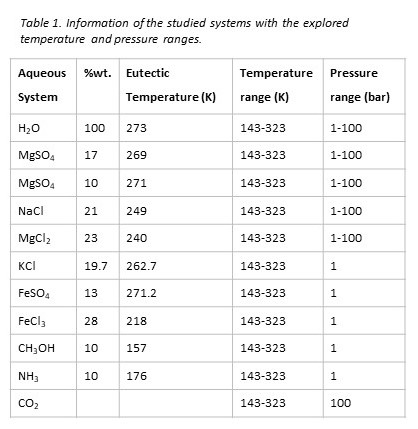
ESA and NASA will launch two missions to explore the main Galilean moons of Jupiter in the coming years, JUpiter ICy moons Explorer-JUICE and Europa Clipper, respectively. Both missions will be able to determine the distribution of the potential habitable zone in the upper dozens of kilometers of the ice bodies by using onboard radar instruments [Bruzzone et al. 2013, Grasset et al., 2013, Phillips and Pappalardo 2014, Aglyamov et al. 2017]. Considering the possible presence of mixtures of water with salts, volatiles, and clays in the ice and liquid layers, we performed laboratory experiments to obtain the electrical properties of these chemical systems at solid and liquid state, and at different pressure conditions (Table 1). The results that we present at the conference will facilitate the interpretation of the future data received from the radar sensors.
We measured the dielectric properties of these samples with a BDS80 Broadband Dielectric Spectroscopy system (Novocontrol), which allows working in a frequency range from 1 Hz to 10 MHz and temperatures from 143 to 323 K. Both, real permittivity (ε´) and electric conductivity (σ) were measured at 0.1 MPa while cooling the samples in temperature steps of 10 K. From these data, we calculated the activation energy and the attenuation of the radar wave depending on the chemical composition, the temperature of the sample, and the frequency of the applied electric field [Petrenko and Whitworth 1999, Pettinelli et al. 2015].
Conductivity measurements at high pressure were carried out using a modification of a chamber used previously for planetary simulation experiments (Muñoz-Iglesias et al. 2019). It is based on a stainless steel cylinder, which has different access on the bases and along the main body. Pressurization of the sample is carried out by water or gas from one access at the chamber base, while a sapphire window is at the opposite side for visual control and spectral analysis. Connections throughout the body of the cylinder are for the thermocouple, the pressure gauge and a special one to plug in the electrical sensor. The key feature is the plug for in-situ conductivity measurements with feed through wires connected to the probe, made of two Pt electrodes placed in a PTFE structure in order to maintain the configuration and to ensure the distance between electrodes (around 500 micrometers). Both electrodes have connections to isolated copper wires, which pass through the cell body to be connected to the signal transducer and the computer to record the data.
Acknowledgements
This work was supported by the ESA contract number 4000126441/19/ES/CM. We thank Anezina Solomonidou for assistance in the project proposal.
References
Aglyamov et al. (2017) Bright prospects for radar detection of Europa’s ocean, Icarus, 281, 334-337.
Bruzzone et al. (2013) RIME: Radar for Icy moon Exploration, IEEE International Geoscience and Remote Sensing Symposium - IGARSS, Melbourne, 3907-3910.
Grasset et al. (2013). Jupiter Icy moons explorer (JUICE): an ESA mission to orbit Ganymede and to characterise the Jupiter system. Planet. Space Sci. 78, 1-21
Muñoz-Iglesias et al. (2019). Experimental Petrology to Understand Europa's Crust. JGR-Planets 124, 2660-2678
Phillips and Pappalardo (2014). Europa Clipper mission concept: exploring Jupiter’s ocean moon. Eos Trans. AGU 95, 165-167.
Pettinelli et al. (2015) Dielectric properties of Jovian satellite ice analogs for subsurface radar exploration: A review. Reviews of Geophysics, 53, 593-641.
How to cite: Prieto-Ballesteros, O., Ercilla Herrero, O., Sánchez Benítez, J., Muñoz-Iglesias, V., Rivera-Calzada, A., Muñoz-Caro, G., González-Díaz, C., Lorente, R., Altobelli, N., and Witasse, O.: Dielectric properties of binary aqueous systems with sulfates, chlorides, and volatiles for subsurface radar sounding, Europlanet Science Congress 2021, online, 13–24 Sep 2021, EPSC2021-467, https://doi.org/10.5194/epsc2021-467, 2021.
Jupiter’s moon Europa is predicted to harbor a global liquid water ocean beneath its icy crust [1,2]. Like Saturn’s moon Enceladus, Europa could be cryovolcanically active, with evidence for plumes of water recently reported (e.g. [3,4]). Such plumes could eject gas and water ice grains from the subsurface ocean into space. Sputtering and micrometeorite bombardment may also eject icy surface particles to high altitudes [5].
Ice grains ejected from icy moons can be analyzed during spacecraft flybys by impact ionization mass spectrometers [6], such as the Cosmic Dust Analyzer (CDA) onboard the Cassini spacecraft or the Surface Dust Analyzer (SUDA) that will be onboard the upcoming Europa Clipper mission [7]. These instruments can determine the composition of the ice grains and potentially indirectly sample subsurface oceans. In the Saturnian system, data collected by the CDA instrument showed that Enceladus’ interior ocean is salt-rich [8], sustains water-rock hydrothermal interactions [9], and contains a variety of organic material, including complex macromolecules [10] and low mass volatile compounds, potentially acting as amino acid precursors [11]. On Europa, the subsurface ocean is predicted to be in direct contact with silicates and possible seafloor magmatic activity, enhancing the potential habitability of the moon [12]. The moon’s surface is also exposed to the harsh radiation environment of Jupiter, which may induce oxidation and potentially other chemical reactions involving both ice and non-ice compounds [13].
Interpreting mass spectra acquired in space requires terrestrial calibration by analogue experiments. The Laser Induced Liquid Beam Ion Desorption (LILBID) technique reproduces the impact ionization mass spectra of ice grains recorded in space [14]. Previous LILBID experiments have shown that bioessential molecules, such as amino acids and fatty acids, can be detected in ice grains at concentrations as low as the µM or nM level [15], and that the abiotic and biotic formation processes of these molecules can be distinguished from each other based on spectral features [16]. Microbial biosignatures were also investigated recently, showing that nucleobases, fatty acids and other bacterial fragments can be clearly identified [17].
Here we investigate whether Europa-relevant organic compounds encased in ice grains can also be detected and characterized using impact ionization mass spectrometry in space. High-sensitivity LILBID experiments have been performed with formamide (CH3NO), farnesol (C15H26O), cholesteryl linoleate (C45H76O2) and N-dodecanoyl-L-homoserine lactone (C16H29NO3) to predict their spectral appearance in both anion and cation mass spectra. Formamide is expected to form by radiolytic reactions on Europa’s surface [18], while farnesol, cholesteryl linoleate and N-dodecanoyl-L-homoserine lactone are lipids, representing potential biosignatures and selected for their high resistance to degradation. These compounds were investigated in water matrices with varying NaCl concentrations designed to mimic Europa’s predicted salty ocean and surface composition [19,20]. Results show that the identification of molecular peaks as well as characteristic fragments is possible for both formamide and lipids. Additionally, the spectra of formamide in salt-rich matrices show that formamide can be detected via sodiated molecular clusters ([CH3NO+Na]+) and other Na-rich complexes.
The next steps will be to investigate these compounds in H2O2-rich matrices, designed to simulate the highly oxidizing surface environment of Europa [21]. Sulfate salts and sulfuric acid are also under consideration as important matrices relevant to the surface chemistry of Europa. Other potential biosignatures, as well as their irradiation products, will be investigated to study the likelihood of their survival and detection under Europa’s radiation environment. The recorded mass spectra will complement a comprehensive spectral reference library [22], which provides analogue data of a wide range of compounds applicable to impact ionization mass spectrometers onboard Europa Clipper or other future ocean world missions.
References
[1] Kivelson et al. (2000) Science 289.5483: 1340-1343
[2] Zimmer et al. (2000) Icarus 147.2: 329-347
[3] Jia et al. (2018) Nature Astronomy volume 2, pages 459–464
[4] Roth et al. (2014) Science 343.6167: 171-174.
[5] Miljkovic et al. (2012), Planetary and Space Science 70.1: 20-27
[6] Postberg, et al. (2011) Planetary and Space Science 59.14: 1815-1825
[7] Kempf et al. (2014) EPSC2014-229, 2014
[8] Postberg et al. (2009) Nature 459.7250: 1098-1101
[9] Hsu et al. (2005) Nature 519.7542: 207-210
[10] Postberg et al. (2018) Nature 558:564–568
[11] Khawaja et al. (2019) Mon Not R Astron Soc 489:5231–5243
[12] Hand et al. (2009) Europa 589-629.
[13] Hand et al. (2007) Astrobiology 7.6: 1006-1022
[14] Klenner et al. (2019) Rapid Commun Mass Spectrom. 33.22: 1751-1760
[15] Klenner et al. (2020) Astrobiology 20:179–189
[16] Klenner et al. (2020) Astrobiology 20: 1168–1184
[17] Pavlista et al. (2021) EGU21-15475
[18] Hand (2007) PhD Thesis, Dpt of Geological and Environmental Sciences, Stanford University
[19] Zolotov et al. (2001) Journal of Geophysical Research: Planets 106.E12: 32815-32827
[20] Trumbo et al. (2019) Science advances 5.6: eaaw7123
[21] Johnson et al. (2003) Astrobiology 3, 823–850
[22] Klenner et al., in prep.
How to cite: Napoleoni, M., Klenner, F., Hillier, J. K., Khawaja, N., Hand, K. P., and Postberg, F.: Analogue experiments for the identification of organics in ice grains from Europa using mass spectrometry, Europlanet Science Congress 2021, online, 13–24 Sep 2021, EPSC2021-494, https://doi.org/10.5194/epsc2021-494, 2021.
Events which emplace fresh material onto Europa’s surface may be irregular and catastrophic, such as large-scale impacts or localized, and potentially extant, processes in which faults, fractures, or brine transport bring subsurface liquid onto the surface. This liquid may originate from shallow reservoirs within the ice shell or directly from the ocean [1].
Emplacement may be a slow, extrusive process, or quicker, potentially with the formation of cryovolcanic plumes (e.g. [2,3,4]). Plume deposits or any other surface material can also be transported to high altitudes by another mechanism: when hypervelocity interplanetary micrometeoroids, or larger objects, impact the surface of an atmosphereless planetary body like Europa, these can generate impact ejecta with high enough velocities to reach altitudes of hundreds of kilometres [5]. Most of these ejecta particles are gravitationally bound, moving on ballistic trajectories lasting up to hundreds of seconds and producing an almost isotropic dust exosphere around Europa [6,7]. Subsurface oceans, in the Jovian and in other planetary systems, can therefore be characterized using the particles they emit, via either indirect or direct routes: 1) Detection and analysis of ejecta particles lofted by micrometeoritic impacts from those parts of the surface that recently interacted with subsurface waters (e.g certain landforms, such as chaos terrains on Europa, or plume deposits); 2) Direct sampling of plume particles in space (where plumes are present, as perhaps possible on Europa).
The time-of-flight mass spectrometer SUrface Dust Analyzer (SUDA), onboard the Europa Clipper spacecraft, is designed to measure the compositions and trajectories of such impact ejecta particles and/or plume material [8]. SUDA is an impact ionisation time-of-flight mass spectrometer, which uses the ions generated by hypervelocity impacts of dust grains onto the instrument target to generate mass spectra of the impinging particles. Depending on the altitude SUDA will be able to detect up to tens of ejected surface particles per second during each flyby, each likely to contain a wide variety of organic and/or inorganic compounds, and via trajectory reconstruction, map them to their origins on the surface [8].
The trajectories of impact ejecta, and potentially even those of directly emitted plume grains, are likely to be considerably affected by local surface properties, over a range of scales. Here we present our initial progress in producing new, and collating existing (e.g [9]), digital terrain models (DTMs) of the Europan surface, together with the development of Monte Carlo impact ejecta trajectory simulations which consider variations in ejecta mass and velocity distributions.
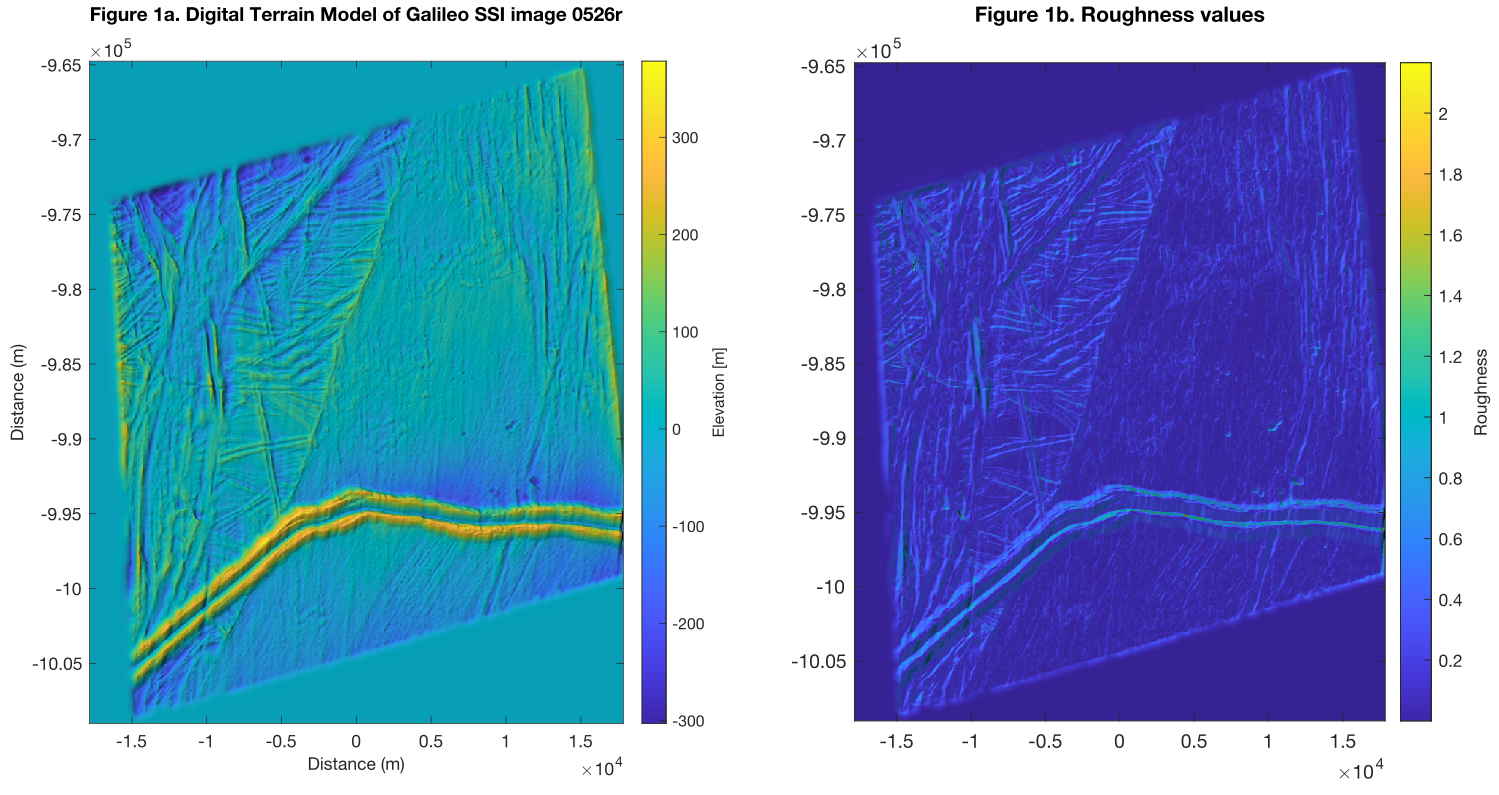
DTMs have been produced using both stereophotogrammetry and photoclinometry techniques, through the Integrated Software for Imagers and Spectrometers (ISIS) and the Ames Stereo Pipeline (ASP) Shape-from-Shading (SfS) tool [10], based on Galileo’s Solid-State Imager (SSI) images. In the case of Fig. 1a, through SfS we obtain a DTM of image 0526r with a resolution of ~35 m/px, following the methodology described in [11]. One of the most important parameters that can be calculated from DTMs is surface roughness (Fig. 1b), a measure that describes the height distribution of asperities. Its variations affect the trajectories and yield of ejecta particles generated by micrometeoroid impacts, along with the angles at which plume particles might be emitted. The DTMs of features of interest, with their associated roughness and slope information, will provide an important input for ejecta trajectory simulations.
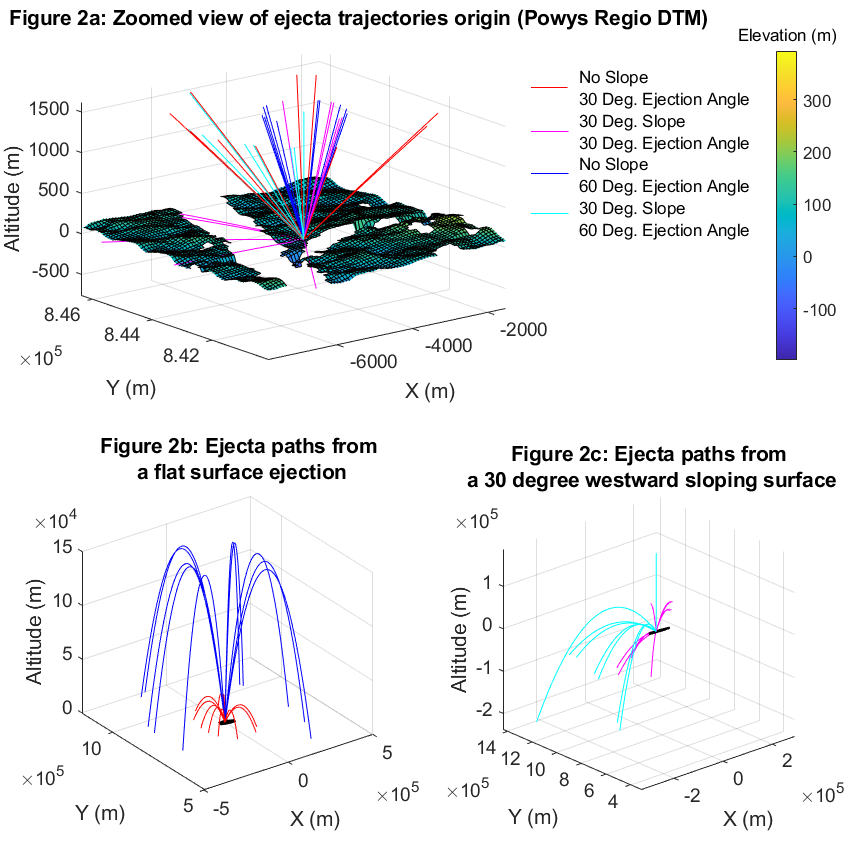
Previous models [6,8] have assumed particles originate from perfect planar surfaces, whereas actual micrometeoroids impact surfaces with varying characteristics, such as roughness and slope, over a range of incidence angles. These initial properties result in variations in excavated ejecta mass, ejection angles, and ejecta speeds that, if accounted for, will increase the ability of SUDA to map accurately Europa’s surface. Utilizing DTM-derived surface information, and realistic assumptions of surface properties at smaller scales, an impact ejecta simulation code, derived from the parameters and equations of [6] and more recent works [12,13], is under development. Ejecta trajectories and velocities are produced for typical impactors (i.e. an impactor of mass 1 x 10⁻⁸ kg, striking at 9 km s-1), accounting for external influences such as gravitational focusing and Coriolis deflection. The output of this code is shown in Fig. 2, which shows the trajectories of multiple ejecta originating from a location within Powys Regio. In one version of this figure (Fig. 2b), we assumed the surface the ejecta originates from is flat or has a slope of 0 degrees; in 2c we assume the surface has a westward decline at 30 degrees. The surface slope changes the potential maximum altitude an ejecta particle can reach, which adds constraints to the path-retracing process compared to assuming a flat surface. Surface roughness is still being implemented and was not considered in producing Figure 2. After adding roughness to the model, we intend to use this code to perform a Monte Carlo-type simulation, similar to Fig. 2, to determine the effect surface characteristics have on interpreting trajectory paths from a simulated flyby of Europa Clipper.
1. Head, J.W., & Pappalardo, R.T., (1999). J. Geophys. Res. 104, 27143–27155.
2. Roth, L., et al., (2014). Science 343, 171.
3. Sparks, W.B., et al., (2017). The Astrophysical Journal Letters, 839(2), L18.
4. Jia, X., et al., (2018). Nat. Astron. 2, 459.
5. Koschny, D., & Grün, E., (2001). Icarus, 154(2), 402-411.
6. Krivov, A. V., et al., (2003a). Planetary and Space Science 51, 251-269.
7. Postberg, F., et al., (2011). Planetary and Space Science, 59(14), 1815–1825.
8. Kempf, S., et al., (2014). LPI Contributions 1774, 4052.
9. Giese, B. et al., (2020). Mendeley Data, V1
10. Alexandrov, O., & Beyer, R. A., (2018). Earth and Space Science, 5, 652–666.
11. Lesage, E., et al., (2021). Icarus, Volume 361, 114373
12. Szalay, J.R., et al., (2018). Space Sci Rev, 214:98.
13. Goode, W., Kempf, S., Schmidt, J., (2021). preprint version, submitted for publication.
How to cite: Matteoni, P., Hayes, T., Hillier, J., and Postberg, F.: Surface and topographic characteristics of geological features on Europa and their effects on ejecta particle dynamics, Europlanet Science Congress 2021, online, 13–24 Sep 2021, EPSC2021-244, https://doi.org/10.5194/epsc2021-244, 2021.
Abstract
In preparation of the JUICE mission with the primary target Ganymede [1] we generated a new controlled version of the global Ganymede image mosaic using a combination of Voyager 1 and 2 and Galileo images. Baseline for this work was the new 3D control point network from Zubarev et al., 2016 [2], which uses the best available images from both missions and led to new position and pointing of the images.
- Introduction
Voyager 1 and Voyager 2 encountered Jupiter in 1979. They took 490 Narrow Angle Camera (NAC) and Wide Angle Camera (WAC) images of Ganymede’s surface with pixel scales from 470 m/pxl down to 20 km/pxl. Galileo entered orbit around Jupiter in 1995 and flew by Ganymede 15 times to acquire 149 images (<20 km/pxl). The new control point network of Ganymede led to higher geodetic accuracy in the data and thus created the incentive to generate a new basemap with a resolution <1 km/pxl.
- Image data
The Voyager and Galileo images were acquired under very differing illumination and viewing conditions and from different observation times, although they have been taken within a short period each. Together with the varying flyby altitudes it strongly influences the images’ brightness, contrast, and resolution. Another fact is that images of Ganymede are limited, so there is barely an area covered twice with a proper resolution whereas the poles suffer from a lack of image data. To reach the highest possible coverage in the global mosaic, we selected 118 Voyager 1 and 2 images and 88 Galileo SSI images including high-resolution images (<500 m/pxl) from three close Ganymede encounters [3].
- Control
The 3D control point network was developed by the use of reconstructed spacecraft ephemerides [4] and consist of 3377 control points from 213 Voyager and Galileo images. The reprojection error is about 0.01-0.1 pixel and the coordinate accuracy of 78% of the control points is better than 5.0 km.
- Mosaicking
The selected images were reprocessed with the new pointing and orientation data and then reprojected into the final cylindrical equidistant projection, where the small crater Anat defines the longitude system at 232° East. After artefact correction, images with similar observation times and resolutions were set together to regional mosaics. The most work-intense part was the brightness and contrast correction of the regional mosaics and the remaining single images by tone-matching at the transition zones. The global Ganymede mosaic can be downloaded at https://janus.dlr.de/ and is archived at PSA: DOI – 10.5270/esa-mqhvfjf.
- Outlook
The new Ganymede basemap with a global map scale of 359 m/pxl including some high-resolution images from Galileo increases the variety of available data products and should help during pre-JUICE arrival investigations of Ganymede and support the planning process.
References
[1] Grasset et al., 2013, Planetary and Space Science, 78, 1-21, DOI: 10.1016/S0032063312003777. [2] Zubarev et al., 2016, Solar System Research, 50, 5, 352-360, DOI: 10.1134/S0038094616050087. [3] Kersten et al., 2021, resubmitted to Planetary and Space Science. [4] Zubarev et al., 2015, Planetary and Space Science, 117, 246-249, DOI: 10.1016/S0032063315002007.
How to cite: Kersten, E., Zubarev, A. E., Roatsch, T., and Matz, K.-D.: Updated Ganymede Mosaic from Voyager and Galileo observations, Europlanet Science Congress 2021, online, 13–24 Sep 2021, EPSC2021-314, https://doi.org/10.5194/epsc2021-314, 2021.
Ganymede’s dark terrain represents the older geologic unit of the satellite, subsequently crosscut by swaths belonging to the younger light terrain. Compared to the light terrain, the dark terrain shows low albedo, higher crater density and morphotectonic structures called furrows. These structures are radial or circumferential fragments of troughs bounded by high albedo rims and a low albedo floor, generally thought being the remnants of a multi-ring impact basin similar to the Valhalla or Asgard basins on Callisto [1, 2]. In particular, in Galileo Regio and Marius Regio, the furrow systems show a concentric pattern centered at around 20° S 180° W, which is the assumed location of the crater formed by an impactor of 50-150 km in radius [3, 4]. Many furrows have been preserved until the present day in their pristine form, while some of them have acted as zones of weakness re-used by subsequent tectonic deformation. For this reason, they show a more complex morphology and are likely considered as precursors of light grooved terrain formation.
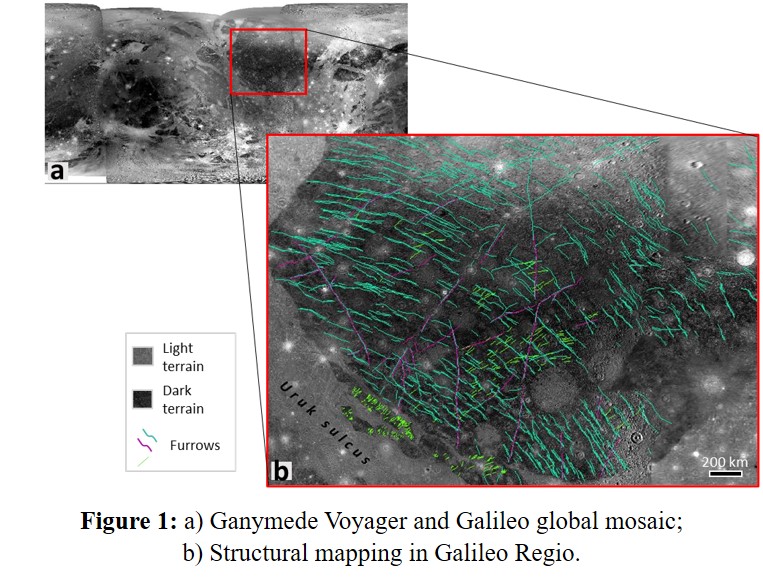
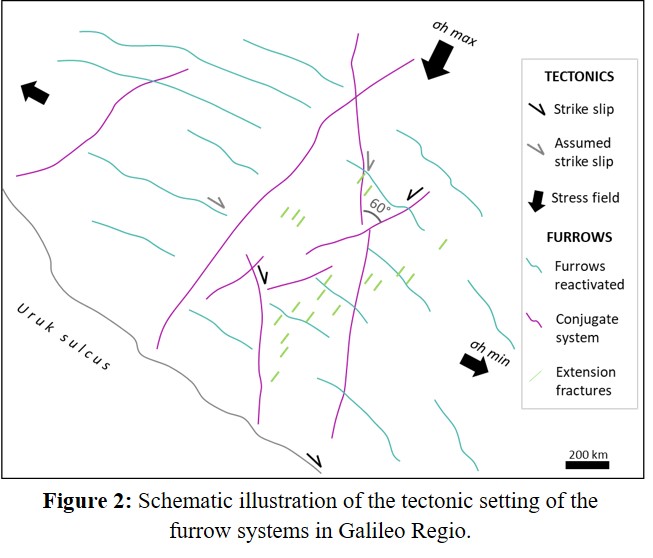
In this contribution, we perform a structural mapping at the regional scale of the furrows in Galileo Regio, identifying their hierarchy and tectonic setting originated by the regional scale kinematics. Our mapping reveals that transpression, already recognized in the adjacent Uruk Sulcus area [5], affects the dark terrain of Galileo Regio, too. We mapped the structures in Galileo Regio (Fig. 1) by considering their spatial distribution and crosscutting relationships. In addition, we mapped the local-scale fractures that have tectonically modified remnants of furrows by leaving a deformation zone with higher albedo with respect to the surrounding dark material. These fractures show geometries and features associated with the Riedel shear, and synthetic and antithetic structures that form in strike-slip regimes [6]. The NE-SW and NW-SE trending structures that crosscut the concentric furrow systems occur from Uruk Sulcus to approximately 60° N and have been recognized as conjugate (Fig. 2). Hence, the setting of the mapped furrows and their associated structures allows identifying the (paleo)stress field that has affected this dark terrain. We infer that Galileo Regio has been characterized by regional kinematics consistent with the right-lateral transpression that has affected Uruk Sulcus. It is possible to recognize a ≈ NE-SW trending maximum horizontal stress (σh max) responsible for a shortening associated with strike-slip in the area that extends from 180°-120° W to 0°-60° N. Therefore, we can assume that the dark terrain has been deformed by the same tectonic processes that have formed the light grooved terrain of Uruk Sulcus.
This work confirms the key role that transpression has played in the leading hemisphere of Ganymede and the reactivation (and possibly the inversion) of the furrows in Galileo Regio, which have followed a deformation history beginning from an impact origin to a tectonic remodeling. Further geo-statistical analysis will be performed to support this reconstruction. Obtained results from this study will be used for the scientific preparation of dedicated high-resolution observations that will be taken with the JANUS instrument [7] onboard JUICE mission [8].
Acknowledgements:
The activity has been realized under the ASI-INAF contract 2018-25-HH.0.
References:
[1] McKinnon, W.B., Melosh, H.J., 1980. Evolution of planetary lithospheres: evidence from multiringed structures on Ganymede and Callisto. Icarus 44 (2), 454–471. https://doi.org/10.1016/0019-1035(80)90037-8.
[2] Prockter, L. M., Figueredo, P. H., Pappalardo, R. T., Head, J. W., & Collins, G. C. (2000). Geology and mapping of dark terrain on Ganymede and implications for grooved terrain formation. Journal of Geophysical Research: Planets, 105(E9), 22519-22540.
[3] Prockter, L.M., Collins, G.C., Murchie, S.L., Schenk, P.M., Pappalardo, R.T., 2002. Ganymede furrow systems as strain markers: implications for evolution and resurfacing processes. In: 33rd Lunar and Planetary Science Conference, Abstract #1272. Lunar and Planetary Institute, Houston.
[4] Hirata, N., Suetsugu, R., & Ohtsuki, K. (2020). A global system of furrows on Ganymede indicative of their creation in a single impact event. Icarus, 352, 113941.
[5] Rossi, C., Cianfarra, P., Salvini, F., Mitri, G., Massé, M., 2018. Evidence of transpressional tectonics on the Uruk Sulcus region, Ganymede. Tectonophysics 749, 72–87. https://doi.org/10.1016/j.tecto.2018.10.026
[6] Fossen, H. (2010). Structural geology. Cambridge, UK: Cambridge University Press.
[7] Palumbo, P. et al. 2014. JANUS: The Visible Camera Onboard the ESA JUICE Mission to the Jovian System. 45th LPSC Meeting. Abstract #2094.
[8] Grasset, O., Dougherty, M. K., Coustenis, A., Bunce, E. J., Erd, C., Titov, D., et al. (2013). JUpiter ICy moons Explorer (JUICE): An ESA mission to orbit Ganymede and to characterise the Jupiter system. Planetary and Space Science, 78, 1–21.
How to cite: Rossi, C., Lucchetti, A., Massironi, M., Pozzobon, R., Penasa, L., Munaretto, G., Pajola, M., and Cremonese, G.: Dark Terrain shortening and strike-slip in Galileo Regio, Ganymede., Europlanet Science Congress 2021, online, 13–24 Sep 2021, EPSC2021-567, https://doi.org/10.5194/epsc2021-567, 2021.
The surface of Ganymede has first been observed by the Voyager missions in 1970’s highlighting the presence of a deeply tectonized environment. Galileo Mission in 1996 imaged the Jovian satellites also providing at high-resolution images at targeted places during its flybys. Ganymede's crust is mainly composed of a brittle ice overlying a subsurface ocean, whose depth was constrained to be ~100-150 km [1]. The surface of Ganymede can be subdivided into dark and bright terrains depending on their crater density, differences in albedo and surface morphology. The latter is driven mainly by tectonization, characterized by presence of furrows and grooves. These structures represent the brittle deformation of the icy shell.
We focus on the bright terrain located in the region of Uruk sulcus, a NW-SE terrain ~400 km wide and ~2500 km long located between 150W -180W and 30N-10 S strongly deformed by sets of parallel/sub-parallel (often evenly-spaced) grooves both at a regional and local scale. The presence of such structures in light terrains is hypothesized to be determined by tilt-block normal faulting [2], by crustal necking similar to mid ocean ridges [3], or by major dextral transpression, as in the case of Uruk sulcus [4]. It has been demonstrated that such structures show a fractal spatial clustering, and represent a preferential pathway for fluid from the ~100-150 km-deep ocean [1]. We are testing different 3D geomodelling approaches hence deriving more information on both the volume of the fractured brittle ice crust and the most favored location of actual percolation.
Nowadays 3D geomodelling is approaching the planetary geology framework, as testified by the outcomes of the PLANMAP Horizon 2020 project [5, 6, 7, 8, 9]. With information either derived from direct surface observations and measurements and/or also constrained by geologic interpretation, it is possible to derive a 3D geomodel of the subsurface that represents specific geologic properties or geometries.
We built a preliminary Uruk sulcus model geometry using the global DEM [10] as an initial, low-resolution surface textured with the controlled global mosaic from DLR of Voyager 1, 2 and Galileo images at an average resolution of 359 m/pixel. This served as an upper surface boundary to project the structural mapping from Rossi et al., (2020) and also as an anchor point to reconstruct the major Uruk sulcus structures. As a lower model boundary, the icy crust is constrained at depth by the ocean-ice interface. We used the depth value calculated using the fractal clustering analysis in [1] related to Uruk sulcus.
We were able to reconstruct a preliminary qualitative model of the fault geometries for GUS1 (Grooves of Uruk Sulcus 1) system deformation ([4] as a large-scale structural framework. As a first test we focused on a smaller region in the sigmoidal area named S2 and containing the GUS3 (see white square in figure 1b).
We extracted a voxel-based volume of icy crust comprised between the surface, the lower ocean-ice interface bounded by the major fault lines delimiting GUS3. At this location a major set of high-angle extensional structures at NE-SW arranged in a right-stepping en-echelon geometry are present, together with other two lower in number grooves families with NW-SE and NS orientations. With this voxel-based volume and knowing the scaling laws of the size distributions of these feature and their azimuths, it is possible to simulate a DFN (Digital Fracture Network) for each of the fractures’ families (fig. 2a). With the DFN it is possible to infer possible high-connectivity locations in the fractured ice volumes and their location at the surface (figure 2b). Further quantitative analysis work on the DFN and the volume of ice will allow to simulate the movement along the major structures backwards and forward in time in order and to capture the strain in the ice volume by incorporating its rheological parameters, and also test the transpression vs necking approach.
The 3D geomodelling approach appears as a promising tool not only for scientific analysis but also to identify interesting target of future JUICE observation, where resurfacing or deep fluid expulsions could be more favored.

Figure 1: a) The structural map by[4] with the families of grooves (GUS). In b) the 3D geometric reconstruction of the larger GUS1 structures. This analysis is focused in the white box

Figure 2: In a) the modelled DFN with the three families of major structures and in b) voxel-based volume showing areas at higher connectivity.
Acknowledgements:
The activity has been realized under the ASI-INAF contract 2018-25-HH.0.
References:
- [3] Pizzi, A., Domenica, A.D., Komatsu, G., Cofano, A., Mitri, G., Bruzzone, L., 2017. Spreading vs. Rifting as modes of extensional tectonics on the globally expanded Ganymede. Icarus 288, 148–159. https://doi.org/10.1016/j.icarus.2017.01.034
- [4] Rossi, C., Cianfarra, P., Salvini, F., Mitri, G., Massé, M., 2018. Evidence of transpressional tectonics on the Uruk Sulcus region, Ganymede. Tectonophysics 749, 72–87. https://doi.org/10.1016/j.tecto.2018.10.026
- [1] Lucchetti, A., Rossi, C., Mazzarini, F., Pajola, M., Pozzobon, R., Massironi, M., Cremonese, G., 2021. Equatorial grooves distribution on Ganymede: Length and self-similar clustering analysis. Planetary and Space Science 195, 105140. https://doi.org/10.1016/j.pss.2020.105140
- [2] Pappalardo, R.T., et al., 1998. Grooved Terrain on Ganymede: First Results from Galileo High-Resolution Imaging. Icarus 135, 276–302. https://doi.org/10.1006/icar.1998.5966
- [7] Pozzobon, R., Penasa, L., De Toffoli, B., Rossi, A. P., & Massironi, M. (2020). 3D geo-models based on multiple datasets on Mars (implicit or explicit modelling) (Public D6.1; Planmap Deliverable).
- [8] Penasa, L., Pozzobon R., Rossi, A. P., Massironi, M., (2020), 3D geo-models based on multiple datasets on the Moon (implicit or explicit modelling) (Public D6.2; Planmap Deliverable).
- [9] Pozzobon, R., Penasa, L., Massironi, M., Ferrari, S., (2021) 3D geo-models based on multiple datasets on Mercury (explicit modelling) (Public D6.3; Planmap Deliverable).
- [6] Massironi, M., Rossi, A. P., and the PLANMAP Consortium, PLANMAP Final report 2021
- [5] Massironi, M. et al., 2018. Towards integrated geological maps and 3D geo-models of planetary surfaces: the H2020 PLANetary MAPping project, in: EGU General Assembly Conference Abstracts, EGU General Assembly Conference Abstracts. p. 18106.
- [10] Zubarev, A., Nadezhdina, I., Brusnikin, E., Giese, B., Oberst, J., 2017. A search for Ganymede stereo images and 3D mapping opportunities. Planetary and Space Science 146, 40–54. https://doi.org/10.1016/j.pss.2017.07.021
How to cite: Pozzobon, R., Rossi, C., Lucchetti, A., Massironi, M., Pajola, M., Penasa, L., Munaretto, G., and Cremonese, G.: 3D geological model of Uruk Sulcus on Ganymede: modeling approach and first insights, Europlanet Science Congress 2021, online, 13–24 Sep 2021, EPSC2021-727, https://doi.org/10.5194/epsc2021-727, 2021.
The Jovian satellite Ganymede experienced a pronounced period of tectonic resurfacing forming the extended bright or light terrain the so-called Sulci, which cover about 2/3 of Ganymede’s surface (Pappalardo et al., 2004 and references therein). It crosscuts the older dark terrain of the so-called regions by long swaths of subparallel grooves or separates the different regions by a complex network of tens to kilometer wide polygons/cells (Patterson et al., 2010, Collins et al., 2013), with each cell being characterized by a different density and orientation of the structural grooves. Previous studies indicated that different tectonic styles are apparent reaching from roughly evenly spaced grooves oriented in a single dominant direction to smooth surface areas with only faint or undetectable grooves at decameter to kilometer resolution (Collins et al., 1998, Patterson et al., 2010) with cryovolcanic resurfacing playing a possible role in the formation of the latter.
In order to better understand the formation of the bright terrain and its possible interaction with a subsurface ocean its investigation has been made one of the top goals of the upcoming JUICE mission (Grasset et al., 2013). For the purpose of preparing for the JUICE mission and maximizing its science return, we re-investigate the available Voyager ISS and Galileo SSI data set. Our focus lies on the characterization of the bright terrain, its contact to the dark terrain, the definition and characterization of the tectonic subunits/cells and their stratigraphic relationship to each other. The work is supported by the estimation of the surface ages from crater frequency distributions and compositional information derived from Galileo NIMS data. The goal is to study the local formation process and to identify any changes in tectonic style through time, but also to compare the formation process of the bright terrain across Ganymede’s entire surface in order to reveal any global/regional differences in the past tectonic activity, and to characterize possible differences and similarities of the bright terrain at different locations on the body.
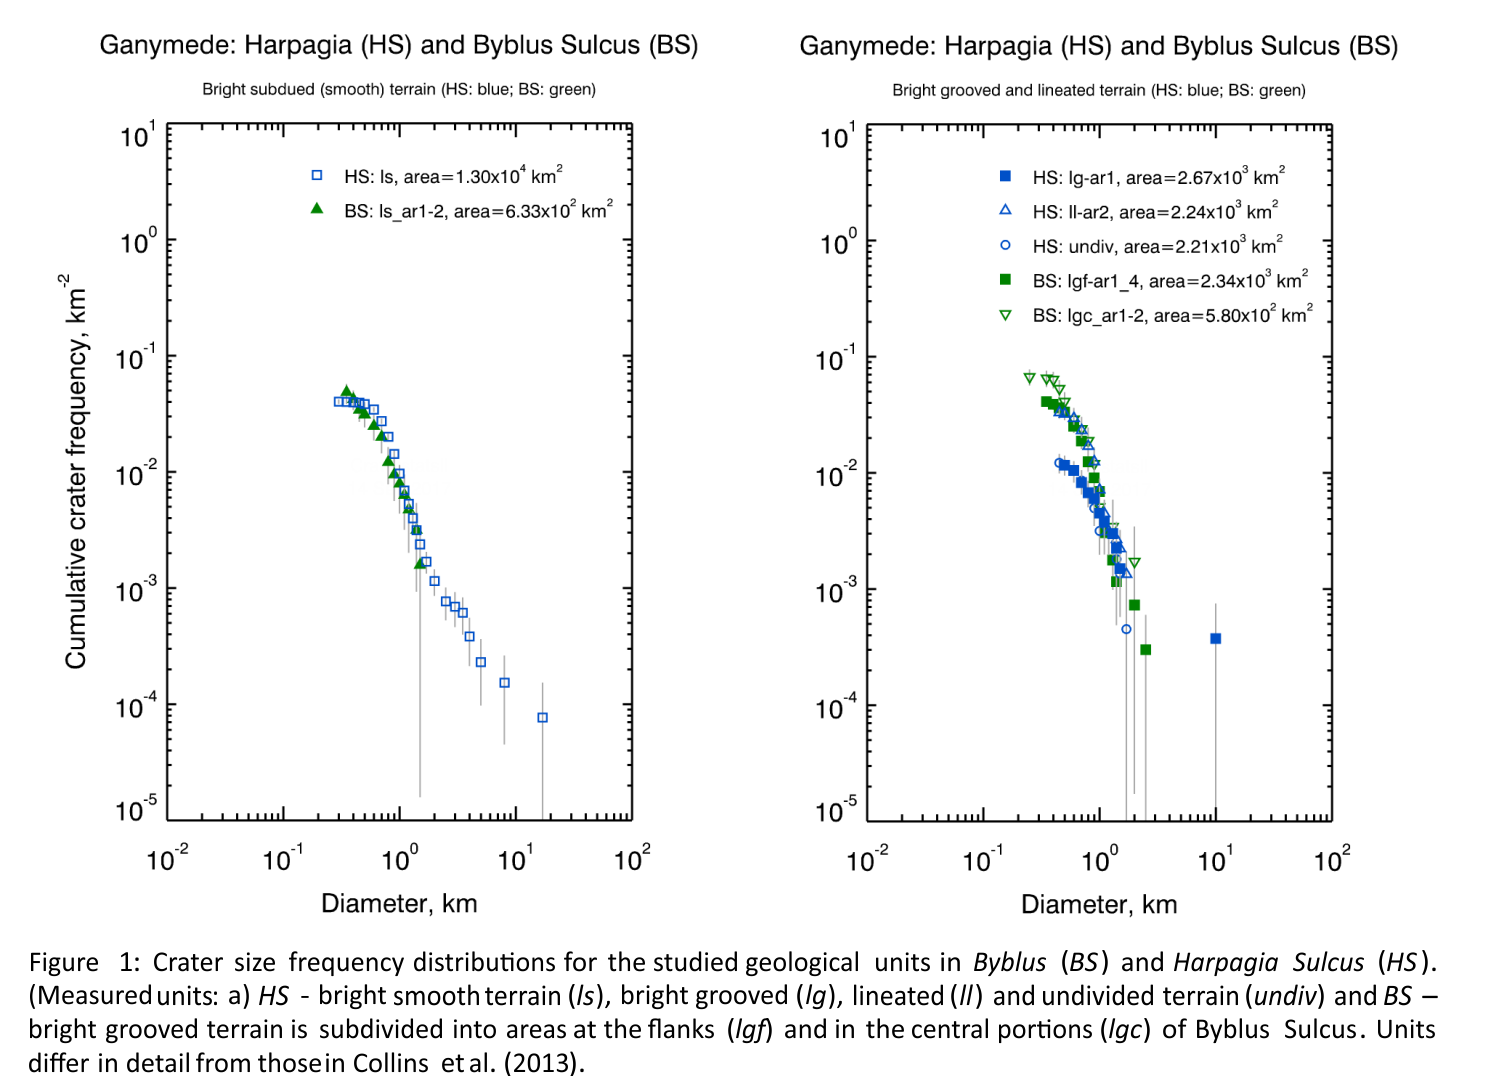
Among the studied areas are a portion of Byblus Sulcus (~40°N/160°E) and of Harpagia Sulcus (~16°S/50°E) located in the northern portion of the anti-Jovian hemisphere and in the southern portion of the sub-Jovian hemisphere, respectively. Byblus Sulcus is a 30 km broad and NNW-SSE oriented band reaching from Philus Sulcus into the dark terrain of Marius Regio, where it meets the east-west trending grooved lane named Akitu Sulcus, which is truncated by the grooved and smooth terrain of Byblus Sulcus and thus is relatively older. Whereas the ancient neighboring dark terrain is already highly furrowed, Byblus Sulcus is mainly characterized by grooved terrain (lgf and lgc) and smaller areas of smooth terrain (ls) on its northern border to the dark terrain of Marius Regio. Byblus Sulcus is superimposed by small two dark floor craters with a dark inner and bright outer halo of ejecta material representing the youngest features in this region.
The imaged portion of Harpagia Sulcus covers a 20-km broad region of bright or light material units including the light grooved terrain (lg), a smooth-subdued terrain in the middle (ls), the lineated terrains (ll) on either sides of the smooth-subdued terrain and a region of undivided terrain (undiv) on the southern side of the Sulcus. The smooth-subdued terrain accounts for a comparably large number of craters as compared to other terrains and is being crosscut by the lineated terrains on either sides and the light grooved terrain on the eastern and southern sides, evidenced by the presence of sharp boundaries separating them. So, the smooth-subdued terrain is supposed to be older than other terrains. The light grooved terrain is supposed to be much younger terrain since it crosscuts the lineated terrain and accounts for the smaller number of craters. Lineated terrains to be intermediate in age between light grooved terrain and smooth-subdued terrain. Nevertheless, crater density frequency indicates a narrow timescale.
While the crater frequency areas of measurement of the dark terrain units in Byblus Sulcus are clearly higher than those from bright terrain, inferring a higher age, the bright units in both the Byblus and Harpagia Sulcus show crater frequencies more or less identical within measurement uncertainties. Whether this is a general feature of Ganymede’s bright terrain, or specific to these two selected regions, will be a major issue in our ongoing studies. Also, bright grooved and smooth units cannot be separated very well in terms of crater frequencies in both regions. Since the existing cratering chronology models by Neukum et al. (1998) and Zahnle et al. (2003) are highly uncertain, it is difficult to infer if Ganymede was tectonically active only over a short period of time or over a much longer period, as implied by low impact rates in the Jovian system (e.g., Zahnle et al., 2003).
References:
Pappalardo, R. T. et al. (2004) Geology of Ganymede, in Bagenal, F., ed., Jupiter. The Planet, Satellites and Magnetosphere, 363-396.
Collins, G. C. et al. (1998), Formation of Ganymede Grooved Terrain by Sequential Extensional Episodes: Implications of Galileo Observations for Regional Stratigraphy: Icarus, 135, 1, 345-359.
Patterson, G. W. et al. (2010) Global geological mapping of Ganymede: Icarus, 207, 2, 845-867.
Collins, G. C. et al. (2013) Global geologic map of Ganymede, p. 3237.
Grasset, O. et al. (2013) JUpiter ICy moons Explorer (JUICE): An ESA mission to orbit Ganymede and to characterise the Jupiter system: PSS, 78, 1-21.
Neukum, G. et al. (1998). Cratering chronology in the Jovian system and the derivation of absolute ages: Lunar Planet. Sci. Conf. XXIX, abstr. No. 1742.
Zahnle, K. et al., (2003). Cratering rates in the outer Solar System: Icarus 163, 263-289.
How to cite: Baby, N. R., Stephan, K., Wagner, R., Krohn, K., and Schmedemann, N.: Stratigraphic studies of Ganymede’s tectonic activity in the bright terrain: results from the Byblus Sulcus and Harpagia Sulcus regions, Europlanet Science Congress 2021, online, 13–24 Sep 2021, EPSC2021-352, https://doi.org/10.5194/epsc2021-352, 2021.
Jupiter’s largest moon, Ganymede, is the main target of the upcoming ESA mission JUpiter ICy moons Explorer (JUICE), which is planned to launch in 2023. One of the top priorities of the JUICE mission is investigation of past and/or recent cryovolcanic and tectonic activity and the exchange processes with the subsurface and possibly with the ocean (Grasset et al., 2013). Following that objective, the science team has defined ‘potential cryovolcanic regions’ as a category of high interest for observation by JUICE (Stephan et al. 2021). Hence, for preparation of the scientific return of the mission, it is important to study in detail the regions that are considered to be good candidates for past or present activity.
Areas on Ganymede imaged by Voyager that showed the presence of dark terrain were speculated to represent a heavily cratered surface modified by cryovolcanism (e.g., Murchie et al., 1989); however, this was disputed based on the higher-resolution images of the Galileo mission (e.g., Pappalardo et al., 2004). Light material observed by the Voyager instruments was similarly suggested to represent dark terrain resurfaced by cryovolcanic flows (e.g., Parmentier et al., 1982). Later, Galileo high-resolution data showed the significant role of tectonism in the formation of these areas, while the role of cryovolcanism remained inconclusive due to the limited resolution of the available data and secondary processes that complicate their interpretation, such as fracturing, mass wasting, etc (e.g., Patterson et al., 2010). Currently, small, isolated depressions called ‘paterae’, are the best candidate regions for cryovolcanic activity on Ganymede and suggested to be potential caldera-like cryovolcanic source vents (Fig. 1;2)(e.g., Lucchita, 1980; Spaun et al. 2001). Collins et al. (2013) characterize the paterae as ‘flat-floored depressions surrounded by inward-scalloped walls, breached on one side and typically associated with light subdued materials’ while they interpret their nature as ‘possible cryovolcanic source vents for extrusion of clean icy material to form light material units’. The small size of paterae (20 x 70 km at most) is consistent with a cryovolvanic origin that operates on a local scale.
The high-resolution JUICE camera, JANUS, in combination with other remote sensing instruments, is expected to resolve many of the mysteries concerning cryovolcanism on Ganymede and the origin of the moon’s varied geologic features. The known paterae (Fig. 1) are located in smooth and bright terrains, where extensional tectonism and volcanism are speculated to have operated concurrently (Pappalardo et al. 2004). The ‘potential cryovolcanic regions’ identified by the JUICE team includes 19 out of 30 paterae mapped by Collins et al. (2013) using Voyager and Galileo images. In this study, we provide a thorough view of all 19 paterae regions and a constructional comparison of their characteristics in order to constrain the morphology of the paterae and their surroundings, in preparation of the JUICE mission and its science return.
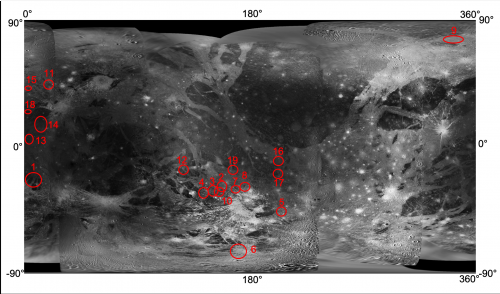
Figure 1. Locations (red circles and ellipsoids) of 19 paterae identified as ‘potential cryovolcanic regions’ that are of high interest for JUICE observations (Stephan et al. 2021). Basemap: Galileo Solid State Imaging (SSI)/Voyager Imaging Science Subsystem (ISS) mosaic.
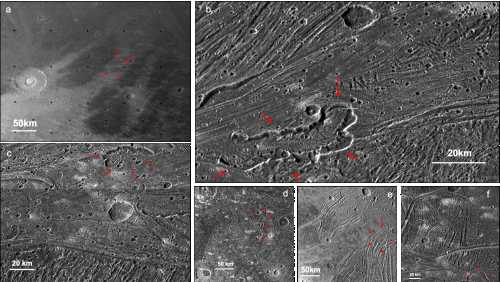
Figure 2. Major Ganymede Paterae as observed from the Voyager and Galileo instruments: a. Hammamat (1 in Fig. 1); b. Musa (4); c. Rum (2); d. Yaroun (5); e. Hamra (6); f. Natrun (2). Data from: Galileo Solid State Imaging (SSI)/Voyager Imaging Science Subsystem (ISS).
References: Grasset et al. (2013), PSS, 78, 1-21; Stephan et al. (2021), PSS in press; Murchie et al. (1989). Icarus, 81, 271-297; Pappalardo, R., et al. (2004), Cambridge, UK: Cambridge University Press; Parmentier, E., et al. (1982). Nature, 295, 290-293; Patterson, G., et al. (2010). Icarus, 207, 845-867; Lucchita, (1980). Icarus, 44, 481-501; Spaun et al. (2001), LPSC, 32; Collins, et al. (2013), USGS Scientific Investigations Map 3237, 4.
Acknowledgments: This work was conducted at the California Institute of Technology (Caltech) under contract with NASA. K.K. was supported by the Czech Science Foundation through project No. 19-10809S. ©2021 California Institute of Technology. Government sponsorship acknowledged.
How to cite: Solomonidou, A., Stephan, K., Kalousova, K., and Soderlund, K.: Candidate cryovolcanic regions on Ganymede: a target priority for JUICE, Europlanet Science Congress 2021, online, 13–24 Sep 2021, EPSC2021-81, https://doi.org/10.5194/epsc2021-81, 2021.
Two major terrain units dominate Ganymede’s surface: 1) the ancient heavily cratered dark terrain and 2) the tectonically resurfaced bright or light terrain (Collins et al., 2013). Previous studies suggest that the dark material is a relatively thing lag deposition overlying a brighter ice-rich subsurface formed by processes such as impact gardening, thermal segregation, and mass wasting (Prockter et al., 1998). The younger bright or light terrain cross cutting the older dark terrain formation is believed to have formed predominantly through the modification of dark terrain by tectonic and possibly also cryovolcanic resurfacing processes (Collins et al., 1998). Particularity, the better understanding of the formation of the bright terrain and its possible interaction with a subsurface ocean makes its investigation one of the top goals of the upcoming JUICE mission (Grasset et al., 2013). In order to prepare for the JUICE mission and maximizing its science return, we started the re-investigated the available Galileo SSI and NIMS data set. In this work, we focus on Ganymede’s numerous impact craters that have been directly emplaced at the border of both terrains. Often fresh impact craters and their ejected material offer a glimpse into the subsurface properties. Therefore, the study of the selected impact craters could enable to reveal any changes in the bright terrain properties during its formation compared to the subsurface of the dark terrain. Variations in the subsurface properties could be indirectly mirrored in the morphology and surface texture of the crater material, the superimposed crater density but also the composition of the crater material excavated for the subsurface.
We present a detailed analysis of these craters based on Galileo SSI images focusing on morphology, albedo, surface texture of the crater material accompanied by surface age measurements.
These investigated impact craters are distributed across Ganymede’s entire surface and include ancient palimpsests and penepalimpsest, impact craters of different morphologies including pit, dome and pedestal craters, but also fresh dark ray and bright crater craters as well crater chains (catenea) with diameters from a few to about hundreds of kilometers. All investigated impact craters superimpose both dark and bright terrain and thus have been emplaced during or after the bright terrain formation.
One of the most prominent and best imaged examples of these kind of impact craters is Melkart (~10°S/174°E), which is located directly at the border between the ancient dark terrain of Marius Regio and a N-S trending branch of younger bright terrain extending from Sippar Sulcus (Fig.1). The central dome is affected by fractures and lineaments, which are thought to be caused by stretching of the outer skin (Schenk 2010). Furthermore, the dome is surrounded by an irregular depression of smooth material. The boundary between the bright and the dark material is displayed by a tectonic lineament crosses the crater directly along its central dome and straightened the dome slightly in NNW- ESE direction. The lineament not only crosses the dome, where it is more prominent, but also the knobby crater floor (Fig.2).
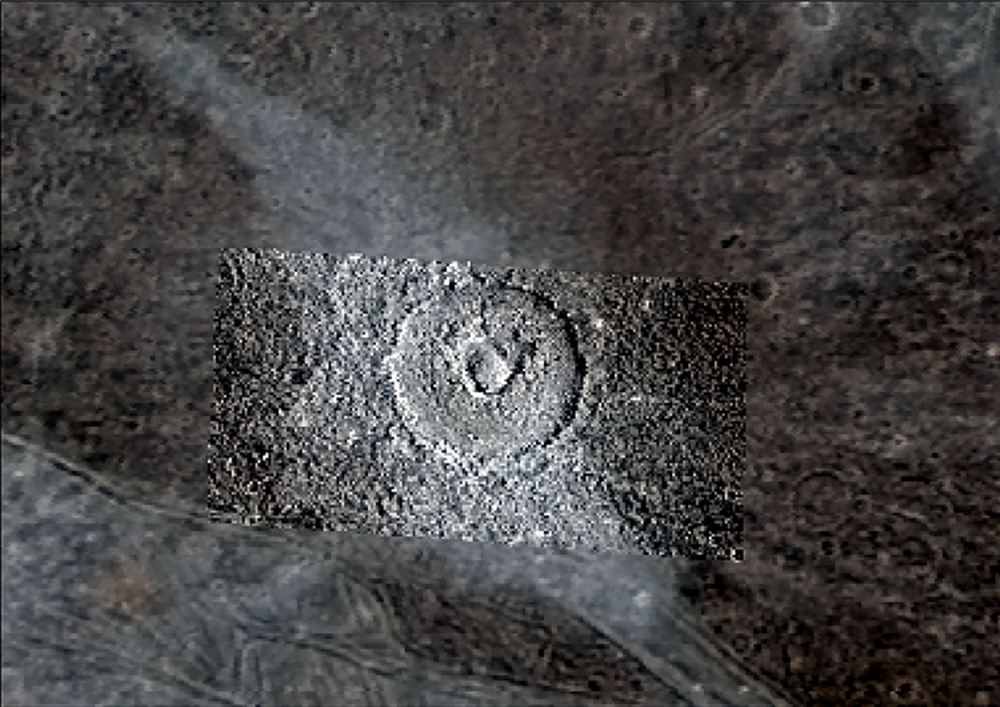
Fig. 1: Voyager-Galileo SSI color mosaic of Melkart crater showing the dark bright boundary.
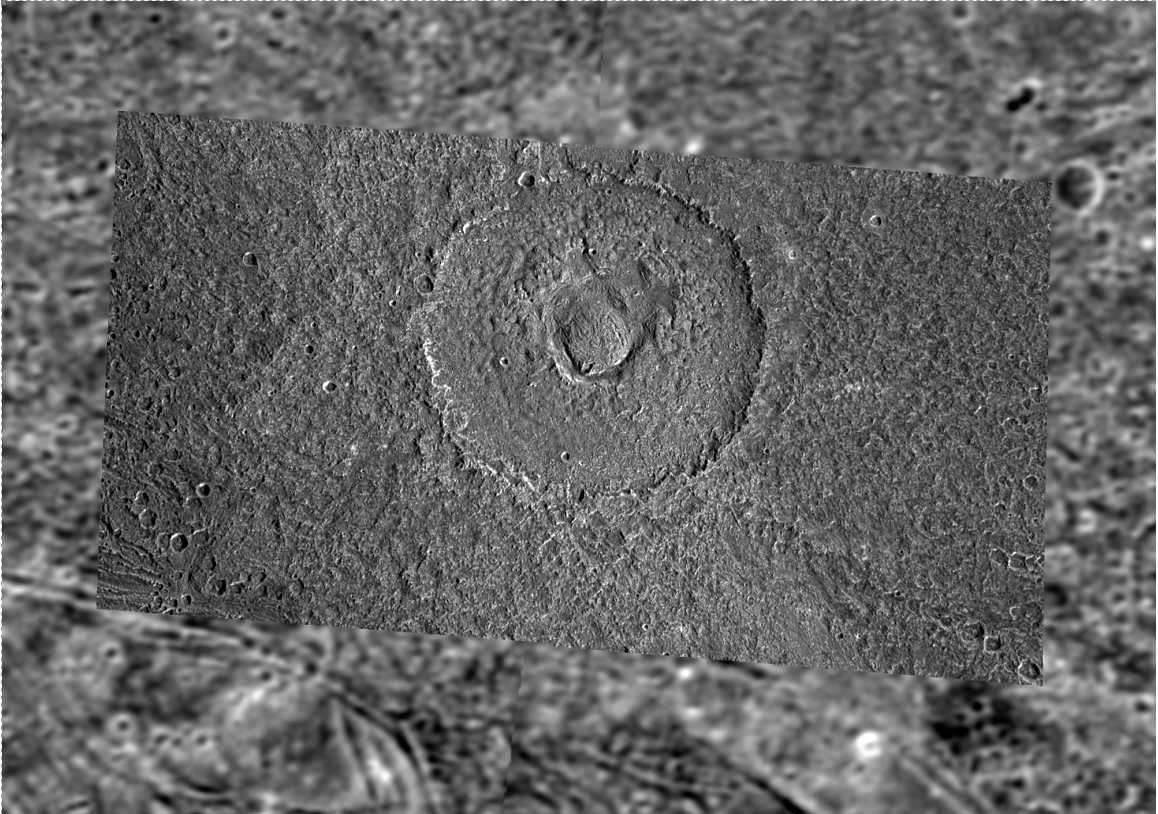
Fig. 2: Type locality of impact craters emplaced at the border of bright and dark terrain: Dome crater Melkart imaged by Galileo SSI (G8GSMELKRT01).
References:
Collins, G. C. et al. (1998), Formation of Ganymede Grooved Terrain by Sequential Extensional Episodes: Implications of Galileo Observations for Regional Stratigraphy: Icarus, 135, 1, 345-359.
Collins, G. C. et al. (2013) Global geologic map of Ganymede, p. 3237.
Grasset, O. et al. (2013) JUpiter ICy moons Explorer (JUICE): An ESA mission to orbit Ganymede and to characterise the Jupiter system: PSS, 78, 1-21.
Stephan, K. et al. (2008) Ganymede's Impact Crater Melkart: An Example for a Combination of High-Resolution Spectral and Geological Analyses in the Outer Solar System, The Science of Solar System Ices (ScSSI): A Cross-Disciplinary Workshop: Houston, Lunar and Planetary Institute, Abstract #9060.
Prockter, L. M. et al. (1998) Dark Terrain on Ganymede: Geological Mapping and Interpretation of Galileo Regio at High Resolution: Icarus, 135, 1, 317-344.
Schenk, P. (2010) Atlas of the Galilean Satellites
How to cite: Krohn, K., Stephan, K., Wagner, R., Baby, N. R., and Schmedemann, N.: Crater on Ganymede emplaced at the border of the dark and bright terrain – view into the subsurface properties, Europlanet Science Congress 2021, online, 13–24 Sep 2021, EPSC2021-589, https://doi.org/10.5194/epsc2021-589, 2021.
The accretion of the Galilean icy moons within the Jovian circumplanetary disk (hereafter CPD) and the subsequent overturn of their cores led to their differentiation and the disposal of the hydrospheres at the top of the denser rocky mantles. In the most extreme cases, when the accretional energy is high enough to sublimate the icy material, volatiles are expected to settle in a liquid–vapor equilibrium between the ocean and the atmosphere. Here, we present an equilibrium model that investigates the effect of the variation of the initial oceanic compositions on the thermodynamic equilibrium between primordial oceans and their coexisting atmospheres. This model will be applied to ultimately derive links between the current compositions of Europa, Ganymede, and Callisto’s surfaces and those of their primordial hydrospheres.
Given a starting concentration of volatiles in a primordial ocean and the expected temperature of the system, our model outputs the equilibrium composition of the species involved in the vapor and liquid phase, and the atmospheric pressure with the contribution of each species (partial pressure). Using different initial concentrations, we can compare the impact of the initial ratio among the volatiles, in their final distribution in the hydrospheres. Furthermore, the model evaluates the clathrate formation, which is expected depending on the concentration of species such CO2 and CH4, and the high pressure (HP) ices formation.
The liquid–Vapor equilibrium is reached when the fugacities of both phases are equal. This translates into the following expression:
where Φi is the fugacity coefficient of component i, yiisthe molar fraction of i in the vapor phase, P is the pressure, γi is the activity coefficient of i, xi is the molar fraction of i in the liquid phase and fi0 is the reference state.
Fugacity coefficients (Φi) are obtained using the approximation from Peng–Robinson equation of state [1]:
Where a is the attraction parameter of the mixture, b is the covolume parameter of the mixture and bk of component k, P is the pressure, T the temperature, R the gas constant and Z the compressibility factor. Activity coefficients (γi) are obtained using the ex-tended UNIQUAC–Debye–Huckel model [2], and the reference state is approximated to the saturation pressure in the case of water and to Henry’s constant for the solutes (Eq. 3):
Some of the dissolved species can self–dissociate in the liquid phase and change the contribution of other species to the final thermodynamic state [3]. Therefore, we model the ocean as an electrolytic solution taking into account the acid/base equilibrium and the subsequent formation of new ions.
The highlights of the model include:
• An extended list of molecules based on cometarycomposition and CPD origin for the starting composition, such CO, CO2, CH4, NH3, H2O, CH3OH, H2S, HCN, SO2, H2O2, Kr, Ar, Xe.
• A precise estimate of clathrates formation conditionsand composition via the use of a thermodynamic statistical model [4,5]. This model provides a description of clathrates properties including structure, density and determination of whether they would sink or float and form a crust.
• Description of the thermodynamic properties of HP ices that might form at the base of the ocean, usingthe SeaFreeze EOS package [6].
References
[1] Peng, D.-Y., and Robinson, D. B., “A new two-constantequation of state,”Industrial & Engineering Chemistry Fun-damentals, Vol. 15, No. 1, 1976, pp. 59–64.
[2] Sander, B., Rasmussen, P., and Fredenslund, A., “Calculationof vapour-liquid equilibria in nitric acid-water-nitrate saltsystems using an extended UNIQUAC equation,”Chemicalengineering science, Vol. 41, No. 5, 1986, pp. 1185–1195.
[3] Marounina, N., Grasset, O., Tobie, G., and Carpy, S., “Roleof the global water ocean on the evolution of Titan’s primitiveatmosphere,”Icarus, Vol. 310, 2018, pp. 127–139.
[4] Bouquet, A., Mousis, O., Glein, C. R., Danger, G., and Waite,J. H., “The role of clathrate formation in Europa’s oceancomposition,”The Astrophysical Journal, Vol. 885, No. 1,2019, p. 14.
[5] Mousis, O., Lakhlifi, A., Picaud, S., Pasek, M., and Chas-sefiere, E., “On the abundances of noble and biologicallyrelevant gases in Lake Vostok, Antarctica,”Astrobiology,Vol. 13, No. 4, 2013, pp. 380–390.
[6] Journaux, B., Brown, J. M., Pakhomova, A., Collings, I. E.,Petitgirard, S., Espinoza, P., Boffa Ballaran, T., Vance, S. D.,Ott, J., Cova, F., et al., “Holistic approach for studyingplanetary hydrospheres: Gibbs representation of ices thermo-dynamics, elasticity, and the water phase diagram to 2,300MPa,”Journal of Geophysical Research: Planets, Vol. 125,No. 1, 2020, p. e2019JE006176
How to cite: Tenelanda-Osorio, L. I., Mousis, O., Bouquet, A., and Danger, G.: On the distribution of volatiles in the Galilean moons’ primordial hydrospheres, Europlanet Science Congress 2021, online, 13–24 Sep 2021, EPSC2021-248, https://doi.org/10.5194/epsc2021-248, 2021.
One of the outstanding questions regarding the architecture of the Galilean moons system is the nature of the processes that shaped its density gradient, which results from the fact that Ganymede and Callisto share an ice-to-rock ratio close to unity while Io and Europa are heavily depleted in volatiles. Two categories of scenarios, gathered in two distinct phases of moons formation and evolution, have been proposed to account for this density gradient in the literature: either the building blocks of the two innermost moons Io and Europa have been depleted in volatiles during their migration in the hot part of the Jovian circumplanetary disk [1-3], or they initially accreted ice-rich building blocks in a colder environment. In this case, their primitive oceans would have mostly vanished via hydrodynamic escape due to the high accretional energy [4].
Figure 1.Thickness of Io’s primitive atmosphere (in units of satellite radius) expressed as a function of pressure (in units of surface pressure) for several temperatures.
Here, we investigate the possibility that Io also accreted from water-rich building blocks and that its hydrosphere vanished because of hydrostatic instability, i.e. when the gravity at a given height is insufficient to retain gas. Io’s putative primordial atmosphere would be either situated atop of a magma mantle, or a coexisting liquid ocean, depending on the surface temperature and pressure. To do so, we use the atmosphere model elaborated by [5,6] in which the properties of a 1D spherical atmosphere of water are generated by integrating the thermodynamic profiles bottom to top. The model takes as inputs the satellite’s mass and radius, as well as the thermodynamic conditions at its bottom. Figure 1 represents the atmosphere thickness as a function of surface pressure and temperature. It shows that atmospheric thicknesses higher than 10 Io’s radii are reached for surface temperatures equal or higher than 1250 K, indicating that such H2O-dominated atmospheres would be gravitationally unstable at those temperatures. Such high temperatures needed at the base of the atmosphere to favor hydrostatic instabilitycould result from the combination of accretional heating and heating generated by greenhouse effect. If effective, this mechanism would naturally explain why Io is devoid in volatiles without the need of invoking pre-accretional formation scenarios.
[1] Canup, R.M. & Ward, W.R. 2002, AJ, 124, 3404. doi:10.1086/344684
[2] Mousis, O. & Gautier, D. 2004, PSS, 52, 361. doi:10.1016/j.pss.2003.06.004
[3] Ronnet, T., Mousis, O., & Vernazza, P. 2017, ApJ, 845, 92. doi:10.3847/1538-4357/aa80e6
[4] Bierson, C.J. & Nimmo, F. 2020, ApJL, 897, L43. doi:10.3847/2041-8213/aba11a
[5] Marcq, E., Salvador, A., Massol, H., et al. 2017, JGR (Planets), 122, 1539. doi:10.1002/2016JE005224
[6] Marcq, E. 2012, JGR (Planets), 117, E01001. doi:10.1029/2011JE003912
How to cite: Mousis, O., Marcq, E., Aguichine, A., Leblanc, F., Mandt, K., Schneeberger, A., and Turbet, M.: Io’s dry body shaped by atmospheric instability, Europlanet Science Congress 2021, online, 13–24 Sep 2021, EPSC2021-187, https://doi.org/10.5194/epsc2021-187, 2021.
The Cassini mission revolutionized our vision on the habitability of our solar system. While the icy moons orbiting Jupiter and Saturn were supposed to be cold and inert objects well outside the habitable zone (where water can be found liquid), Cassini showed that Saturn's moon Enceladus is very active, with a warm interior heated by tidal forces (Choblet et al. 2017), allowing the presence of an ocean under a km-thick icy crust (Thomas et al. 2016). This ocean escapes through geysers (plumes) from the icy surface. Cassini performed many fly-bys through the plumes, measuring their composition and characteristics and showed that the ocean under the icy crust is salty, fed by ongoing hydrothermal activity (Postberg et al. 2009, 2011) and contains COMs, i.e. complex organic molecules (Postberg et al. 2018). Another characteristic of the plumes is their very large velocities, reaching 700-900 m/s (Yeoh et al. 2016), highlighting that plumes are due to expansion of the gas through a nozzle like crevasse. The plumes are supposed to represent the composition of the Ocean, but how plumes and the ocean are linked has been addressed by theories (Yeoh et al. 2015; Schmidt et al. 2008) but not yet experimentally. While the data provided by Cassini gave rise to many possible theories and scenarios, the latest data have been taken in 2017 and we will have to wait many years before Europa Clipper and JUICE are able to further investigate icy moons. The measurements from Cassini left us with many unanswered questions: How are the plumes' characteristics linked to the subsurface ocean? Is there life on Enceladus? And if yes, could you see it in the plumes and how would you detect it? By recreating plumes in laboratory, supported by theoretical modeling, we aim to apply reverse engineering by understanding how the characteristics of the plumes, which has been extensively observed by Cassini, can provide constrains on the characteristics of the sub-surface ocean.
We developed a setup to verify experimentally that under the icy moon’s conditions (pressure, temperature) a plume reaches hypersonic/supersonic velocities, and determined how the ocean (liquid water) translates into plumes. We designed and build a reservoir where liquid water can be frozen, mimicking the moon’s icy crust. A mould, introduced in the reservoir and removed once the water is frozen, simulates the crevasse. The mould is designed such as to establish the hypersonic/supersonic velocities in the plumes. The bottom of the reservoir contains liquid water corresponding to the subsurface ocean. The experimental setup is shown in the picture in Figure 1. We performed several experiments showing how plumes are generated in this setup and we measured the plumes' characteristics under different experimental conditions. The experiments were performed at the wind tunnel laboratories where Particle Image Velocimetry (PIV) techniques can be used to track whether particles present in the liquid water can be also found in the plumes. These experiments allowed to determine the characteristics of the plumes as well how they relate to the liquid water. Theoretical modeling based on models from Schmidt et al. (2008), have been developed to support and interpret experimental results. This model can predict the nucleation of water under experimental conditions and the formation of water clusters in the experiments. This model, benchmarked by our experimental results, can be extended to icy moons environments on large scale and compared to plumes observed withthe Cassini mission.
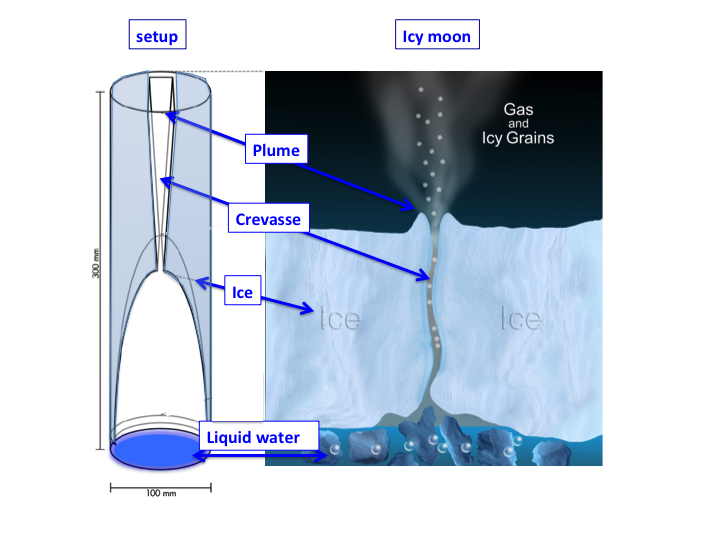
Figure 1: Sketch of the experimental setup mimicking the icy moon’s icy crust, ocean and plumes.
Bibliography:
Choblet et al. 2017, Nat Astron 1, 841847
Thomas, P.C. et al 2016 Icarus 264, 37
Postberg, F. et al. 2009 Nature 459, 1098
Postberg, F. et al. 2011, Nature 474, 620
Postberg, F. et al. 2018a, Nature 558, 564
Schmidt et al. 2008, Nature 451, 685
Yeoh et al. 2015 Icarus 253, 205;
How to cite: Cazaux, S., Sklavenitis, S., Bründl, T., van der Hijden, N., and Schrijer, F.: Icy moons’ geysers: from laboratory to theory, Europlanet Science Congress 2021, online, 13–24 Sep 2021, EPSC2021-404, https://doi.org/10.5194/epsc2021-404, 2021.
Abstract
We propose a new model of Enceladus' tiger stripes in which the ice shell is modeled as an elastic system with frictional interfaces subjected to periodic tidal loading. We find that the diurnal tides produce a complex pattern of stress anomalies, characterized by a length scale of 10 km and the peak values exceeding 100 kPa. Friction slows down the response of the system to tidal loading, leading to an asymmetry between the compression and extension phases. This asymmetry results in additional stress, which is constant in time and comparable in magnitude to the cyclic stress. The static stress field is characterized by compression in the direction perpendicular to the faults and may influence the evolution of the south polar terrain on geological time scales. The total heat flow generated by friction is 0.1-1 GW, accounting for only a small fraction of the heat power emitted from the tiger stripes.
Introduction
In Souček et al. (2016), we have numerically demonstrated a profound effect of faults (tiger stripes) on the tidally induced deformation and stress fields in the south polar region (SPR) of Enceladus. In Běhounková et al. (2017), we showed how this effect can be further enhanced in a synergetic way when combined with a realistic thinning of the ice shell in the SPR for a shell thickness model based on the inversion of gravity and libration data (Čadek et al., 2016). In both these studies, the faults were modeled as zones with significantly reduced elastic moduli. Effectively, this approach corresponds to faults being described as narrow slots partially filled with water (compensating for the overburden pressure within the layer). Such description of the faults is oversimplified since it does not take into account any friction at the faults. We attempt to circumvent this deficiency in the new study.
Model
We solve equations of deformation of a 3D Maxwell visco-elastic planetary shell containing faults in the SPR. The shell's deformation is driven by the incremental tidal potential and at the fault, Coulomb type response is considered. The Coulomb-type friction is mimicked by a continuum model of a fault zone of finite thickness with stress-limiting viscosity. The stress limiter is given by the yield stress, composed of (hydro)static contribution due to overburden pressure and a dynamic contribution due to normal stress variations during the tidal period.
Results
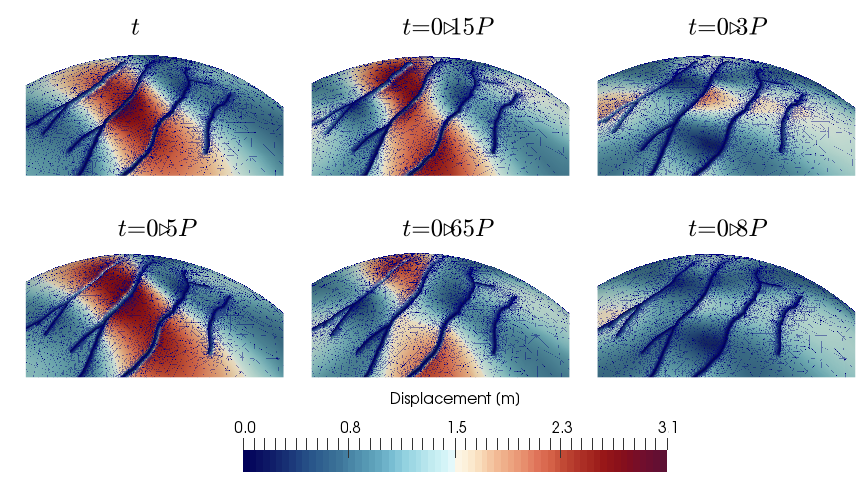
The figure shows periodic variations of the displacement field at the surface obtained for the model with a coefficient of friction 0.2. The displacement is shown for six different phases of the tidal cycle. The symbol P denotes the orbital period. Colors show the magnitude of the displacement while thin blue lines indicate the mesh used in the finite-element solver. The displacement is exaggerated by a factor of 3000 to emphasize the radial motion along the faults. In the talk, we will also address the effect of friction on Enceladus's Tiger stripes on the distribution of stresses in the SPR and on the frictional heating at faults.
Acknowledgments
The research leading to these results received funding from the Czech Science Foundation through project No. 19-10809S. The computations were carried out in IT4Innovations National Supercomputing Center (project no. LM2015070). The study was supported by the Charles University, project GA UK No. 304217, SVV-2019-260447, and SVV 115-09/260581 (K.S.).
References
Běhounková, M., Souček, O., Hron, J.and O. Čadek (2017), Plume activity and tidal deformation of Enceladus influenced by faults and variable ice shell thickness, Astrobiology, 17(9), 941-954, https://doi.org/10.1089/ast.2016.1629.
Čadek, O., Tobie, G., van Hoolst, T., Massé, M., Choblet, G., Lefèvre, A., Mitri, G., Baland, R.-M., Běhounková, M., Bourgeois, O., and Trinh, A. (2016) Enceladus’s internal ocean and ice shellconstrained from Cassini gravity, shape, and libration data. Geophys Res Lett 43:5653–5660.
Souček, O., Hron, J., Běhounková, M., and O. Čadek (2016), Effect of the tiger stripes on the deformation of Saturn's moon Enceladus, Geophysical Research Letters, 43(14), 7417–7423, https://doi.org/10.1002/2016GL069415.
How to cite: Pleiner Sladkova, K., Soucek, O., Behounkova, M., and Cadek, O.: Enceladus' tiger stripes as frictional interfaces: Effect on stress and heat production, Europlanet Science Congress 2021, online, 13–24 Sep 2021, EPSC2021-289, https://doi.org/10.5194/epsc2021-289, 2021.
Abstract
Forced librations can enhance tidal dissipation in the ice shell of Enceladus, but how such librations might affect the thermal state of Enceladus has not been investigated. Here we use the elastic libration model established by Van Hoolst et al. (2013) to investigate the effect of the libration heating on Enceladus. We find that libration heating in the ice shell is sensitive to the shell thickness, ranging from less than 1 GW to 10 GW. However, the libration heating overall is insufficient to match the inferred conductive heat loss of Enceladus. Thus, either Enceladus is not in thermal equilibrium, or (more likely) alternative heating mechanisms below the shell are taking place. If such heat sources exist, our calculations show that Enceladus would reside in a stable thermal equilibrium resisting small perturbations to the shell thickness. This does not support the occurrence of a runaway melting proposed by Luan and Goldreich (2017). These results place limits on the possible thermal history of Enceladus and emphasize the need of quantifying the tidal dissipation inside the ocean or the core.
1. Introduction
Cassini observed that Enceladus is losing heat at a high rate (e.g., Spencer et al. 2006). Cassini’s observations also indicate the presence of a global subsurface ocean inside Enceladus (e.g., Iess et al. 2014). These two observations require Enceladus to possess high endogenic heat to keep in thermal balance.
Tidal dissipation is a good candidate for the heat requirement. The shell tidal dissipation has been studied and seems insufficient to match the observed high heat flow (e.g., Behounkova et al. 2017). The ice shell experiences forced librations. These forced librations can enhance the shell tidal dissipation. Previous studies did not address the question how libration heating affects the thermal state of Enceladus. Luan and Goldreich (2017) proposed a thermal runaway scenario for Enceladus’s ice shell. Then the question emerges whether libration heating can lead to such a scenario. In this study, we will shed light on these questions.
2. Methodology
We use the elastic libration model established by Van Hoolst et al. (2013) to calculate the forced librations. This model can examine the forced librations of a tidally locked satellite with three homogeneous layers: an ice shell, a subsurface ocean and a rocky core. This model considers the finite elasticity of the shell in the calculations.
We construct 41 interior models with shell thickness varying from 5-50 km. The core size is assumed as 190 km (Hemingway et al. 2018). Densities of ice and water are fixed as 900 and 1000 kg/m3 and the ice shell viscosity is depth-dependent. Required tidal displacements are calculated via the model of Roberts and Nimmo (2008). Orbital variation data are from JPL/Horizon. We estimate ice-shell libration heating by the formula in Wisdom (2004). The conductive heat loss rate is estimated through a formula in Hemingway et al. (2018).
3. Results and discussions
Libration heating (Figure 1) is greatly dependent on the shell thickness. The libration heating reduces from 10 GW to less than 1 GW as the shell gets thicker from 5 to 50 km. However, this shell libration heating is less than the observed high heat flow on Enceladus. This suggests that additional heat sources in the ocean or in the silicate core are taking place if Enceladus is in equilibrium.
Figure 1 (a) Shell’s tidal dissipation rate (including the effect of the diurnal forced libration), (b) Love number k2 and (c) dissipation factor Qs for different interior models. The blue region is the inferred shell thickness from the libration data (Van Hoolst et al. 2016).
We add a constant heat source to study the thermal equilibrium of Enceladus. Comparing the total tidal heat to the conductive loss of Enceladus (Figure 2), we find a stable equilibrium state for Enceladus, which resists small perturbations to the shell thickness and does not favor the occurrence of a runaway melting on Enceladus.
We also consider the influence of orbital eccentricity and shell bottom viscosity on our results (Figure 2). We find that only under some extreme situations (high eccentricity and thin shell), Enceladus’s thermal equilibrium could be unstable and vulnerable to small perturbations to the shell thickness. Our results indicate that episodic heating or runaway melting (if it occurred) is unlikely to originate from the librations of Enceladus’s ice shell.
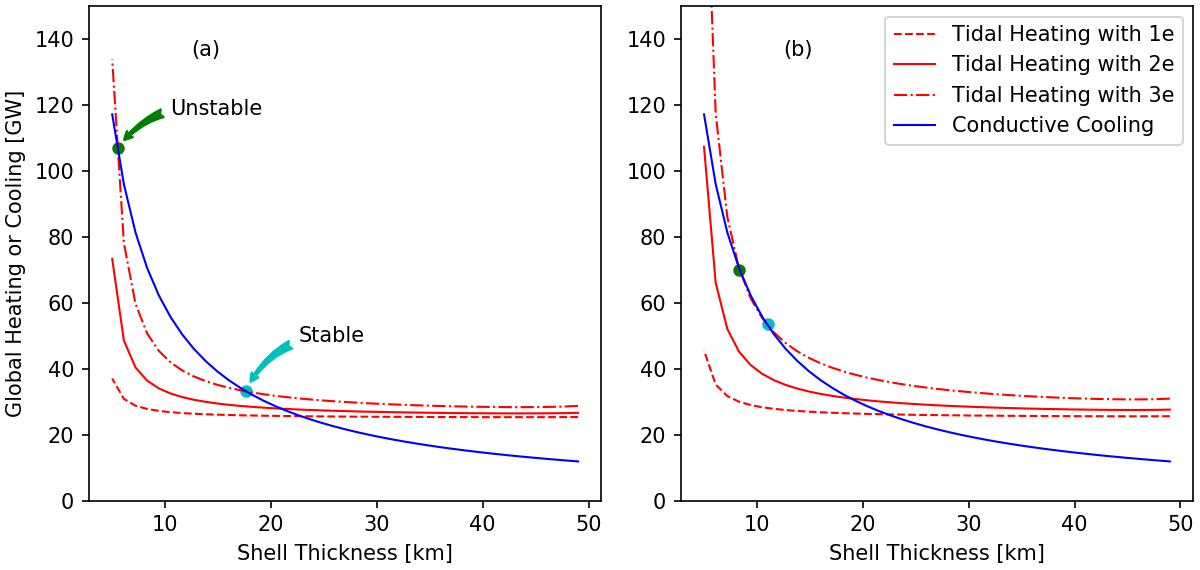
Figure 2 Total global heating rate (red) versus conductive cooling rate (blue) for interior models with the shell basal viscosity of (a) 1014 Pa s and (b) 1013 Pa s. The heating consists of dissipation in the ice shell and a heat source of 25 GW below the shell. Different line styles indicate different orbital eccentricities. Enceladus’s surface temperature is taken as 75 K. Stable and unstable equilibrium points are marked out.
References
Baland, R.-M., Yseboodt, M. & Van Hoolst, T. The obliquity of Enceladus. Icarus 268, 12–31 (2016).
Běhounková, M., Souček, O., Hron, J. & Čadek, O. Plume Activity and Tidal Deformation on Enceladus Influenced by Faults and Variable Ice Shell Thickness. Astrobiology 17, 941–954 (2017).
Hemingway, D., Iess, L., Tajeddine, R., & Tobie, G. The interior of Enceladus. Enceladus and the icy moons of Saturn, 57-77 (2018).
Iess, L. et al. The Gravity Field and Interior Structure of Enceladus. Science 344, 78–80 (2014).
Luan, J. & Goldreich, P. Enceladus: three-act play and current state. AGU Fall Meeting Abstracts 51, (2017).
Roberts, J. H. & Nimmo, F. Tidal heating and the long-term stability of a subsurface ocean on Enceladus. Icarus 194, 675–689 (2008).
Spencer, J. R. et al. Cassini Encounters Enceladus: Background and the Discovery of a South Polar Hot Spot. Science 311, 1401–1405 (2006).
Van Hoolst, T., Baland, R.-M. & Trinh, A. On the librations and tides of large icy satellites. Icarus 226, 299–315 (2013).
Van Hoolst, T., Baland, R.-M. & Trinh, A. The diurnal libration and interior structure of Enceladus. Icarus 277, 311–318 (2016).
Wisdom, J. Spin-Orbit Secondary Resonance Dynamics of Enceladus. AJ 128, 484 (2004).
How to cite: Shao, W. and Nimmo, F.: Libration Heating and the Thermal State of Enceladus’s Ice Shell, Europlanet Science Congress 2021, online, 13–24 Sep 2021, EPSC2021-433, https://doi.org/10.5194/epsc2021-433, 2021.
Introduction
The surface of Enceladus could provide one of the best places in our Solar System to investigate the potential for life. Material from plumes seen emanating from Enceladus' South Polar Region[1], which are believed to be sourced directly from the subsurface ocean, is deposited onto the satellite's icy surface[2]. Rapid resurfacing means that material in this area has not been heavily processed by radiation, so could be an excellent indicator of oceanic composition[3, 4]. To date, the only surface species detected with certainty are H2O and CO2[5], with NH3, CH4 and low molecular weight organics tentatively detected[6, 7]. More in depth analysis will only come from future missions to the Saturnian system.
The main aim of this work is to develop Enceladus ice analogues of a range of plausible compositions in conditions representative of the surface. The analogues will then be analysed using instrumentation that could be deployed on future missions. A cryogenic vacuum system has been designed in order to replicate the surface environment and grow ices. The analogues grown will be used to test protocols and analytical techniques relevant to future missions. They will then be subjected to simulated space weathering in order to cover all expected possibilities for different surface components and their fate. We will present the preliminary data of the ices grown and the results of testing of the system to ensure it is operating at optimum conditions.
Methods
In order to grow and analyse ices in conditions representative of Enceladus' surface, a vacuum chamber, previously used for analysis of pure H2O ice for the development of the Lunar Volatiles Mobile Instrumentation (LUVMI) rover[8], was repurposed.
The chamber has a 35 L capacity and two vacuum pumps that can achieve internal pressures of 10-7 mbar. The chamber is also fitted with ports to allow it to be connected to analysis equipment such as a GC-MS. The analogues are grown within a sample holder made out of copper piping wrapped around a copper cooling plate. Liquid nitrogen is injected into the chamber and flows through the piping to cool it down to temperatures of -140 °C. Gas mixtures are injected into the chamber, so that they are condensed onto the cold sample holder and form ices. The system is currently undergoing preliminary calibration and testing in order to optimise operating procedures.
H2O and H2O-salt mixtures will be inserted into the sample holder as liquids, then cooled and frozen, before the gas mixtures are inserted. A table showing the preliminary ice mixing ratios can be seen in Table 1. These preliminary compositions are based on upper limits estimated for surface components[5, 7, 9, 10]. The ices grown will be analysed initially using a GC-MS in order to fully characterise both them and the cryogenic system.
Table 1. Expected mixing ratios for ices
| Mixing Ratio | ||||
| Surface Component | Ice 1 | Ice 2 | Ice 3 | Ice 4 |
| H2O | 99% | 98% | 98% | 96% |
| CO2 | 1% | 1% | 1% | 1% |
| NH3 | - | 2% | 2% | 1.5% |
| CH4 | - | - | 2% | 1% |
| NaCl | - | - | - | 0.5% |
Currently, the main system has the capabilities to be connected to a GC-MS, but in order to preserve the ices while in transport to other pieces of equipment for further experiments, an additional system is required. This system is in development, and is designed to replicate a perfect sample oven onboard a spacecraft. A series of valves connects to an external mini chamber, which is capable of being removed from the main system. Within the mini chamber, the sample holder is connected to an external copper bar, which is submerged in liquid nitrogen in order to cool the samples. This allows the ices to be kept in relatively pristine conditions over a longer period of time while being transported. The effects of thermal and vacuum leaks on the ices within the chamber will be determined, in order to mimic potential issues with sample handling onboard a lander.
The preliminary results of ice analogue development, including physical and compositional characterisation, will be presented. In addition, the limitations of the system and how potential instrumentation issues during a mission could affect Enceladus ices will also be presented.
Future work will include investigating the effects of space weathering on the ices and their subsequent analysis. The main focus will be on impacts that are representative of E-ring grains colliding with the surface and will be investigated using a Van de Graaff Dust Accelerator.
References
[1] Porco, C et al. (2006) Science 311 1393-1401
[2] Kempf, S et al. (2018) Enceladus and the icy moons of Saturn 195-210
[3] Kempf, S et al. (2008) Icarus 193 420-437
[4] Howett, C et al. (2018) Enceladus and the icy moons of Saturn 342-360
[5] Brown, R et al. (2006) Science 311 1425-1428
[6] Brown, R et al. (2004) Space Science Reviews 115 111-168
[7] Waite, J et al. (2006) Science 311 1419-1422
[8] Gancet, J et al. (2017) 13th Symposium on Advanced Space Technologies in Robotics and Automation 1-8
[9] Emery, J et al. (2005) Astronomy & Astrophysics 435 353-362
[10] Postberg, F et al. (2009) Nature 459 1098-1101
How to cite: Richards, G., Pearson, V., Patel, M., Morgan, G., and Sheridan, S.: Development of Enceladus ice analogues for in situ analysis, Europlanet Science Congress 2021, online, 13–24 Sep 2021, EPSC2021-205, https://doi.org/10.5194/epsc2021-205, 2021.
In everyday life, the manifestations of capillarity are countless, going from liquids ascension in fibers to the dynamics of bubbles and droplets. On a scientific point of view, hydrodynamics of capillarity is a rather old field, but it is still the subject of very active researches (de Gennes et al. 2004; Drelich et al. 2020) with a wide variety of applications like micro-lenses or blood circulation. The two last decades of space exploration have revealed the existence of several extraterrestrial liquid phases: liquid methane-ethane-nitrogen mixtures in Titan’s polar regions (Stofan et al. 2007), liquid water for Enceladus (Porco et al. 2006) and probably Europa (Sparks et al. 2017), while many evidence speak in favor of the massive presence of liquid water at the surface of Mars, billions years ago (Nazari-Sharabian et al. 2020). If we consider the Bond number, we can easily show that for the same considered liquid, at the surface of celestial bodies where the gravity is smaller than the terrestrial one, the effects of capillarity may be significantly reinforced.
For instance, the small kronian satellite, Enceladus, has a crust dotted by cracks (Postberg et al. 2018), where the presence of liquid water is expected, the influence of capillarity should be strong there, compared to what we have at the surface of the Earth, since the gravity of Enceladus is aroung 0.11 m s-2 , almost two orders of magnitude lower than the terrestrial value. In this work, we address the problem of small solid particles flotation at the surface of a liquid. We also investigate some properties of extraterrestrial rain droplets and their possible ground imprints. We discuss the interaction of floating films with bubbles bursting, and we close our purpose by considering raindrops absorption into a porous soil. All physical processes are questioned in the perspective of their potential geophysical implications, a particular focus is on what could be observed by Dragonfly, the future Titan’s in situ mission.
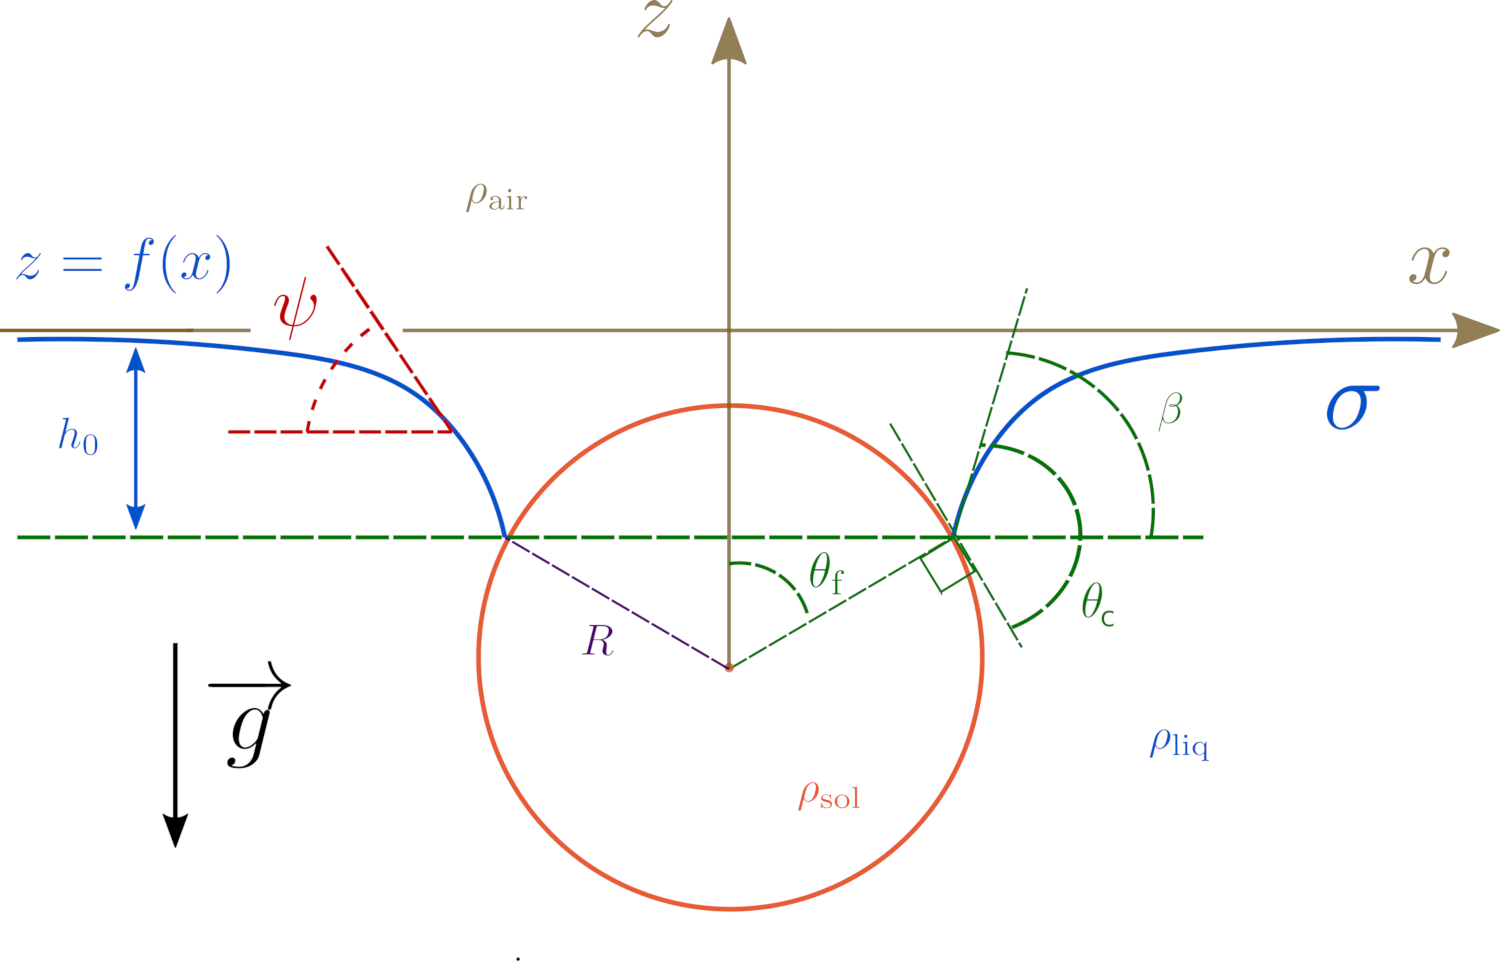
Fig. 1: Sketch of a spherical solid particle, of radius R and density ρ_sol , floating at the surface of a liquid with the density ρ_liq. The meniscus (blue line) is represented by the equation z = f (x), the surface tension of the interface is σ, while the contact angle between the solid and the liquid is denoted θc; θf is the filling angle. The difference of height between the plan of flotation and the surface of the unperturbated liquid is h_0 . The local tangent to the meniscus has the angle ψ with the horizontal. The gravity is represented by g.
An Example of process: the floatability by capillarity
The presence of some floating material, over an interface between a liquid phase and a gaseous phase, can yield to major consequences by affecting exchanges of energy, momentum and matter between the phases. The form of this floating material may vary from a tiny monomolecular microlayer to a thick layer similar to sea ice. At the surface of terrestrial oceans, the presence of a thin floating film, produced by biological activity (Lin et al. 2003), has a damping effect on wave activity; marine films is an important topic, and constitutes a full-fledged academic discipline (Gade et al. 2006). Broadly speaking, a solid material is able to float at a liquid surface with the help a two physical processes: (1) the well known Archimede’s buyoancy force, for materials less dense than the liquid, (2) capillary forces. This is the second effect we study in this paragraph. The floatability generated by capillarity has been studied for a long time since it is very relevant for flotation industrial processes (Chipfunhu et al. 2011; Mousumi & Venugopal 2016; Kyzas & Matis 2018). For the sake of simplicity, classical studies of solid particles floatability consider idealized spherical particles (Scheludko et al. 1976; Crawford & Ralston 1988), we are following this approach here (see Fig. 1). It can be easily shown (Scheludko et al. 1976; Crawford & Ralston 1988) that the radius has a maximum value Rmax for θf = θc /2 and
The implications of this equation are discussed in the contexts of Titan, Enceladus and Europa. This analysis will be complemented by other discussions about bubbles and liquid droplets properties in extraterrestrial contexts.
How to cite: Cordier, D. and Liger-Belair, G.: Capillarity processes through the solar system, Europlanet Science Congress 2021, online, 13–24 Sep 2021, EPSC2021-695, https://doi.org/10.5194/epsc2021-695, 2021.
Icy worlds of the outer solar system contain tantalizing evidence of habitability and potential life. These bodies also present extra exploration challenges due to the harsh environmental conditions at the surfaces. Thus, robust and reliable detectors are necessary for the in situ spectroscopic identification of astrobiologically relevant compounds deposited on the icy surface, entrained in thick atmospheres, or rafted in plumes. In addition, the distinction between prebiotic, extant, and relict organic molecules in such environments is needed to address life detection goals. The Ultra-Violet Detector Innovation for Raman Exploration and CharacTerization (UV-DIRECT) of ocean worlds project focuses on the development SiC- avalanche photodiode (APD) technology for UV-Raman spectroscopy and Raman imaging. Si-based Single Photon Avalanche Diodes (SPADs) have been developed for time resolved Raman spectroscopy in recent years, but SiC (Silicon Carbide) APD detectors have advantages over them. Our detector is an ultra-compact, radiation and temperature tolerant, visible blind device that has high quantum efficiency (QE) in the DUV (~260 nm) but poorer performance in the near ultraviolet (NUV) between 300-340nm that is important for Raman Spectroscopy. Our approach to improve this combines a series of numerical models with laboratory testing to enhance the QE response and ultimately the single photon detection efficiency in the NUV (~340 nm). Raman spectroscopy has established itself in current missions as an information-rich, non-contact, non-destructive method for identifying and characterizing inorganic and organic compounds in a wide variety of planetary materials. UV/NUV-Raman spectroscopy is well-suited to characterizing plume materials and surface ice deposits, since it especially sensitive to organic compounds and inorganic salts improved sensitivity due to the combination of resonance effects and the lack of background fluorescence and less risk of sample damage compared to excitation with wavelengths <260 nm. We are also improving upon the chip fabrication process to ensure a pathway forward to a smaller form factor for a linear array to enable Raman spectroscopic imaging. Acquiring point spectra can give information about what compounds are present, but Raman imaging enables the full characterization of target areas revealing spatial relationships between compounds and improves the capability of detecting biosignatures.
 Figure 1. UV-DIRECT is based on SiC-APD technology with the goal of pushing the capabilities of UV-Raman spectroscopy and Raman imaging for the exploration of icy worlds.
How to cite: Bower, D., Aslam, S., Hewagama, T., Gorius, N., Sampath, A., Schuster, J., Smith, J., Trieu, Q., Kelley, S., and Nehmetallah, G.: Enabling in situ Raman Spectroscopic Exploration of Icy Worlds: Ultra-Violet Detector Innovation for Raman Exploration and CharacTerization (UV-DIRECT) of Ocean Worlds., Europlanet Science Congress 2021, online, 13–24 Sep 2021, EPSC2021-330, https://doi.org/10.5194/epsc2021-330, 2021.
The identification of biosignatures on extraterrestrial ocean worlds is key to the search for life on these bodies. Saturn’s icy moon Enceladus, and possibly Jupiter’s moon Europa, eject plumes containing gas and ice grains formed from subsurface salty water into space [1,2,3,4]. The emitted ice grains can be analyzed by impact ionization mass spectrometers, such as the Cosmic Dust Analyzer (CDA) onboard the earlier Cassini-Huygens mission [5] or the Surface Dust Analyzer (SUDA) onboard the upcoming Europa Clipper mission [6] rendering the ocean’s composition accessible for analysis during spacecraft flybys [7]. CDA data collected in the Saturnian system revealed that Enceladus’ ocean is salty [8] and contains a variety of organic material, including complex macromolecules [9] and low mass volatile compounds [10]. These low mass compounds can potentially act as amino acid precursors and could be capable of interacting within or near Enceladus’ hydrothermal vent systems [11], or Enceladus’ porous rocky core [12]. These findings enhance Enceladus’ relevance as a habitable environment potentially able to support microbial life in its subsurface ocean. However, biosignatures have not yet been identified in extraterrestrial environments.
The Laser Induced Liquid Beam Ion Desorption (LILBID) experiment is proven to accurately reproduce impact ionization mass spectra of ice grains recorded in space [13]. Previous analogue experiments using this setup have shown that amino acids, fatty acids and peptides could successfully be detected in simulated ocean world scenarios [14,15]. The next step is to investigate whether the characteristic mass spectral fingerprints of bacterial life forms, if enclosed in ice grains, could also be detected and identified by SUDA-type instruments.
We therefore conducted high sensitivity LILBID experiments on extracts of two bacteria, Sphingopyxis alaskensis (S.alaskensis) and Escherichia coli (E.coli), to simulate their characteristic spectral features in cationic and anionic impact ionization mass spectra. E. coli is a well-studied model bacterium, and S. alaskensis is a model oligotroph, abundant in marine environments. The predictable, small size of S. alaskensis (<0.1 µm3) and its ability to utilize low concentrations of nutrients [16] makes it a suitable analogue bacterium for potential lifeforms on extraterrestrial oceans. Laboratory spectra of extracted bacterial DNA, lipids and the corresponding aqueous phases produced during their extraction - potentially containing polar molecules - were performed. To simulate the salty Enceladean or Europan ocean water, the extracts have been investigated in background solutions with increasingly high NaCl concentrations.
In the mass spectra, we observe mass lines identified as microbial fragments, corresponding to fatty acids derived from the bacteria’s membrane lipids. In the S. alaskensis and E. coli DNA mass spectra we also identify nucleobases and compounds produced from the phosphate deoxyribose backbone. The recorded mass spectra are stored in a growing database of laboratory LILBID spectra (Klenner et al., in prep.), designed to aid in the interpretation of results from earlier missions, such as Cassini, as well as help planning future missions to icy ocean worlds in the Solar System, such as Europa Clipper [17].
References
[1] M. K. Dougherty et al. (2006) Identification of a Dynamic Atmosphere at Enceladus with the Cassini Magnetometer. Science 311:1406-1409.
[2] F. Spahn et al. (2006) Cassini dust measurements at Enceladus and implications for the origin of the E ring. Science 311:1416-8.
[3] L. Roth et al. (2014) Transient Water Vapor at Europa’s South Pole. Science 343:171-174.
[4] W. B. Sparks et al. (2016) Probing for evidence of plumes on Europa with HST/STIS. ApJ 829:121.
[5] R. Srama et al. (2004) The Cassini Cosmic Dust Analyzer. Space Sci Rev 114:465-518.
[6] S. Kempf et al. (2014) SUDA: A Dust Mass Spectrometer for Compositional Surface Mapping for a Mission to Europa. Eur Planet Sci Congr 9:EPSC2014-229.
[7] F. Postberg et al. (2011) A salt-water reservoir as the source of a compositionally stratified plume on Enceladus. Nature 474:620–622.
[8] F. Postberg et al. (2009) Sodium salts in E-ring ice grains from an ocean below the surface of Enceladus. Nature 459:1098–1101.
[9] F. Postberg (2018) Macromolecular organic compounds from the depths of Enceladus. Nature 558:564–568.
[10] N. Khawaja et al. (2019) Low-mass nitrogen-, oxygen-bearing, and aromatic compounds in Enceladean ice grains. Mon Not R Astron Soc 489:5231–5243.
[11] H.-W. Hsu et al. (2015) Ongoing hydrothermal activities within Enceladus. Nature 519:207–210.
[12] G. Choblet at al. (2017) Powering prolonged hydrothermal activity inside Enceladus. Nat Astron 1:841-847.
[13] F. Klenner et al. (2019) Analogue spectra for impact ionization mass spectra of water ice grains obtained at different impact speeds in space. Rapid Commun Mass Spectrom 33:1751–1760.
[14] F. Klenner et al. (2020a) Analog Experiments for the Identification of Trace Biosignatures in Ice Grains from Extraterrestrial Ocean Worlds. Astrobiology 20:179–189.
[15] F. Klenner et al. (2020b) Discriminating Abiotic and Biotic Fingerprints of Amino Acids and Fatty Acids in Ice Grains Relevant to Ocean Worlds, Astrobiology 20:1168-1184.
[16] T. Williams et al. (2009) Carbon and nitrogen substrate utilization in the marine bacterium Sphingopyxis alaskensis strain RB2256. ISME J 3:1036-1052.
[17] S.M. Howell and R.T. Pappalardo (2020) NASA’s Europa Clipper—a mission to a potentially habitable ocean world. Nat Commun 11:1311.
How to cite: Bönigk, J., Pavlista, M., Klenner, F., Napoleoni, M., Hillier, J. K., Khawaja, N., Dannemann, M., Klauck, E., Abel, B., Olsson-Francis, K., and Postberg, F.: Analogue experiments for the detection of bacterial biosignatures in ice grains relevant to ocean worlds, Europlanet Science Congress 2021, online, 13–24 Sep 2021, EPSC2021-277, https://doi.org/10.5194/epsc2021-277, 2021.
Abstract
Sputnik Planitia, a 1000 km wide, Pluto-dominating feature, is located very close to Pluto-Charon tidal axis. To explain its position, a reorientation driven by a postimpact uplift of a subsurface ocean was proposed. Since pure water ice shell relaxes too quickly to maintain the reorientation up to the present, an insulating layer of high viscosity clathrates at the ice/ocean interface was proposed. Here, we solve Pluto’s ice shell evolution in a 2D spherical axisymmetric geometry with an evolving free surface, assuming a viscous rheology of both ice and clathrates. Our results show that the thermal effect of the impact and nonlinear rheology substantially decrease the relaxation timescales.
Introduction
Sputnik Planitia basin is situated only 400 km from the tidal axis. Since a position this close to the tidal axis is very unlikely, reorientation of the whole body was proposed [1]. Facing towards the tidal axis, Sputnik Planitia should be a positive gravity anomaly [1]. Pluto is believed to be differentiated into a rocky core and a hydrosphere [2], therefore isostatic uplift of a liquid ocean might have compensated the basin’s negative topography. Impact origin ejecta blanket and accumulated nitrogen would then provide an additional positive mass [3]. Due to the basin’s likely age of 4 Gyr [4], the gravity anomaly has to be positive up to the present. Since the warm ice close to the melting point is expected to relax quickly, Kamata et al. [5] proposed the presence of an insulating layer of high viscosity clathrates. Here, we study the effect of impact heating [6] and nonlinear ice and clathrate rheology [7] on the relaxation timescale.
Numerical model
We solve the thermal evolution of Pluto’s ice shell in a 2D spherical axisymmetric geometry with time-evolving ice/ocean interface. The initial height of the isostatic uplift is evaluated assuming Airy isostasy, a 10 km deep basin at the surface and ocean water density of 1100 kg/m3 [8]. Free surface is prescribed at the bottom boundary and free slip is prescribed elsewhere. Temperature is fixed at the top and bottom boundary (40 and 265 K, respectively) and the side boundaries are kept adiabatic. The initial condition is steady-state conductive profile assuming clathrate layer of thickness 5 or 10 km. We use nonlinear viscosity of ice dependent on temperature, grain size and stress using the composite law [7], similarly for clathrates [9]. We prescribe temperature dependent thermal conductivity for ice [10] and a constant value (0.6 W/m/K) in the clathrate layer. We choose impactor velocity 4 km/s, diameter 400 km and density 920 kg/m3 in order to create a 900 km wide circular basin. The resulting temperature anomaly in the isobaric core is ∼ 80 K [6]. We use the Arbitrary Lagrangian-Eulerian formulation to address the moving boundary [11]. The problem is implemented in a freely available Finite Element Method library FEniCS [12].
Results
We performed series of simulations combining different shell thicknesses H and clathrate layer thicknesses hc. Here, we present two combinations, which, according to Kamata et al. [5], should lead to the uplift relaxation times in the order of billion years. Models 1 and 2 represent the H/hc = 100/5 km and 200/10 km simulations, respectively, with parameters used in [5]. Models 3 and 4 are analogical to Models 1 and 2, however, with nonlinear rheology and impact heating. Note that Kamata et al. [5] define relaxation timescale as the time when the uplift volume decreases to 1/e of the initial volume, whereas we present the time when the uplift starts to subside rapidly, i.e., when it no longer supports the surface basin isostatically, which is crucial for reorientation. This timescale turns out to be substantially shorter than the timescale presented in [5].
Figure 1 shows the relaxation curves, i.e., uplift height at the axis of symmetry with respect to time. We can see that Models 3 and 4 relax faster than Models 1 and 2. At 1 Gyr, the uplift of Model 4 already subsided by a few km and relaxation of Model 3 is almost over. These preliminary results suggest that none of them can compensate the negative basin topography anymore.
Figure 2 shows the moment when the uplift starts to subside rapidly for Models 3 and 4. Although the thin shell becomes quickly cold and rigid (Fig. 2a), its uplift starts to relax at t<1 Gyr. On the other hand, the thick shell, where the impact warmed the shell more effectively, becomes unstable already at t ~ 10 kyr (Fig. 2b). Note that the uplift region is still warm, unlike in the thin shell case.
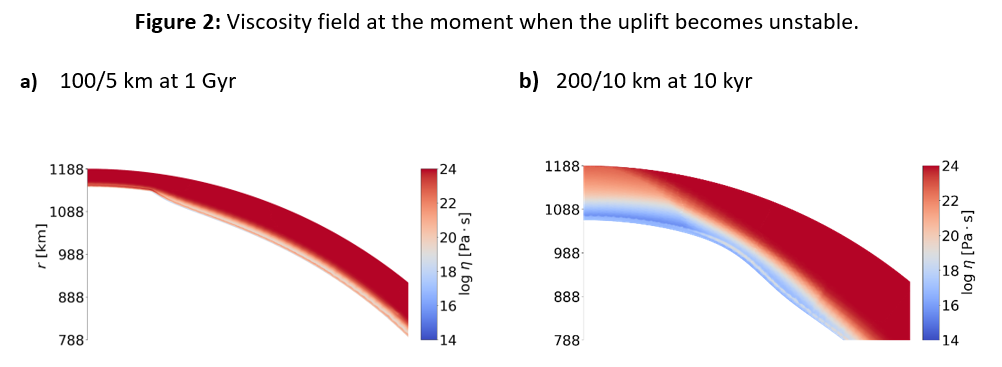
Conclusions
We investigated viscous relaxation of an uplift below Pluto’s basin Sputnik Planitia, assuming an insulating, high-viscosity layer of clathrates at the base of the shell. We showed that the impact temperature anomaly and nonlinear ice and clathrate rheology can substantially reduce the relaxation timescale. Moreover, accumulation of the insulating solid nitrogen layer can cause the shell to warm up, therefore the relaxation timescale may be even shorter.
Acknowledgements
This research was supported by the Czech Science Foundation through project No. 19-10809S. M.K. acknowledges the support from the Charles University projects SVV-2020-260581 and 111-10/251851. K.K. and O.S. were supported by the Charles University Research program No. UNCE/SCI/023.
References
[1] Nimmo et al., 2016. Nature. 540. 94–96.
[2] Stern et al., 2015, Science, 350, 1815.
[3] Keane et al., 2016. Nature, 540, 90–93.
[4] Greenstreet et al., 2015. Icarus, 258, 267–288.
[5] Kamata et al., 2019. Nature Geoscience, 12, 407–410.
[6] Monteux et al., 2014. Icarus, 237, 377–387.
[7] Goldsby and Kohlstedt, 2001. JGR: Solid Earth, 106, 11017–11030.
[8] Johnson et al., 2016. Geophys. Res. Lett., 43, 10068–10077.
[9] Durham et al., 2010. SSR. 153. 273–298.
[10] Hobbs, 1974. Ice Physics. Clarendon Press, Oxford.
[11] Scovazzi and Hughes, 2007. Sandia National Laboratories.
[12] Logg et al., 2012. The FEniCS Book, Springer–Verlag
How to cite: Kihoulou, M., Kalousová, K., Souček, O., and Čadek, O.: Viscous relaxation of Pluto’s clathrate-insulated ice shell below Sputnik Planitia, Europlanet Science Congress 2021, online, 13–24 Sep 2021, EPSC2021-180, https://doi.org/10.5194/epsc2021-180, 2021.
Triton is one of the few satellites in the Solar System which shows an ongoing geological activity, with plumes and geysers whose origin is still controversial [1]. Its surface is relatively young, as shown by the paucity of craters detected on its surface [2]. Our knowledge of this moon comes from the Voyager 2 mission, which obtained several images, covering about 40% of Triton’s surface [3]. However, few studies were focused principally on surficial geomorphology, and those are mostly limited to the cantaloupe region and surrounding areas. Triton’s crust is composed predominantly by solid nitrogen (N2) but several other ices have been detected [3]. Crater counting has revealed that the surface is very young and likely it went through a resurfacing process in the past. In fact, a very small number of craters has been detected, and these usually exhibit a typical bowl-like shape [2]. Geological features on Triton include regions, called terrains, such as cantaloupe terrains or plains, which show different textures. Usually, plains are categorized within smooth, walled and terraced plains [3]. The latter are the flattest areas on Triton, a characteristic which has been explained by evoking a lava-like or other viscous liquid infill. Their central depressions also present a cluster of irregular pits, which have been interpreted as drainage pits or eruptive vents [3]. These peculiar morphologies seem to indicate the presence of a viscous fluid on the surface in a remote epoch, which may imply potential climatic and atmospheric changes during Triton’s geological history. In this work we analyse an area located at NW of Tuonela Planitia, which shows several depressions rimmed by sharp margins. Two of these depressions are named Kulilu Cavus and Mah Cavus [4]. Cavi are elliptical-shaped depressions, distributed in an ordered trend, which constitute the cantaloupe terrain [3]. Diapirism is the main candidate process to explain these collapsed depressions [3] but other hypotheses, such as cryovolcanism or impact cratering [5], have also been proposed.
Methodology
A new geological map has been realized. We used Voyager 2 imagery named c1139533 [6] (600 m/px), properly calibrated, filtered and georeferenced using the Integrated Software for Imagers and Spectrometers (ISIS4) [7]. We mapped the different geological units and main features according to differences in surface morphology (fig.1). We also produced a DEM of the study area, using the open-source suite of tools NASA Ames Stereo Pipeline (ASP) [8]. We applied the photoclinometry-based “shape-from-shading” (SfS) tool to produce the DEM. Since SfS needs an input DEM generated preferably with stereo images, and we do not have such data for Triton, we used the methodology proposed by Lesage et al. 2021[9]. We analysed four different cross sections to measure the relative height of Kulilu Cavus, Mah Cavus and two other depressions, as well as their associated terraces (fig.2).
Discussion
Geological map in fig.1 comprises four units: terraced terrain (tt), smooth plain (sp), outer basin (ob), inner basin (ib). Terraced terrain covers most of the studied area. It shows a chaotic pattern characterized by a non-linear distribution of elevations (fig.3). Several terraces have been spotted, some of which lay in a parallel arrangement around some of the basins. In cross section plots (fig.3) we observed two different trends in the progressive elevation of terraces, as they approach the basins. Particularly, in sections A-A’ and C-C’ we identified a decrease in the terraces’ height towards the corresponding basin, instead in B-B’ and D-D’ we found an increase of height. In the E part of the study area, the terraced terrain ends abruptly with a sharp-edged scarp, passing to the smooth plain unit (sp). By analysing DEM topography, we observed that sp unit lays 250 m below tt unit. The latter surrounds Tuonela Planitia, one of the four main walled plains identified on Triton. The terraced terrain hosts several large basins, with areas ranging from 1300 to 2050 km2. The degree of alteration among these basins is variable, with the features inferred to be more recent showing an inner minor basin within the main basin. The most altered basins appear smoother, featureless and shallower. Cross sections plots (fig.3) show that the depths of these basins range from 300 to 500 m. Finally, we can argue a tectonic control of this area, represented in the NW part of the terraced terrains by several lineations included in a wider ridge (outside the study area), which is part of the global tectonic grid on Triton.
Conclusions
Sizes and excavation depths of the observed basin features appear to be relatively homogeneous, which leads us to exclude an impact related origin. Instead, we argue that the origin of these depressions is linked to processes analogue to those described, in the formation of terrestrial maar craters [10] and possible explosion craters discussed on Titan [11]. Alternatively, diapirism may also explain the origin of such features. Further analysis could help to understand the nature and related processes that originated these basins.
Acknowledgements
G.M., C.C., D.S., acknowledge support from the Italian Space Agency (2020-13-HH.0).
References: [1] Hansen C.J., and Kirk R. (2015), 46th LPSC, 2423.[2] Schenk P.M., and Zahnle K. (2007), Icarus, Vol.192(1), 135-149.[3] McKinnon B. M. and Kirk R.L. (2014), Chapter 40, Triton, Encyclopedia of the Solar System, Third edition, Elsevier,861-881.[4] USGS Astrogeology Science Center: Triton Pictorial Map of the Slidr Linea Quadrangle (Nt-2), 1992.[5] Martin-Herrero A. et al. (2014), 45th LPSC, 1177.[6] Smith, B. A., et al. (1989), Science, Vol.246 (4936), 1422-1449.[7] Houck J.C. and DeNicola L.A. (2000) Astronomical Data Analysis Software and Systems IX, ASP Conference Series, Vol. 216.[8] Beyer, R. A. et al. (2018), Science, 5.[9] Lesage E. et al. (2021), Icarus, 114373.[10] Lorenz, V. (2003), Geolines, Vol.15, 72-83.[11] Mitri G., et al. (2019), Nature Geoscience, Vol. 12, 791,796.
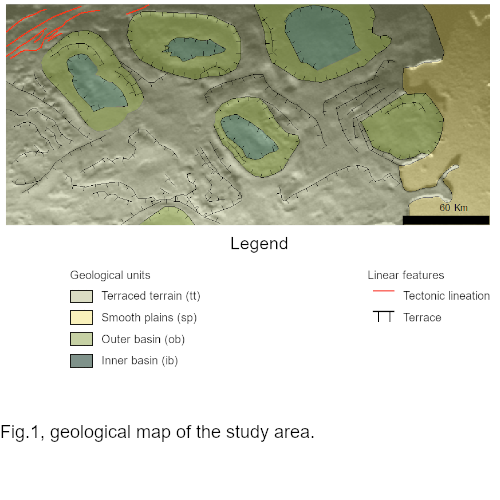
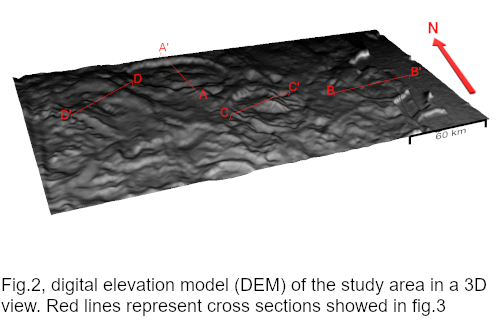
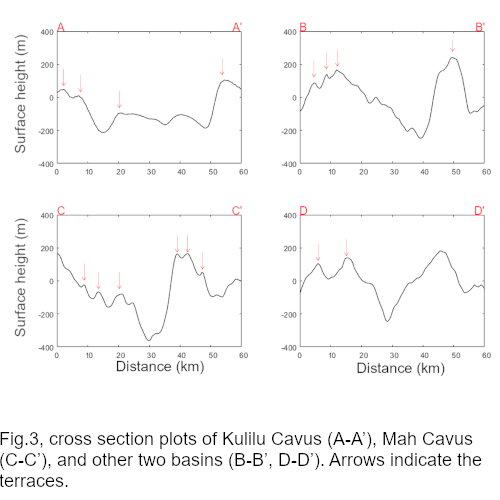
How to cite: Cioria, C., Sulcanese, D., Chiarolanza, G., and Mitri, G.: Geomorphological analysis with digital elevation model of Monad Regio, Triton, Europlanet Science Congress 2021, online, 13–24 Sep 2021, EPSC2021-135, https://doi.org/10.5194/epsc2021-135, 2021.
Introduction
Enceladus is a heavily cratered, ~500 km-size icy moon of Saturn [1], orbiting at ~4 Saturn radii from the planet. In 2005, the Cassini ISS-NAC camera [2] took high-resolution images of the moon’s surface [3], revealing an almost craterless, fracture-dominated and geologically active province surrounding the South Pole of Enceladus, called the South Polar Terrain (SPT, [4]). Inside the SPT cryovolcanic and tectonic activities are evident [4–6], with icy geysers emanating water vapor plumes from four fractures [3], called tiger stripes (hereafter named TS). The cause of such jets is related to normal tensile stresses that open vertical pathways inside the TS [7]. The fractures open and close from apocenter to pericenter [8], hence reaching the ocean that is located between 5 to 40 km underneath [9,10].
To study the TS rugged floors, three Enceladus close flybys have been performed by Cassini in 2008-2009. The returned m-scale images showed that the spacing of geysers is uniform along the three most active tiger stripes (Damascus, Bagdad and Cairo Sulci, [11]). Moreover, the ISS-NAC images revealed the presence of icy blocks located in the SPT (hereafter called blocks), situated in close proximity to the TS. Martens et al. [12] focused on the spatial density of such features, highlighting how impact cratering cannot be considered as the source of the SPT blocks, nor seismic disturbance or mass wasting. Instead, sublimation processes and ballistic emplacement through geysers eruption and/or tectonic disruption of lithospheric ice can be the source of the blocks.
The identification of the size-frequency distribution (SFD) of blocks and the corresponding curve fitting is a useful mean to provide hints on formative and/or degradation processes of such features, as showed on the Moon, Mars, asteroids and comets [13-16]. Therefore, we decided to expand the work of [12] analyzing the size-distance relation between the blocks and the fractured TS, and obtaining the SFD of the blocks in the TS area, hence suggesting their generation processes.
Dataset and Results
Through eight ISS-NAC images of the TS (with resolutions from 11.5 to 31.9 m, Fig. 1), we have identified 17070 blocks with sizes from ~30 to 366 m. The resulting histogram of all counts is presented in Fig. 2A. Afterwards, we identified the blocks SFD and its fitting curve to provide new insights into the formation and/or degradation processes characterizing these features. By using the Clauset et al. [17] methodology we derived that the TS blocks SFD can be fitted by a power-law curve, with a power-law of -5.4±0.4 (Fig. 2B).
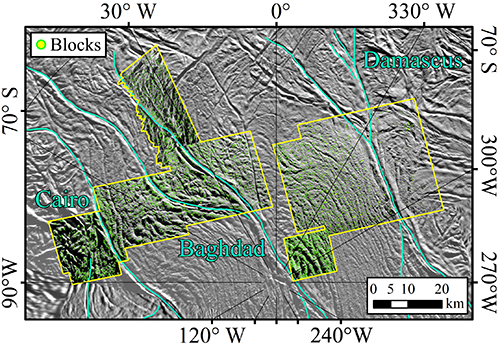
Figure 1. The blocks identified in the TS area.
To evaluate any possible differences in SFD per km2, we decided to split the full dataset of blocks into three main groups [18]: the Damascus, Baghdad and Cairo ones. The same methodology applied on the three TS returned a power-law index of -5.1±0.4 for the Damascus case, -5.1±0.3 for Baghdad TS, while a power-law index of -6.3±0.3 for the Cairo area. We explain these results considering that different processes concur in the formation and evolution of such blocks [18], in particular sublimation and cryovolcanic ejection mechanisms [12].
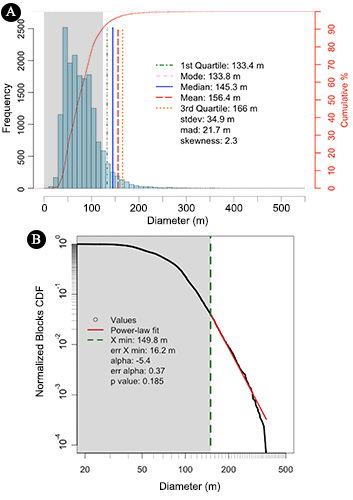
Figure 2. A) Frequency histogram of all blocks identified. B) Normalized CDF.
Discussion and Conclusion
To support our findings, we compared the TS SFDs with comet 67P, the only other case of an icy surface with boulders’ fields located on different morphological settings identified so far. In particular, the 67P Hathor cliff shows ubiquitous fracture pattern with several departing jets, and it presents a similar SFD (-5.2+0.5/-0.6, [19]) to the Damascus and Baghdad ones. The sublimation and fracturing processes explaining the Hathor SFD can be applied also to the TS SFD, suggesting that such mechanisms may favor similar fractures development in the icy matrix, resulting in comparable block disaggregation. For the Cairo case, the steeper power-law index may be indicative of a high degree of fragmentation that could be related to a locally higher degree of tectonic disruption of lithospheric ice, resulting in a larger presence of smaller size blocks. Since Cairo’s morphological setting shows no specific differences with respect to Damascus or Baghdad, this steeper power-law index requires further investigation.
We also investigated the block diameter versus TS distance trend to test if the cryovolcanic ejection mechanism suggested by [12] can be a possible block formation process. From our counts (Fig. 3), we identified that the smallest blocks are present from tens of m to maximum distances of 25 km from the TS fissures, while the largest blocks (100s m wide) are generally found at much closer range. This result positively supports the vent eruption hypothesis, which foresees that larger blocks usually land closer to the ejection point.
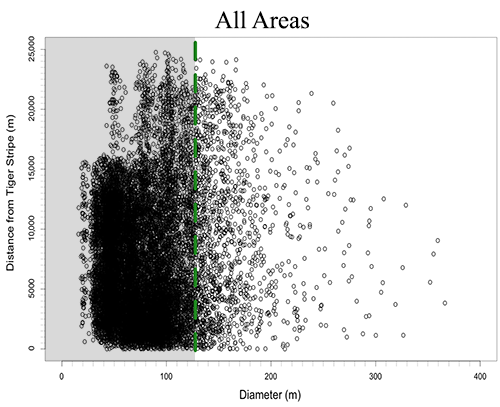
Figure 3: Diameter versus TS distance obtained for all counts.
In this context, future space missions dedicated to icy worlds will be fundamental. In particular, the images of the ESA/JUICE and NASA/EuropaClipper missions will allow to compare and expand the presented study also to the icy surfaces of Europa, Ganymede and Callisto.
Acknowledgments: This activity has been realized under the ASI-INAF contract 2018-25-HH.0.
References: [1] Smith, B.A., et al., 1981. Science 212, 163. [2] Porco, C.C., et al., 2004. SpaceSci.Rev. 115, 363. [3] Porco, C.C., et al., 2006. Science, 311, 1393. [4] Crow-Willard, E.N. & Pappalardo, R.T, 2015. JGRPlanets, 120, 928. [5] Yin, A., & Pappalardo, R. T. (2015). Icarus, 260, 409. [6] Rossi, C. et al., 2020. JGRPlanets, 125, e2020JE006471. [7] Porco, C.C, et al., 2014. Astron.J., 148:45. [8] Hedman, M.M., et al., 2013. Nature, 500, 182. [9] Iess, L., et al., 2014. Science 344, 78. [10] Lucchetti, A., et al., 2017. Icarus, 297, 252. [11] Helfenstein, P. & Porco, C.C., 2015. Astron.J., 150:93. [12] Martens, H. R., et al., 2015. Icarus, 245, 162. [13] Pajola, M., et al., 2019. Planet.SpaceSci. 165, 99. [14] Pajola, M., et al., 2017. Icarus 296, 73. [15] DellaGiustina, D.N., et al., 2019. Nat.Astron., 3(4), 341. [16] Pajola, M., et al., 2017. Nat.Astron. 1, 0092. [17] Clauset, A., et al., 2009. SIAMReview, 51(4), 661. [18] Pajola, M. et al., 2021. Universe, 7, 82. [19] Pajola et al., 2015. A&A 583, A37.
How to cite: Pajola, M., Lucchetti, A., Senter, L., and Cremonese, G.: Blocks Size Frequency Distribution in the Tiger Stripes area (Enceladus), Europlanet Science Congress 2021, online, 13–24 Sep 2021, EPSC2021-2, https://doi.org/10.5194/epsc2021-2, 2021.
The south polar region of Enceladus is a source of endogenic heat and plumes, as discovered using observations by Cassini instruments (e.g. Spencer et al. 2006). They comprise four long fissures or ‘Tiger Stripes’ which exude considerable thermal power; the total heat flow is likely between 4.2 GW (Spencer et al., 2018) and 15.8 ± 3.1 GW, Howett et al. (2011) and are shown in Figure 1. Identifying further endogenic heat sources on Enceladus would have implications for understanding the tidal heat budget and evolution of the surface geology. We use observations from Cassini’s Composite Infrared Spectrometer (CIRS) to survey the non-south polar regions of Enceladus in an attempt to both identify other low-level endogenic heat sources and to assess the limits of the observations for the detection of such sources. There are limitations to the observations, namely that detection is easier under conditions that correspond to lower signal to noise for the CIRS detectors. We use a thermal surface model to characterize expected surface temperatures – to determine what surface temperatures would be deemed anomalous. Uncertainties in albedo and thermal inertia which strongly impact the modeled temperature distribution, are themselves subject to a range of uncertainty. Model and observation uncertainty therefore contribute to a range of temperatures (a function of time of day and time of year) where measurement/model temperature differences are not deemed significant, and we propose the limits above which observations may be considered as plausible candidates for endogenic heat sources outside the south polar terrain. Using a perturbation study, we explore the bounds of model uncertainty that arise due to limited constraint of surface thermal properties. For illustration, Figure 2 shows a potential temperature range as modeled by a 1-D surface thermal model (thermprojrs (Spencer 1989, Howett et al., 2010)) for surface temperatures that can arise from the uncertainties just in albedo at this latitude. In this case model uses a constant value for thermal inertia of 18 J m-2 K-1 s-1/2, at a specimen latitude of 70°N, latitude 0°W. The impact is dependent upon time of year/insolation and at its peak it has a range of nearly 8 K during northern hemisphere summer. This would indicate that for comparison with CIRS observations at this latitude and time of year, only CIRS scene temperatures greater than this (and greater than the observed temperature error) could be considered as potentially significant.
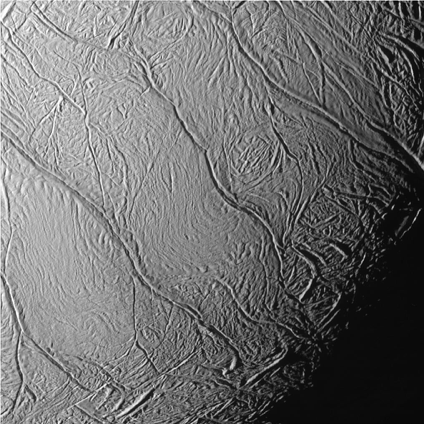
Figure 1: “Tiger Stripes” as imaged by Cassini, long fissures on Enceladus’ south polar terrain, that are significant sources of endogenic heat (50-80 K hotter than would otherwise be the case) as well as cryovolcanic plumes, predominantly composed of water ice. (image credit NASA/JPL/Space Science Institute - http://photojournal.jpl.nasa.gov/catalog/PIA06247)
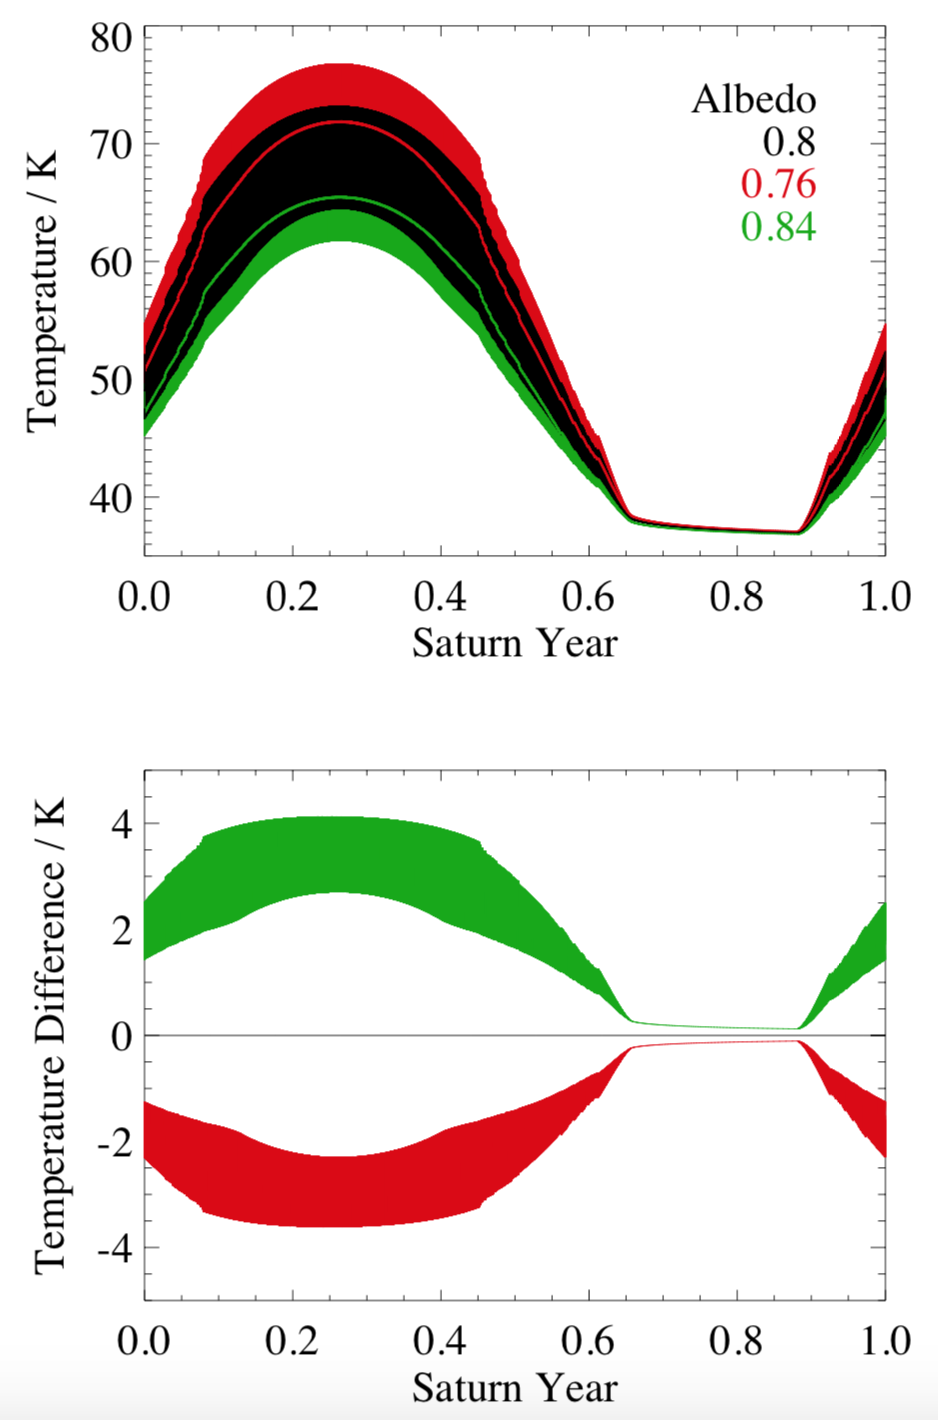
Figure 2: Top Panel – Enceladus seasonal temperatures at a latitude of 70°N/0°W for a range of albedos representing the current uncertainty in bolometric Bond albedo (derived by Howett et al. 2010)). Diurnal range is indicated by the spread of values with daily mean by thin line over-plotted. Bottom Panel – temperature difference from nominal (albedo 0.8). One Saturn year is approximately 29.46 Earth years.
References:
Howett, C.J.A., Spencer, J. R., Pearl, T., Segura, M.2010. Thermal inertia and bolometric Bond albedo values for Mimas, Enceladus, Tethys, Dione, Rhea and Iapetus as derived from Cassini/CIRS measurements. Icarus 206, 2, pp573-593. https://doi.org/10.1016/j.icarus.2009.07.016
Howett, C. J. A., J. R. Spencer, J. Pearl, and M. Segura (2011), High heat flow from Enceladus’ south polar regionmeasured using 10–600 cm−1 Cassini/CIRS data, J. Geophys. Res., 116, E03003, doi:10.1029/2010JE003718.
Spencer, J.R. F. Nimmo, A.P. Ingersoll, T.A. Hurford, E.S. Kite, A.R. Rhoden, J. Schmidt and C.J.A. Howett, Plume Origins and Plumbing: From Ocean to Surface, In Enceladus and the Icy Moons of Saturn, University of Arizona Press, Editors P.M. Schenk, R.N. Clark, C.J.A. Howett, A.J. Verbiscer and J.H. Waite, 2018.
How to cite: Miles, G. and Howett, C.: Hot Stuff: Looking for new endogenic heat sources on Enceladus, Europlanet Science Congress 2021, online, 13–24 Sep 2021, EPSC2021-366, https://doi.org/10.5194/epsc2021-366, 2021.
Introduction
Enceladus' interior structure comprises an icy outer shell, a global water ocean, and a rocky core, with the ice shell thinning significantly at the south pole, and to a lesser extent at the north pole, and with its greatest thickness around the equator. However, there is a large amount of debate over the thicknesses, compositions, and densities of each of these layers. Central to this uncertainty is an imbalance in its thermodynamic energy budget; the energy required to maintain the global ocean and south polar vents is significantly more than that generated by tidal heating assuming a consolidated core, and heating from radiogenic elements is expected to be limited. A porous, hydrothermally altered, and mechanically weaker core has been proposed to increase tidal heating in the core and help sustain the global ocean. This theory is supported by the chemical composition of ejecta from the south polar vents, which indicates water-rock interactions.
Seismic research on Enceladus will benefit from the satellite's innate seismic sources, with high levels of eruptive and seismic activity at the south pole, as well as creaking along existing faults in the ice shell and potential for waves in the subsurface ocean, all generating distinctive seismic signals. The recent increase in Earth-based cryoseismology research can provide useful analogues to assist in characterising these sources and predicting wave propagation through the ice. Enceladus' small size and anticipated axisymmetry both help to minimise the computational resources necessary to produce detailed seismic wavefield simulations. Its 252km radius leads to short propagation distances that should enable even low-amplitude signals to be detected anywhere on the moon, and produces low interior pressures that help reduce the problem of extrapolation of material properties commonly associated with Earth-based seismology.
Models
Initially, an array of existing structural models were collected and quantified in order to draw comparisons between these results. These models, developed by numerous different authors, take various approaches including isostasy, libration, thermodynamics, and compositional constraints, and produce a wide range of results that demonstrate the inability of existing data to constrain a single coherent interior model. Three of these models were then recreated for analysis using the TauP toolkit software [1]: that of Čadek et al. [2], model 5 of Vance et al. [3], and model A1 of Neumann and Kruse [4], which are compared in Figure 1. Seismic velocities estimated by Stähler et al. [5] were adopted for these models, using the higher, consolidated core velocity for the entire Čadek core, and the maximum ice thickness was assumed for the 1D Čadek model.
Ray theoretical results
Travel time predictions are shown in Figure 2. In general, the Vance model, with its thicker ice shell and hydrated upper core layer, enables a larger number of phases to travel further around the moon. Results for the Neumann model are fairly similar, though they show slightly less expansive wavefields. Meanwhile, the Čadek model's thinner ice shell terminates most phases by 90 degrees and reduces the difference in travel time between direct phases, such as the direct shear waves (S), and reflected phases, such as shear waves reflected once from the ice-ocean interface (ScS).
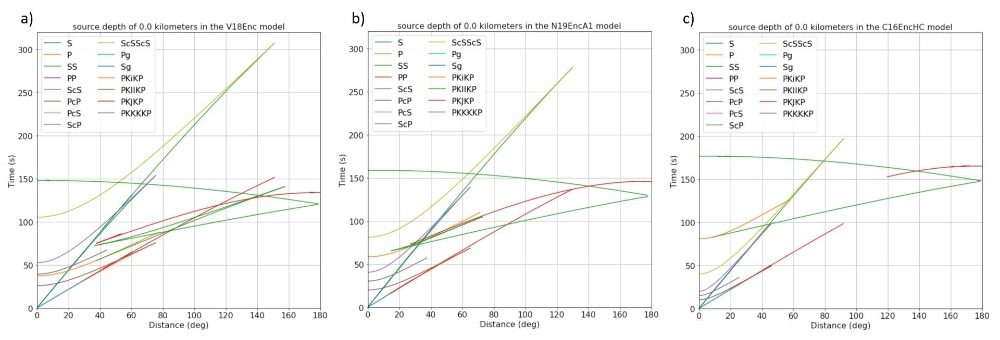
If detectable, PKJKP shear core phases, which appear at large distances in all three models, are likely to be useful in distinguishing between attenuation structures in the core to make inferences regarding its porosity. In addition, the thinner porous upper core layer in the Neumann model produces fewer core-underside reflected (PKIIKP) arrivals at any given distance than the thicker layer in the Vance model which, in contrast, produces an array of PKIIKP waves, some of which do not enter the deeper core and are instead reflected within the upper core. The boundary between the hydrated upper core and the consolidated deeper core has been specified to be sharp; however, a more gradational interface may suppress the number of these PKIIKP phases, and could be a useful diagnostic tool.
Ray theoretical travel time predictions alone cannot provide insight into how detectable, and therefore useful, each phase may be. In addition, the 1D models necessarily omit known complexities such as variations in ice shell thickness with latitude, as well as smaller length-scale heterogeneities suggested by surface features. However, this early stage of modelling has already demonstrated the effects that different hypothesised seismic structures may have on a seismic survey of Enceladus, and these discrepancies are likely to become more reliably diagnostic with a higher-dimension model.
Full wavefield simulations
Enceladus' main structural heterogeneities appear to vary primarily with latitude, for example in the thinning of the ice shell at the poles. In addition, the anticipated primary sources of seismic activity, in the form of fault reactivation and plume emissions, are located at the south pole. Beyond using ray theory, this research also employs the axisymmetric full waveform simulation code AxiSEM [6] to assess the seismic wavefields generated by quakes at the south pole of Enceladus. Initial investigations assess the detectability of different phases in the 1D models described above. Input parameters to AxiSEM can be modified to investigate the effect of variables such as attenuation properties and degree of core porosity or serpentinisation. The introduction of attenuation structures based on terrestrial measurements and expectations will improve the prediction of geographical variation in the detectability of key phases. Different types of source mechanisms can be explored in AxiSEM to describe the sources present on Enceladus. Comparison of the 2.5D wavefields generated by AxiSEM with the 1D TauP models will help to evaluate the impact of full wavefield modelling on our understanding of Enceladus.
References
[1] H. P. Crotwell, T. J. Owens, J. Ritsema, Seismological Research Letters 70, 154–160 (1999).
[2] O. Čadek et al., Geophysical Research Letters 43, 5653–5660 (2016).
[3] S. D. Vance et al., Journal of Geophysical Research: Planets 123, 180–205 (2018).
[4] W. Neumann, A. Kruse, The Astrophysical Journal 882, 47 (2019).
[5] S. C. Stähler et al., Journal of Geophysical Research: Planets 123, 206–232 (2018).
[6] T. Nissen-Meyer et al., Solid Earth 5, 425–445 (2014).
How to cite: Dapré, K. and Irving, J. C. E.: Seismic wavefield modelling of Enceladus to distinguish between interior structures, Europlanet Science Congress 2021, online, 13–24 Sep 2021, EPSC2021-680, https://doi.org/10.5194/epsc2021-680, 2021.
The Cassini-Huygens space mission investigated Saturn, its ring system and moons for 13 years, with outstanding results [1]. Cassini’s mass spectrometers — the Cosmic Dust Analyzer (CDA) [2] and the Ion & Neutral Mass Spectrometer (INMS) [3] — contributed to many breakthrough discoveries, confirming mass spectrometry to be a reliable analytical tool for investigating planetary bodies and their vicinities [4]. Compositional analysis of micron and sub-micron sized dusty grains was undertaken by the CDA, an impact ionization time of flight mass spectrometer. Particles striking the instrument’s metal target at speeds ≥ ~1 km/s were disrupted, vaporized and partially ionized. The generated cations were accelerated toward the instrument’s detector to produce mass spectra with resolutions of (m/∆m) ~20-50 [2]. With the limited mass resolution, CDA revealed subsurface hydrothermal activity [5] on Enceladus and discovered potential biologically-relevant complex [6] as well as volatile organic [7] in ice grains emerging from Enceladus subsurface ocean. A more recent, higher performance, spacecraft-borne impact ionization mass spectrometer — the SUrface Dust Analyzer (SUDA) [8] — will be a part of NASA’s Europa Clipper mission to explore the habitability of Jupiter’s moon Europa.
To calibrate these instruments, terrestrial analogue experiments are needed. In contrast to impact ionization, some soft ionization mass spectrometric techniques use a matrix to protect the structure of analyte molecules. These techniques include Matrix-Assisted Laser Desorption Ionization (MALDI) and Laser Induced Liquid Beam Ion Desorption (LILBID), which primarily use 2,5- or 2,3-dihydroxybenzoic acid (DHBA) [9], and water [10] as matrix substances, respectively. Although MALDI is by far the more common laboratory technique used for the analysis and the detection of biomolecules [11], LILBID is proven to accurately simulate impact ionization mass spectra of water ice grains [6][7][10]. In LILBID, a thin micrometer-scale liquid water beam, containing analyte compounds, is injected into a vacuum and irradiated by a pulsed infrared laser. Due to the laser’s energy, the solvent together with the analyte compounds are explosively dispersed, ionized and fragmented, generating a cloud of cations, anions, electrons, and neutrals [12][10]. The cations or anions (and electrons) can then be analyzed in a commercial time-of-flight mass spectrometer. A wide variety of compounds have been measured with the LILBID setup, to assist in the ongoing interpretation of CDA mass spectra, and predict those expected from SUDA in situ (cationic & anionic) mass spectra, thus inferring the composition of ice grains ejected from Enceladus’ or Europa’s oceans respectively. Laboratory campaigns, using the LILBID apparatus to generate mass spectra of a wide range of both inorganic and organic compounds, are ongoing. The data produced forms an expanding database, from which methodologies and rules for LILBID (and therefore impact ionization) mass spectral interpretation are being developed, in preparation for application to future missions [13].
Here, we present a comparison between the LILBID mass spectra of benzoic acid (C6H5COOH) and its derivative compounds: 2,5- & 2,3-DHBA (C7H6O4). In this work, we study with our LILBID setup the correlation between fragmentation behaviour of these aromatic acids and the position of hydroxy functional groups (at aromatic ring). These compounds share common structural features including one benzene ring and one carboxylic functional group. However, the dihydroxybenzoic acids have two hydroxyl groups attached at different carbon positions on the aromatic ring (2 and 5 or 2 and 3). We observe the same fragmentation pattern and features in the LILBID spectra of both DHBA compounds, indicating that the exact positions of the hydroxy functional groups have no impact on the mass spectral features. However, when comparing benzoic acid with its derivatives (2,5-DHBA & 2,3-DHBA), we find characteristic differences in their spectral signatures probably due to the attached hydroxy functional groups to the aromatic ring of these compounds. These data will be applied to the interpretation of CDA mass spectra of organic containing grains emitted from Enceladus, in which hitherto unidentified aromatic compounds have already been detected [6][7]. Understanding the behaviour of aromatic acids (e.g. benzoic acid) in comparison with its hydroxy derivatives (2,5-DHBA & 2,3-DHBA) under conditions which simulate impact ionization also relevant for the interpretation of unique results that will be produced by spaceborne mass spectrometers such as SUDA [8] onboard NASA’s future Europa Clipper mission.
References
[1] P. M. Schenk et al. (2018) Uni. of Arizona Press, Tucson, AZ
[2] R. Srama et al. (2004) Space Sci Rev. 114:465-518
[3] J. H. Waite et al. (2006) Science 311(5766) 1419-1422
[4] Jr. A. Ricardo, N. Ziqin & D. M. Ryan (2019) Journal of Mass Spectrometry Vol. 55
[5] Hsu et al. (2005) Nature 519.7542: 207-210
[6] Postberg et al. (2018) Nature 558:564–568
[7] Khawaja et al. (2019) Mon. Not. R. Astron. Soc. 489:5231–5243
[8] Kempf et al. (2014) EPSC2014-229, 2014
[9] W.E. Wallace, M.A. Arnould, R. Knochenmuss (2005) Int. Jour. Of Mass Spectrom. 242: 13-22
[10] Klenner et al. (2019) Rapid Commun Mass Spectrom. 33.22: 1751-1760
[11] L. Ling et al. (2018) J. Am. Soc. Mass Spectrom. 29:704-710
[12] F. Wiederschein et al. (2015) Royal Society of Chemistry 17, 6858
[13] Klenner et al. (2021; in preparation)
How to cite: Khawaja, N., Klenner, F., and Hillier, J.: Mass Spectral Analysis of Benzoic Acid and its Derivative Compounds using an Analogue Experiment for Space-based Impact Ionization Mass Spectrometers, Europlanet Science Congress 2021, online, 13–24 Sep 2021, EPSC2021-584, https://doi.org/10.5194/epsc2021-584, 2021.
The inferred subsurface oceans of the icy moons of Jupiter and Saturn, in particular Europa and Enceladus, may contain conditions suitable for life. Plumes of material have been detected from Enceladus and may also be present on Europa. These plumes could contain molecular signs of habitability that could be detected by mass spectrometers on orbiting spacecrafts, such as the upcoming Europa Clipper mission. However, these molecular markers may have degraded between their production and detection, for example by possible hydrothermalism in the subsurface ocean or by UV irradiation once carried into space by the plume. It is important to look at how the biosignatures degrade under different conditions as degradation processes need to be taken into account when analysing the data from life detection missions. We investigate how these two processes affect the mass spectral signals of terrestrial bacteria.
Two cyanobacteria samples, Spirulina and Chlorella, were subjected to hydrothermal processing and UV irradiation. Hydrous pyrolysis was used to simulate hydrothermal degradation. Experiments were carried out for 24 or 72 hours at temperatures between 200 and 300 °C. The pyrolyzed contents were subsequently extracted and analysed with gas chromatography-mass spectrometry (GC-MS). UV irradiation was carried out in a vacuum chamber (10-2 mbar), using a 300 W short arc xenon lamp at UV to near infrared wavelengths (~250 – 800 nm). After UV irradiation, samples were analysed using pyrolysis-gas chromatography-mass spectrometry (Py-GC-MS).
Our results show that hydrothermal processing of cyanobacteria affects the compound classes in different ways. Carbohydrate and protein components from the cyanobacteria were significantly affected, with phenol and indole derivatives detected. However, some of the biological fingerprint, such as straight-chain even numbered saturated fatty acids from lipid fragments, remain even at the harshest experimental conditions used in our study. This provides confidence that these diagnostic molecules could be used as fingerprints of biological materials on icy moons.
How to cite: Salter, T., Waite, H., and Sephton, M.: Degradation of bacteria mass spectral signals via hydrothermal processing and UV irradiation: relevance to life detection on icy moons, Europlanet Science Congress 2021, online, 13–24 Sep 2021, EPSC2021-518, https://doi.org/10.5194/epsc2021-518, 2021.
Please decide on your access
Please use the buttons below to download the presentation materials or to visit the external website where the presentation is linked. Regarding the external link, please note that Copernicus Meetings cannot accept any liability for the content and the website you will visit.
Forward to presentation link
You are going to open an external link to the presentation as indicated by the authors. Copernicus Meetings cannot accept any liability for the content and the website you will visit.
We are sorry, but presentations are only available for users who registered for the conference. Thank you.
Please decide on your access
Please use the buttons below to download the presentation materials or to visit the external website where the presentation is linked. Regarding the external link, please note that Copernicus Meetings cannot accept any liability for the content and the website you will visit.
Forward to session asset
You are going to open an external link to the asset as indicated by the session. Copernicus Meetings cannot accept any liability for the content and the website you will visit.
We are sorry, but presentations are only available for users who registered for the conference. Thank you.

