
Spectral identification of faculae on Mercury by unsupervised classification of MASCS/MESSENGER data
 ,,,
,,,- INAF-IAPS, Rome, Italy
Introduction
The explosive volcanism on Mercury [1,2,3,4] usually manifests with endogenic pits (vents) surrounded by bright deposits with a red spectral slope (faculae) [5,6]. The largest numbers of vents are on the floors, rims, central peaks or peak rings of impact structures, on faults, or within 20 km of a fault [7] and their presence suggests the explosive release of volatiles [8].
The Mercury’s pyroclastic deposits have been searched with Mercury Dual Imaging System (MDIS) data acquired during the first years of MESSENGER mission [9,10,6,11,12]. The sites of explosive volcanism have been identified by searching for faculae and then noting the occurrence of vents [9,10,6,11], obtaining a catalogue of 137 candidate deposits (some of them of uncertain volcanic nature) [11]. Alternatively, MDIS images were first analyzed looking for pits and then for faculae [12]; this approach generated a catalogue of 174 candidate pits sites, of which 150 surrounded by faculae [12]. Analyses on the entire dataset of MESSENGER extended the catalogue to more than 200 vents [13,14].
In this work we are aiming to detect pyroclastic deposits by using unsupervised classification of the data acquired by Mercury Atmospheric and Surface Composition Spectrometer (MASCS) during the orbit phases of MESSENGER.
Methods
We analyzed MASCS photometrically-corrected spectral data acquired by the two channels of the Visible (300-1050 nm) and InfraRed (850-1450 nm) Spectrograph (VIRS). The two channels were merged at 989 nm and a Savitsky-Golay filter was applied on the spectra to reduce unwanted high-frequency artifacts present in the signal.
The spectral parameters used for the investigation focused on the VIS range and were: the spectral slope in the 300-400 nm range (UV slope); the spectral slope in the 500-800 nm range (VIS slope); the crossing point between the two slopes (knee); the reflectance value at 550 nm (R550). The slopes and the knee were estimated on normalized spectra at 550 nm to reduce remaining photometrical residuals.
The other important part of the work has been to appropriately select the spectra used for the classification. We thus limited the classified dataset to only those observations having optimal observing conditions: incidence and emission angles lower than 65°, footprint length lower than 25km and with a ratio of the footprint length over footprint width lower than 10. Furthermore, having studied the impact of the detector temperature on the SNR ratio we took into account only observations with VIS detector temperature lower than 25 °C.
To identify pyroclastic deposits we used 6 previously catalogued faculae as training fields. We mapped the values of R550 and spectral slopes in an area of 20°x20° around Rachmaninoff crater: in the analysis we included Suge Facula in the south-eastern part of crater, in addition to Neidr and Nathair Faculae, that are in the north of the area. Similarly, we mapped the spectral parameters in a region comprising the faculae in the floors of Catullus, Praxiteles and Lermontov craters (10-30°N; 40-80°W). As a result, the 6 faculae can be distinguished from the surrounding terrain for values of R550 included between 4% and 8% and with VIS slope values included between 1.7 and 2.0 1/µm.
Results and discussion
We applied the values of R550 and VIS slope detected by the analysis of the faculae used as training fields on the selected MASCS data and we obtained a map of locations spectrally similar to pyroclastic deposits, i.e. bright and with a red spectral slope. 37 locations correspond to pyroclastic deposits present in the published catalogues [6,9,10,11], 5 areas are coincident with uncertain deposits in [11], one is a red pitted ground in [12] and another area is a pit with no visible spectral anomaly in MDIS data [12]. In addition to the 44 previously identified locations, the unsupervised classification revealed more than 60 new areas spectrally similar to the faculae used as training fields.
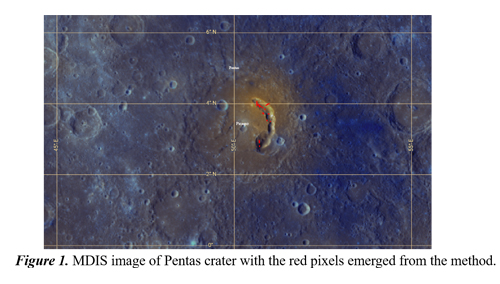
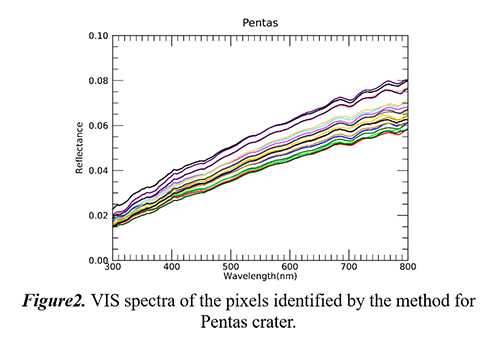
In Figure 1, the Pentas crater is shown, with the classified MASCS pixels marked in red and coincident with the vents associated to the facula catalogued in [10]. The VIRS spectra associated to the pixels (Figure 2) are flat and featureless.
From a preliminary spectral analysis of some of the classified areas (19 catalogued faculae and 3 newly identified locations), we found a correlation between the R550 and the UV slope, whereas the knee and the VIS slope are anti-correlated. Taking into account all locations revealed by the unsupervised classification, the histogram of the UV slope (Figure 3, left image) assumes a bimodal trend, possibly suggesting some compositional differences in the underlying terrains: one with a low UV slope, probably connected to Low-Reflectance Blue Plain (LBP) and the other terrain with a higher UV slope, likely the High-Reflectance Red Plains (HRP). The histogram of the knee (Figure 3, right image) presents a main peak at 460 nm and a minor peak at 500 nm: recurrently, the spectra of the same area belong to both groups, suggesting a spectral variation within the same location.

Not all the deposits previously catalogued [6,9,10,11,12,13,14] did emerge by this unsupervised classification one reason being the lack of coverage. However, we shall improve the work enlarging the number of training fields to take into account the full range of the observed spectral variability of the faculae.
Acknowledgments
We gratefully acknowledge funding from the Italian Space Agency (ASI) under ASI-INAF agreement 2017-47-H.0.
References
[1] Robinson,M.S. and Lucey, P.G., 1997, Science 275. [2] Strom, R.G. et al. , 1975, JGR 80. [3] Solomon S.C. et al., 2007, SSR 131. [4] Solomon S.C. et al., 2011, PSS 59. [5] Head. J.W. et al., 2008, Science 321. [6] Goudge, T.A. et al., 2014, JGR, Planets 119. [7] Klimczack, K.T. et al., 2018, Icarus 315. [8] Kerber, L. et al., 2009, EPSL. 285. [9] Blewett, D.T. et al., 2011, Science 333. [10] Kerber, L. et al., 2011, PSS 59. [11] Kerber, L. et al., 2014, 47th LPSC. [12] Thomas, T.J. et al., 2014, JGR Planets 119. [13] Jozwiak, L.M. et al., 2018, Icarus 302. [14] Pegg, D.L. et al., 2020, 2nd BPSC.
How to cite: Galiano, A., Capaccioni, F., Filacchione, G., and Carli, C.: Spectral identification of faculae on Mercury by unsupervised classification of MASCS/MESSENGER data, Europlanet Science Congress 2021, online, 13–24 Sep 2021, EPSC2021-252, https://doi.org/10.5194/epsc2021-252, 2021.