TP14
Session assets
Please decide on your access
Please use the buttons below to download the presentation materials or to visit the external website where the presentation is linked. Regarding the external link, please note that Copernicus Meetings cannot accept any liability for the content and the website you will visit.
Forward to presentation link
You are going to open an external link to the presentation as indicated by the authors. Copernicus Meetings cannot accept any liability for the content and the website you will visit.
We are sorry, but presentations are only available for users who registered for the conference. Thank you.
Oral and Poster presentations and abstracts
Abstract
The entire dataset of 1-minute proton spectra provided by MESSENGER’s Fast Imaging Plasma Spectrometer (FIPS [1]) are each numerically fitted with a κ distribution function in order to provide estimates of proton density, n, and temperature, T , in the vicinity of Mercury’s magnetosphere. A collection of artificial neural networks (ANNs) are trained to assess the quality of the newly fitted distribution functions, with a final classification accuracy of 96%. Of the 223,282 spectra, ∼160,000 were classified as having “good” fitting κ distributions, ∼133,000 of which were measurements obtained from within the magnetosphere, and ∼18,000 were from the magnetosheath. The “good” magnetospheric densities and temperatures were subsequently used to create a 3D ANN-based model of the Hermean magnetosphere.
1. Introduction
Mass loading is an important factor in controlling the timescales over which processes such as wave propagation and reconnection can occur within a magnetized plasma. The speed at which magnetohydrodynamic (MHD) waves propagate is characterized by the local Alfvén velocity, vA , where vA= , B is themagnetic field magnitude, ρ is the plasma mass density and μ0 is the permeability of free space. Fundamentally, the higher the local plasma mass density is–the slower waves propagate. Similarly, the beta of a plasma (β) depends on the density and temperature where β=
and kB is the Boltzmann constant.
Magnetic reconnection between two adjacent magnetized plasmas is affected by the difference in plasma beta (∆β) between the two fluids, where a larger ∆β suppresses reconnection and thus a larger shear angle is required for reconnection to occur [2, 3]; conversely, low ∆β makes reconnection more favorable with small shear angles [3, 4].
The Fast Imaging Plasma Spectrometer (FIPS [1]) on board the MErcury Surface, Space ENvironment, GEochemistry and Ranging (MESSENGER [5]) spacecraft operated at Mercury for approximately 4 years (from March 2011 to April 2015) during the orbital phase of the mission. During this time, it sampled the ions from both within and outside of the Hermean magnetosphere, providing at least 1.25 million proton spectra every 10 or 60 s, depending upon the instrument mode. Many of those were burst-mode spectra and were combined in groups of 6 to form 1-minute average spectra, resulting in ∼220,000 60 s proton spectra.
In the work presented here, the entire dataset of 1-minute FIPS spectra are each numerically fitted with κ distribution functions, providing improved estimates of proton density and temperature over previous Maxwellian fits. The quality of the distribution function fits are assessed using artificial neural networks, resulting in a reduced dataset of more reliable plasma moments. Finally, new average and scalable 3D models of magnetospheric protons are presented using the new moments.
2. Fitting the Spectra
The κ-distribution function, fκ [6],
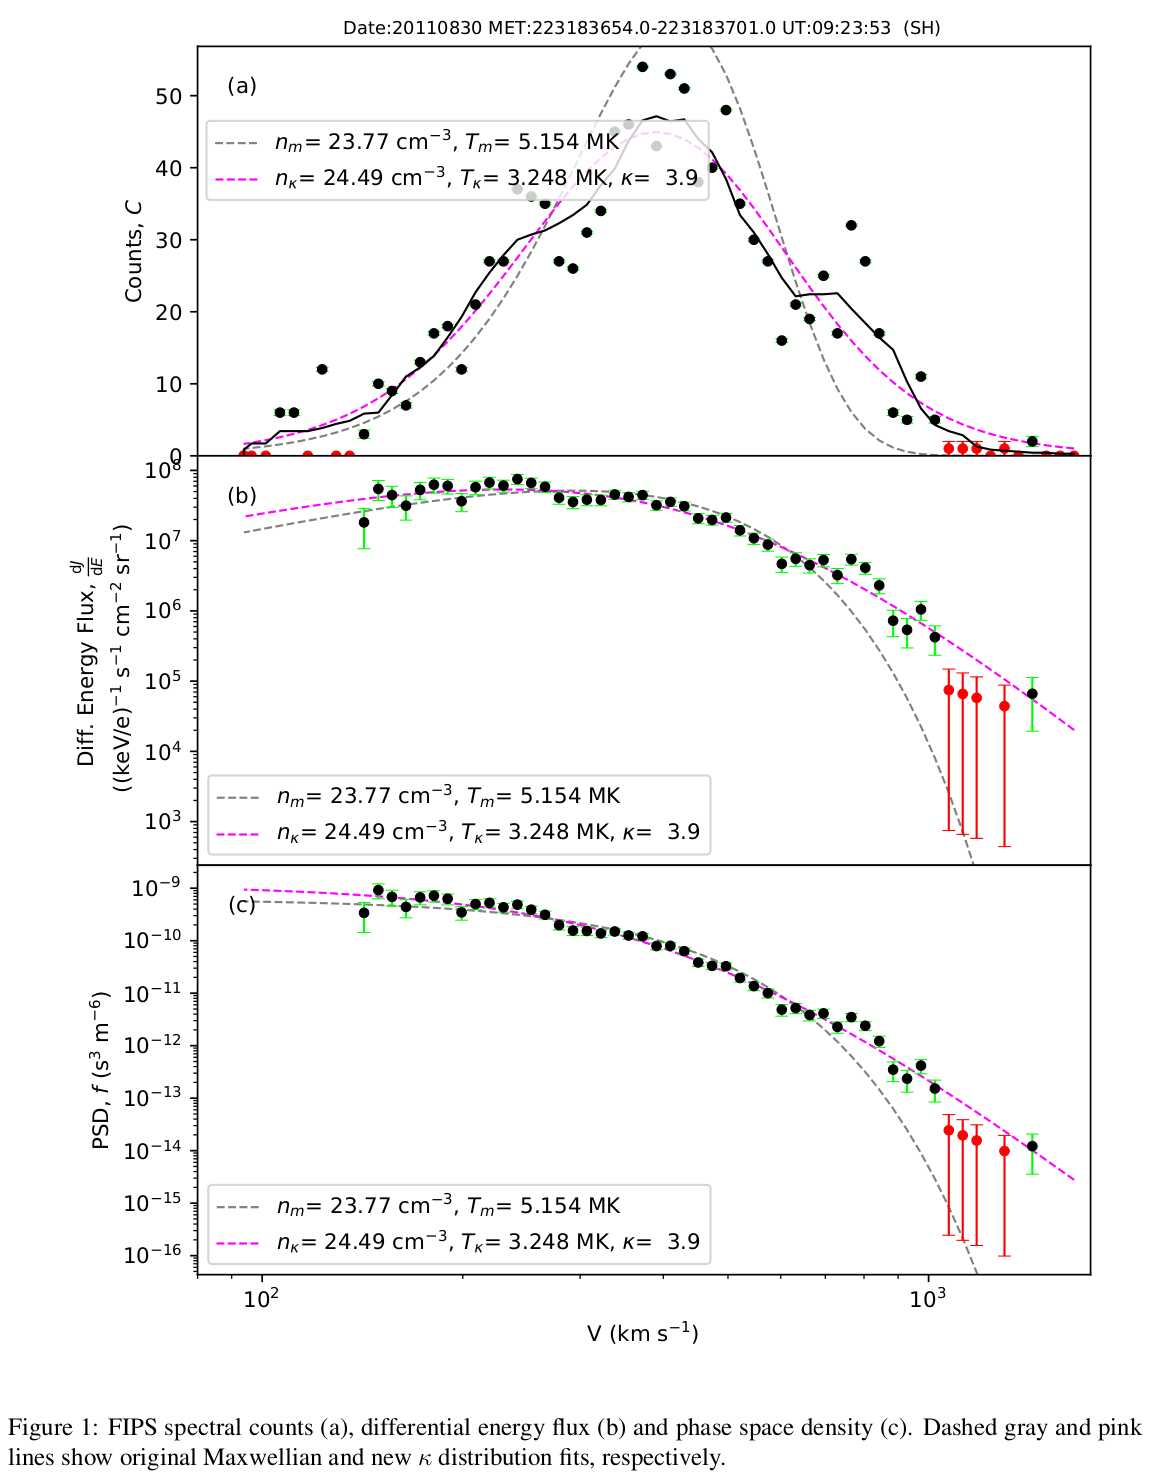
where Γ(x) is the Gamma function, was fitted numerically to the FIPS spectra using the downhill-simplex method [7]. This distribution function can be used to describe both plasmas in thermal equilibrium (i.e. Maxwellian, κ → ∞) and suprathermal plasmas (κ < 10).
Figure 1 shows an example of the κ distribution fit (pink) to a FIPS spectrum, compared to a Maxwellian fit (gray). The κ function fits well at all velocities in the FIPS spectrum, while the Maxwellian deviates significantly at higher energies.
3. Assessing Quality of Spectral Fit
Determining whether the κ distribution fit is a simple task to perform by eye, but would be a time consuming task to do for all 223,282 spectra, with potentially inconsistent results. One option would be to use a simple measure of goodness of fit (e.g. χ2 ), but this does not work very well with these data - so classification neural networks were used instead.
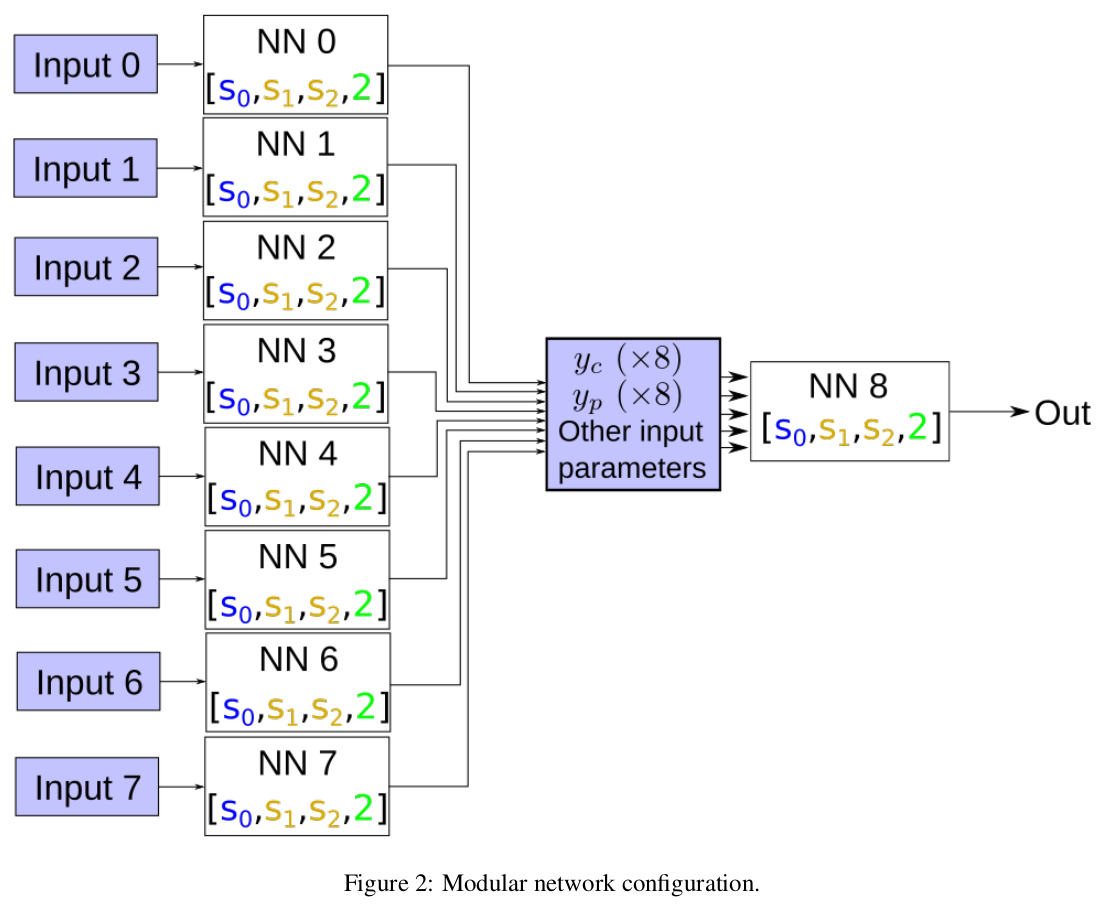
Initially, spectra were split into 8 equal parts, each of which was analyzed by one of 8 neural networks (see figure 2) – providing a probability that each section had a “good” distribution function fit. The 8 probabilities formed part of the input to the final ANN, along with other parameters such as ∆f (difference between the spectral fit and the data), which produced an overall probability that the spectral fit was reliable.
4. 3D Proton Model
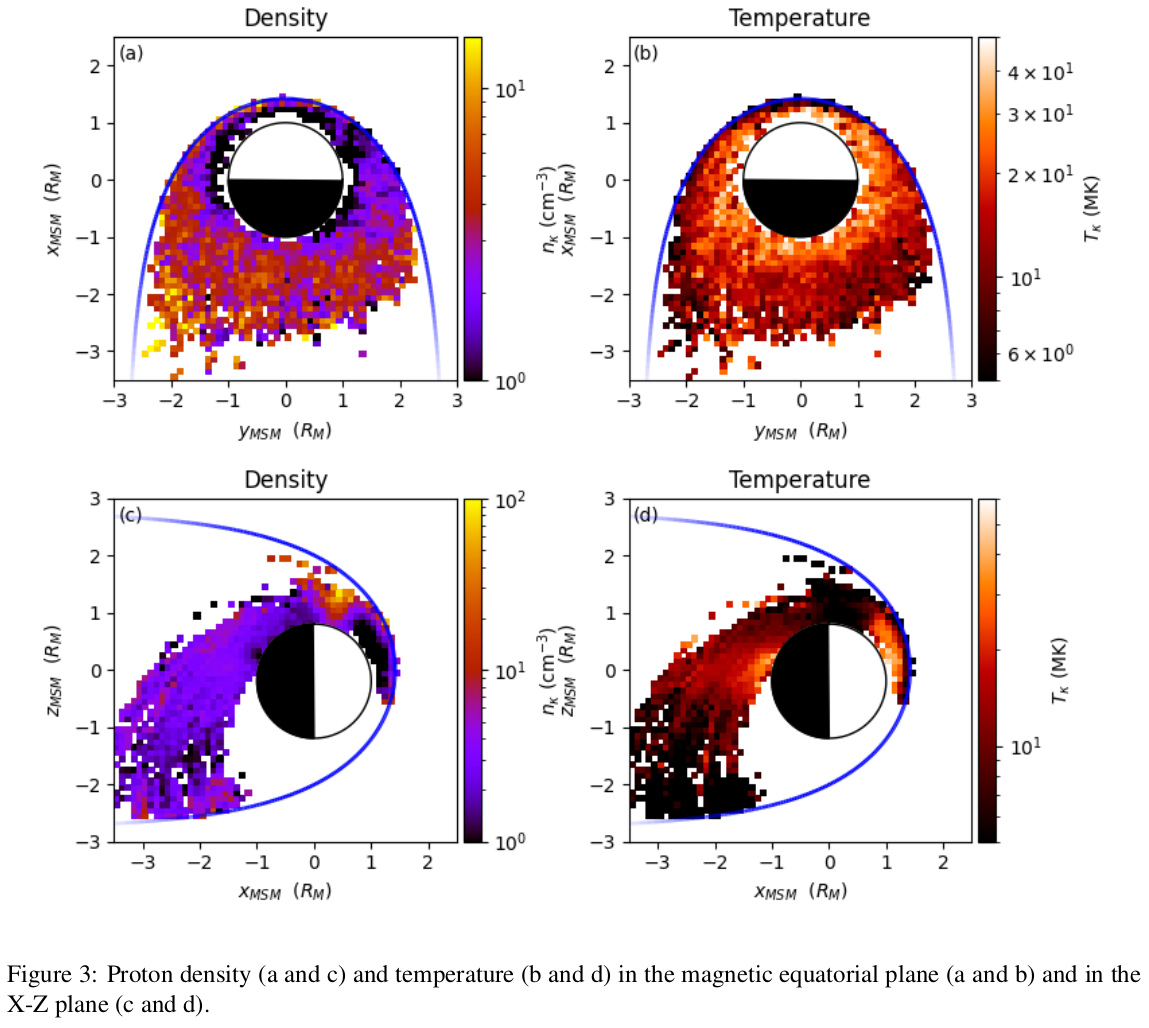
Figure 3 shows an overview of the new magnetospheric proton densities and temperatures in the equatorial plane and in the X-Z plane. The proton density appears to be lowest in the closed regions of the magnetosphere, and highest in the cusp, whereas the temperatures exhibit the inverse of this trend.
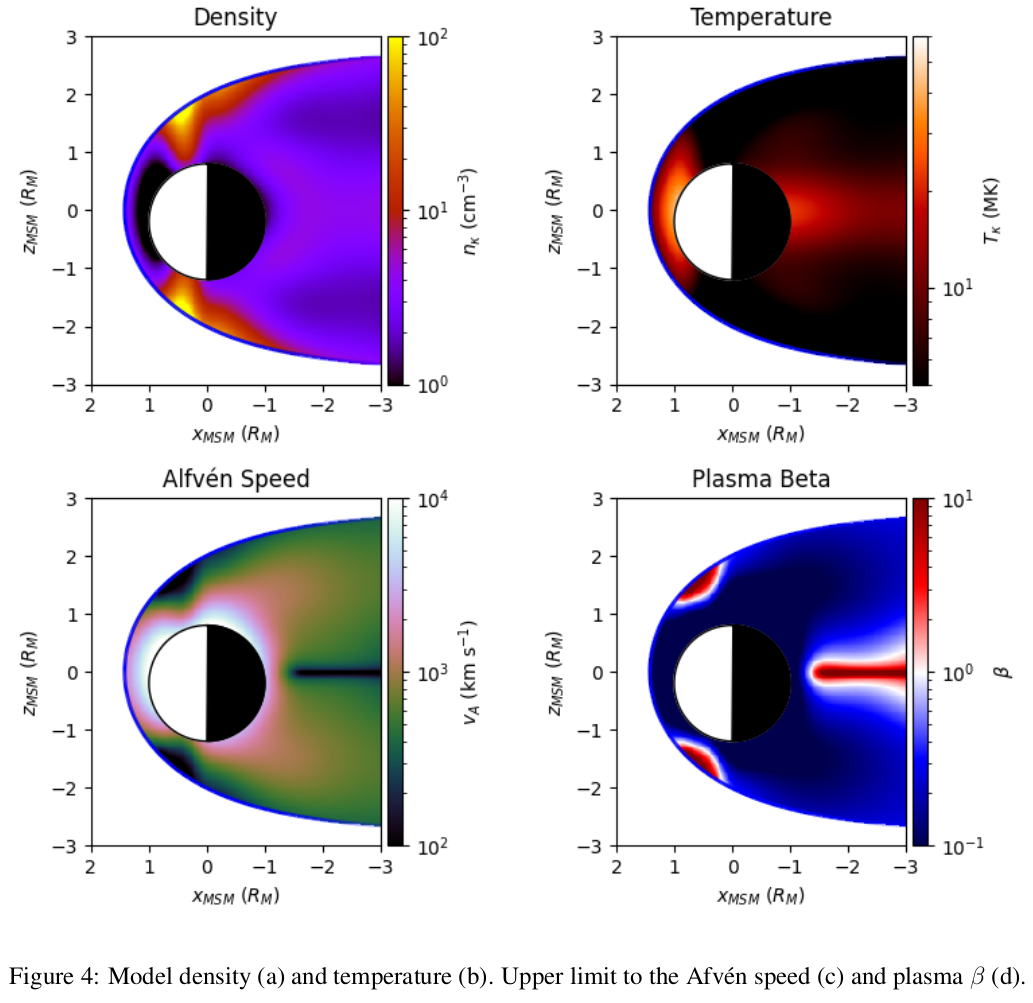
Using the new density and temperature measurements as training data, and assuming that there is some hemispherical symmetry, a new 3D model was created using an ANN (see figure 4 a and b). The model was trained simply to map a Cartesian position vector as an input to density and temperature. The model may also be combined with the KT17 magnetic field model [8] to provide estimates of the upper limit to the Alfvén speed (figure 4c) and the proton contribution to plasma β (figure 4d). A scalable model was also produced, where the magnetopause standoff distance was used as an extra ANN input.
Acknowledgements
The work by M.K.J., T.K.Y., S.M.I and E.J.B is supported by STFC grant ST/H002480/1.
MESSENGER project is supported by contracts NASW-00002 and NAS5-97271.
References
[1] Andrews, et al. (2007), The Energetic Particle and Plasma Spectrometer Instrument on the MESSENGER Spacecraft, Space Sci. Rev., 131(1-4), 523–556, doi:10.1007/s11214-007-9272-5.
[2] Swisdak et al. (2010), The vector direction of the interstellar magnetic field outside the heliosphere, The Astrophysical Journal, 710(2), 1769–1775, doi:10.1088/0004-637x/710/2/1769.
[3] Phanet al. (2016), Messenger observations of cusp plasma filaments at mercury, Journal of Geophysical Research: Space Physics, 121(9), 8260–8285, doi:10.1002/2016JA022552.
[5] Solomon et al. (2007), Messenger mission overview, Space Sci. Rev., 131(1), 3–39, doi:10.1007/s11214-007-9247-6.
[6] Pierrard and Lazar (2010), Kappa Distributions: Theory and Applications in Space Plasmas, Solar Physics, 267(1), 153–174, doi:10.1007/s11207-010-9640-2.
[7] Nelder and Mead (1965), A Simplex Method for Function Minimization, Comput. J., 7(4), 308–313, doi:10.1093/comjnl/7.4.308.
[8] Korth et al. (2017), A Dynamic Model of Mercury’s Magnetospheric Magnetic Field, Geophys. Res. Lett., 44(20), 10,147–10,154, doi:10.1002/2017GL074699.
How to cite: James, M., Yeoman, T., Imber, S., Raines, J., and Dewey, R.: A machine learning approach to classifying MESSENGER FIPS proton spectra, Europlanet Science Congress 2021, online, 13–24 Sep 2021, EPSC2021-611, https://doi.org/10.5194/epsc2021-611, 2021.
Density inhomogeneities are ubiquitous in space and astrophysical plasmas, in particular at contact boundaries between different media. They often correspond to regions that exhibits strong dynamics on a wide range of spatial and temporal scales. Indeed, density inhomogeneities are a source of free energy that can drive various plasma instabilities such as, for instance, the lower-hybrid-drift instability which in turn transfers energy to the particles through wave-particle interactions and eventually heats the plasma. Here, we address the role of this instability in the Hermean plasma environment were kinetic processes of this fashion are expected to be crucial in the plasma dynamics and have so far eluded the measurements of past missions (Mariner-X and MESSENGER) to Mercury.
The goal of our work is to quantify the efficiency of the lower-hybrid-drift instability to accelerate and/or heat electrons parallel to the ambient magnetic field.
To reach this goal, we combine two complementary methods: full-kinetic and quasilinear models.
We report self-consistent evidence of electron acceleration driven by the development of the lower-hybrid-drift instability using 3D-3V full-kinetic numerical simulations. The efficiency of the observed acceleration cannot be explained by standard quasilinear theory. For this reason, we develop an extended quasilinear model able to quantitatively predict the interaction between lower-hybrid fluctuations and electrons on long time scales, now in agreement with full-kinetic simulations results. Finally, we apply this new, extended quasilinear model to a specific inhomogeneous space plasma boundary: the magnetopause of Mercury, and we discuss our quantitative predictions of electron acceleration in support to future BepiColombo observations.
How to cite: Lavorenti, F., Henri, P., Califano, F., Aizawa, S., and Andre, N.: Electron acceleration by the lower-hybrid-drift instability at Mercury: an extended quasilinear model, Europlanet Science Congress 2021, online, 13–24 Sep 2021, EPSC2021-10, https://doi.org/10.5194/epsc2021-10, 2021.
Mercury’s magnetosphere is a unique and dynamic system, primarily due to the proximity of the planet to the Sun and its small size. Interactions between solar wind and embedded Interplanetary Magnetic Field (IMF) and the dayside Hermean magnetosphere drive an electric current on the system’s magnetopause boundary. So far, electromagnetic induction due to magnetopause motion in response to changing external pressure has been used to constrain Mercury’s iron core size. Here we assess the impact a changing IMF direction has on the Hermean magnetopause currents, and the resulting inducing magnetic field. Observations made by MESSENGER during subsolar magnetopause boundary crossings in the first ‘hot season’, are used to demonstrate the importance of the IMF direction to Mercury’s magnetopause currents. Our 16 boundary crossings show that introduction of external IMFs change the magnetopause current direction by 10° to 100°, compared to the case where only the internal planetary field is considered. Analytical modelling was used to fill in the bigger picture and suggests for an east-west reversal of the IMF, typical of the heliospheric current sheet sweeping over Mercury’s magnetosphere, the inducing field at Mercury’s surface caused by the resulting magnetopause current dynamics is on the order of 10% of the global planetary field. These results suggest that IMF variability alone has an appreciable effect on Mercury’s magnetopause current and generates a significant inducing magnetic field around the planet. The arrival of the BepiColombo mission will allow this response to be further explored as a method of probing Mercury’s interior.
How to cite: Zomerdijk-Russell, S., Masters, A., and Heyner, D.: Variability of the interplanetary magnetic field as a driver of electromagnetic induction in Mercury’s interior, Europlanet Science Congress 2021, online, 13–24 Sep 2021, EPSC2021-103, https://doi.org/10.5194/epsc2021-103, 2021.
In the last months of its mission, MESSENGER was able to obtain measurements at low altitude (< 120 km). This has made it possible to measure small magnetic field signals, probably of crustal origin (Johnson et al, 2015). Maps of the crust signatures at 40 km altitude were produced by Hood (2016) and Hood et al. (2018), showing that the strongest anomalies are about 9 nT in the Caloris basin. Some of the anomalies are associated with impact craters, and it has been demonstrated that this is not a coincidence (Hood et al., 2018). It is believed that these anomalies are the result of impactor materials rich in magnetic carriers (e.g., metallic iron) that were incorporated on the surface acquiring remanent magnetic fields during the cooling of the material. We analyzed whether the anomalies of the crustal field are related to geological characteristics by examining two Hermean craters in order to test this impactor hypothesis. Anomalies associated with Rustaveli and Stieglitz craters are slightly or totally asymmetric with respect to the crater center. The morphology and geological setting of these two fresh impact craters that still maintain a well-preserved ejecta blanket and visible secondary crater chains are investigated to constrain the overall impact dynamics. In both cases, slight asymmetries in the morphology and ejecta distribution show that the magnetic anomalies correlate well with the location of impact melt. Rustaveli is associated with a ~5 nT crustal magnetic anomaly centered close to the crater’s midpoint, although offset ~20 km east-southeast. This offset is somewhat consistent with the downrange direction implied by Rustaveli’s impact melt and crater chains distribution. For Stieglitz, an anomaly larger than 3 nT includes most of the ejecta melt locations towards southwest. The ejecta melt cluster to the north of the crater corresponds to an anomaly of ~5 nT, while the largest anomaly of ~7 nT is found further north and closely corresponds to the crater’s deepest chain. For both craters, the melt likely recorded the prevailing magnetic field of Mercury after quenching. Hence, both impactors brought magnetic carriers to the surface that could record the past magnetic field of Mercury. Acknowledgments: The authors gratefully acknowledge funding from the Italian Space Agency (ASI) under ASI-INAF agreement 2017-47-H.0 and the European Union’s Horizon 2020 research and innovation programme under grant agreement No. 776276.
Hood, J. Geophys. Res. Planets 121, 2016;
Hood et al., J. Geophys. Res. Planets 123, 2018;
Johnson et al., Science 348, 2015.
How to cite: Galluzzi, V., Oliveira, J. S., Wright, J., Rothery, D. A., and Hood, L. L.: Young craters of Mercury correlating with offset magnetic anomalies, Europlanet Science Congress 2021, online, 13–24 Sep 2021, EPSC2021-699, https://doi.org/10.5194/epsc2021-699, 2021.
Introduction: The MESSENGER spacecraft has returned a wealth of data from Mercury that offers infinite research opportunities. The objective of our modest science team, the Mercury Surface Spectroscopy (MeSS) group, is to enable and maximise the science exploitation of the visible to near-infrared spectrometer (MASCS) onboard the MESSENGER mission to unravel Mercury’s surface.
The MeSS project is currently collecting research investigations of Mercury’s surface through data mining, knowing that the output of this work is of paramount importance for the preparation of BepiColombo’s exploration of Mercury.
Scientific topics for Mercury’s surface: In preparation for the next Decadal Survey, the Mercury science community defined in 2019 a list of high priority science at Mercury. The MeSS approach is supporting many of those high priority questions, and in particular those related to surface analysis. Are geological processes (e.g. formation of hollows and scarps) actively taking place today? How and why has volcanism changed so dramatically through time? To what degree have secondary processes affected the surface composition and mineralogy of Mercury? With the use of the MeSS, scientific users can explore those science questions with the MASCS observations.
The MeSS infrastructure: The MeSS database is a PostgreSQL relational database. This MeSS database contains the entire set of observations acquired by MASCS (i.e. >4.000.000 footprints) with all the relevant metadata to evaluate the MASCS data. Additionally, the MeSS database provide access to a product that combine the UV-visible and near channels of the spectrometer following the approach described in [1]. A view of the various parameters available in the MeSS database is presented in Fig 1. A python interface is available to provide query access to the database and explore the products of interest based on various criteria. Spectral parameters defined in [2] are also added as a table in the MeSS database. With the various information provided in the MeSS database, users can explore a combination of parameters of interest to explore the properties of Mercury’s surface.

Fig 1: Illustration of the various parameters and their relationships in the MeSS
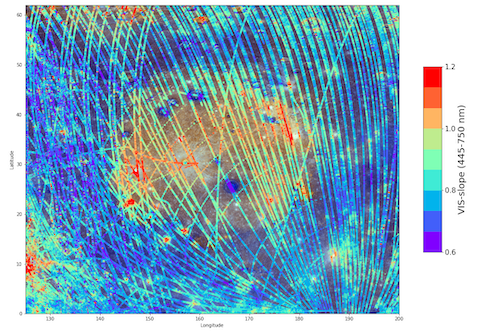
Fig 2: Output of a query in the MeSS Database for the footprints with an incidence angle <75∞, a detector temperature <40∞, the visible slope as calculated in [3], and around the Caloris basin.
Results: After few years of development, and despite a slow down due to the pandemic, the MeSS database has been used to explore Mercury’s surface, and provide scientific results. [2,4,5] made use of the MeSS database to explore the mineralogical and physical properties of volcanic landforms. Our results have in particular highlighted the size of explosive volcanism and the asymmetry of some specific deposits. Hollows are small depressions on the surface potentially created by degassing of the sub-surface, and our latest analysis using spectroscopic data favour scarp-retreat as one of the mechanisms explaining the growth of hollows [3].
New collaborations are underway to investigate more scientific topics through the MeSS (space weathering, impact features, spectral properties of magnetic anomalies, etc.).
Future and collaborations: The content of the MeSS Database is rapidly evolving:
- New parameters are and can be added. In particular, the MeSS team is currently adding the spectral curvature calculated in [3].
- New datasets are always of interest to provide context to point spectrometers. The MeSS team is exploring the addition of MDIS and MLA data.
- Access to the MeSS database could be requested to the team. Currently, the infrastructure is not ready for a full public access, but the content is open for collaborators that want to explore Mercury.
Acknowledgments: The authors are very grateful to the SITU IT support team at the European Space Astronomy Centre (ESAC) for providing the required infrastructure.
References:
[1] Besse, S. et al. (2015), JGR, Spectral properties of explosive volcanism within the Caloris basin with MESSENGER observations.
https://doi.org/10.1002/2015JE004819
[2] Besse, S. et al. (2020), JGR, Spectral properties and physical extent of pyroclastic deposits on Mercury: Variability within selected deposits and implications for explosive volcanism.
https://doi.org/10.1029/2018JE005879
[3] Barraud, O. et al. (2020), JGR, Near-Ultraviolet to Near-Infrared spectral properties of hollows on Mercury: Implications for origin and formation process.
https://doi.org/10.1029/2020JE006497
[4] Rothery, D. et al. (2021), Icarus, On the asymmetry of Nathair Facula, Mercury.
https://doi.org/10.1016/j.icarus.2020.114180
[5] Barraud, O. et al. (2021), Icarus, Spectral investigation of Mercury’s pits surroundings: Constraints on the planet’s explosive activity.
Submitted
How to cite: Besse, S., Munoz, C., and Cornet, T.: Revealing Mercury’s surface properties through data mining of the MESSENGER datasets with MeSS, Europlanet Science Congress 2021, online, 13–24 Sep 2021, EPSC2021-102, https://doi.org/10.5194/epsc2021-102, 2021.
Introduction: Kuiper quadrangle (H06) is located at the equatorial zone of Mercury and encompasses the area between longitudes 288°E – 360°E and latitudes 22.5°N – 22.5°S. A detailed geological map (1:3M scale) for this quadrangle based on the MESSENGER/MDIS derived maps, was produced [1] and an integrated geo-stratigraphic map is being prepared [2], [3].
The geological map showed that the quadrangle is characterized by a prevalence of crater materials, which were distinguished into three classes based on their degradation degree [4]. The different crater’s density permits to discriminate different plain units. Several bright regions are evidenced within H06, and in particular, different craters highlight both the presence of hollows and pyroclastic material [e.g., 5]. Some craters display very bright ejecta and Kuiper crater shows extended bright rays.
Data and Method: Multi-spectral maps of Kuiper quadrangle were produced using MDIS (Mercury Dual Imaging System) WAC data. Since H06 is located at low latitudes, the data coverage with high spatial resolution is lower than the northern quadrangles [e.g. 6-7]. This suggested to approach the analysis in multiple-stage passages. This has been done to investigate the H06 region with the best detail from a spectral point of view but also to compare the outcomes of the analysis performed at different resolution scales where it was possible. We produced an homogeneous 8 color global mosaic at 1600 m/px scale (average scale taking into account the average resolution within the quadrangle) and one at 665 m/pixel pushing the resolution, but excluding from the coverage the southern areas. Moreover, we used partial quadrangle coverage at 385 m/px and 246 m/px to exploit the presence of higher resolution color images.
Preliminary results: We will show spectral variations considering specific indices and color combinations, discussing the possibility to define spectral units among these bright regions, which could be integrated with the morpho-stratigraphic mapping. Locally, we will investigate the spectral variability for specific surface features, such as bright regions, fresh craters, hollows, pyroclastic deposits.
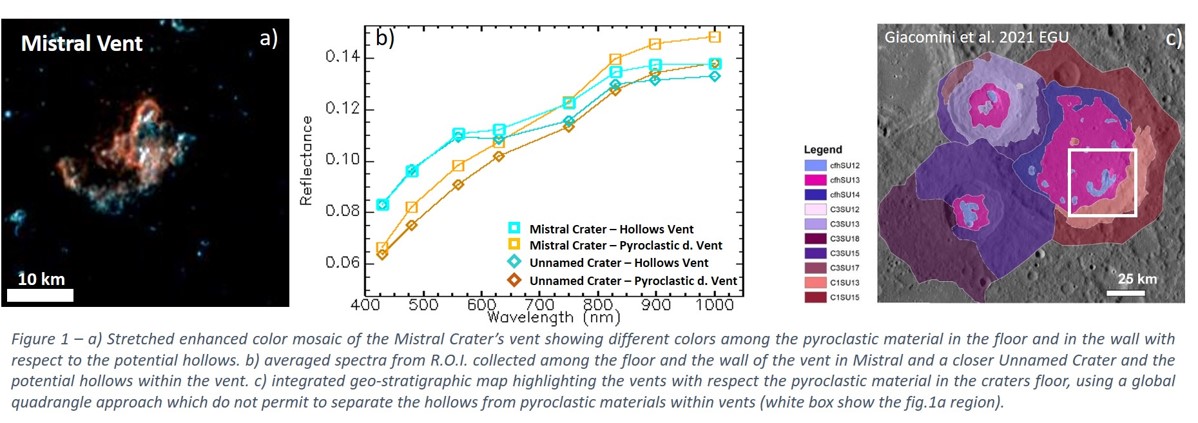
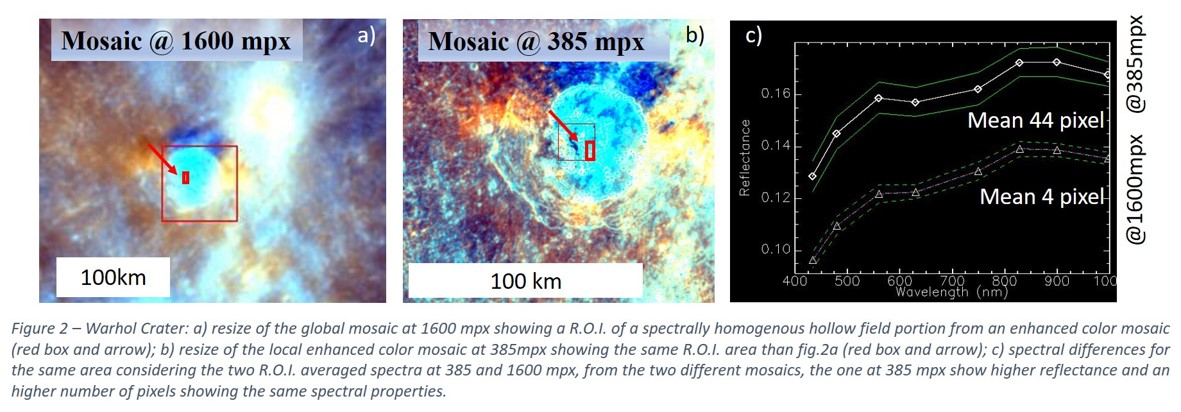
This analysis allows us to infer some indications on material composition and discriminate among the bright features, which seems to have an higher spectral variability (e.g. reflectance and slope variation) and an evidence of a possible absorption around 650 nm (e.g. Fig.1), already evidence in the literature [e.g. 8]. The definition of this compositional information permits also to produce a more detailed geological map of those regions in H06 showing correlations between morpho-stratigraphic and spectral units [2]. We also studied the variability with the spatial scale of spectral properties of different regions to investigate to the variation of this data varying the resolution on the surface. In Fig.2, for example, we show how the details change in the hollows field in the Warhol crater with the spectral differences from the same area for the two cases. Moreover the hollows spectral properties are characterizing an higher number of pixels where the spatial resolution is better. We will show some examples of such integrated maps.
Conclusions: In particular, at this preliminary stage, we can show that:
- Bright regions have, in general, a reflectance variation ranging from 0.1 to 0.12 at 750 nm, but they show different spectral slopes and a larger reflectance variation towards the UV;
- In general hollows and some small bright spot are bluer than pyroclastic materials and rays; furthermore, wherever hollows can be clearly identified by morphology they tend to show an indication of an absorption around 650 nm and an inflation towards IR;
- When a higher spectral resolution can be used for the same R.O.I., we clearly see higher definition of spectral variability and higher number of pixel showing diagnostic features (e.g. hollow spectra).
This preliminary analysis highlights that both higher spectral and spatial resolutions are needed in order to obtain new information about the landforms’ origin. In light of these evidences, it appears that the high resolution of the instruments of BepiColombo mission, like SIMBIO-SYS, can significantly contribute to answer several questions raised during the geological mapping and analysis of the Kuiper quadrangle.
Acknowledgments: We gratefully acknowledge funding from the Italian Space Agency (ASI) under ASI-INAF agreement 2017-47-H.0. MM, CC, FZ, FA were also supported by European Union’s Horizon 2020 research grant agreement No 776276- PLANMAP. MM, CC, FA, GL, VG were also supported by Europlanet RI20-24 research grant agreement No. 871149-GMAP.
References: [1] Giacomini et al., 2018. EPSC abstract 721-1. [2] Giacomini et al., 2021. LPSC abstract, 15052. [3] Carli et al., 2020. EPSC abstract, 367. [4] Galluzzi et al., 2016. J. Maps, 12, 226–238. [5] Pajola et al., 2020. PSS, 195, . [6] Bott et al. 2019. JGR, 124, 2326-2346. [7] Zambon et al. 2019. EGU, 7796. [8] Lucchetti et al. 2018. JGR, 123, 2365–2379.
How to cite: Carli, C., Giacomini, L., Zambon, F., Galluzzi, V., Ferrari, S., Massironi, M., Altieri, F., Ferranti, L., Palumbo, P., and Capaccioni, F.: Spectral variability of brigth regions whitin Kuiper quadrangle: spectral indication for integrated geostratigraphic maps, Europlanet Science Congress 2021, online, 13–24 Sep 2021, EPSC2021-238, https://doi.org/10.5194/epsc2021-238, 2021.
Introduction
The explosive volcanism on Mercury [1,2,3,4] usually manifests with endogenic pits (vents) surrounded by bright deposits with a red spectral slope (faculae) [5,6]. The largest numbers of vents are on the floors, rims, central peaks or peak rings of impact structures, on faults, or within 20 km of a fault [7] and their presence suggests the explosive release of volatiles [8].
The Mercury’s pyroclastic deposits have been searched with Mercury Dual Imaging System (MDIS) data acquired during the first years of MESSENGER mission [9,10,6,11,12]. The sites of explosive volcanism have been identified by searching for faculae and then noting the occurrence of vents [9,10,6,11], obtaining a catalogue of 137 candidate deposits (some of them of uncertain volcanic nature) [11]. Alternatively, MDIS images were first analyzed looking for pits and then for faculae [12]; this approach generated a catalogue of 174 candidate pits sites, of which 150 surrounded by faculae [12]. Analyses on the entire dataset of MESSENGER extended the catalogue to more than 200 vents [13,14].
In this work we are aiming to detect pyroclastic deposits by using unsupervised classification of the data acquired by Mercury Atmospheric and Surface Composition Spectrometer (MASCS) during the orbit phases of MESSENGER.
Methods
We analyzed MASCS photometrically-corrected spectral data acquired by the two channels of the Visible (300-1050 nm) and InfraRed (850-1450 nm) Spectrograph (VIRS). The two channels were merged at 989 nm and a Savitsky-Golay filter was applied on the spectra to reduce unwanted high-frequency artifacts present in the signal.
The spectral parameters used for the investigation focused on the VIS range and were: the spectral slope in the 300-400 nm range (UV slope); the spectral slope in the 500-800 nm range (VIS slope); the crossing point between the two slopes (knee); the reflectance value at 550 nm (R550). The slopes and the knee were estimated on normalized spectra at 550 nm to reduce remaining photometrical residuals.
The other important part of the work has been to appropriately select the spectra used for the classification. We thus limited the classified dataset to only those observations having optimal observing conditions: incidence and emission angles lower than 65°, footprint length lower than 25km and with a ratio of the footprint length over footprint width lower than 10. Furthermore, having studied the impact of the detector temperature on the SNR ratio we took into account only observations with VIS detector temperature lower than 25 °C.
To identify pyroclastic deposits we used 6 previously catalogued faculae as training fields. We mapped the values of R550 and spectral slopes in an area of 20°x20° around Rachmaninoff crater: in the analysis we included Suge Facula in the south-eastern part of crater, in addition to Neidr and Nathair Faculae, that are in the north of the area. Similarly, we mapped the spectral parameters in a region comprising the faculae in the floors of Catullus, Praxiteles and Lermontov craters (10-30°N; 40-80°W). As a result, the 6 faculae can be distinguished from the surrounding terrain for values of R550 included between 4% and 8% and with VIS slope values included between 1.7 and 2.0 1/µm.
Results and discussion
We applied the values of R550 and VIS slope detected by the analysis of the faculae used as training fields on the selected MASCS data and we obtained a map of locations spectrally similar to pyroclastic deposits, i.e. bright and with a red spectral slope. 37 locations correspond to pyroclastic deposits present in the published catalogues [6,9,10,11], 5 areas are coincident with uncertain deposits in [11], one is a red pitted ground in [12] and another area is a pit with no visible spectral anomaly in MDIS data [12]. In addition to the 44 previously identified locations, the unsupervised classification revealed more than 60 new areas spectrally similar to the faculae used as training fields.
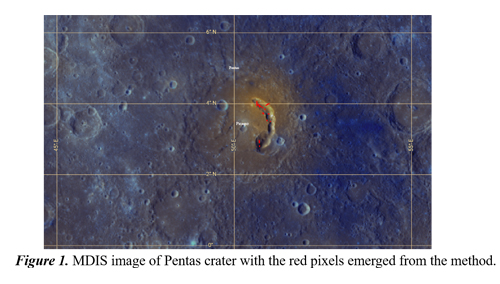
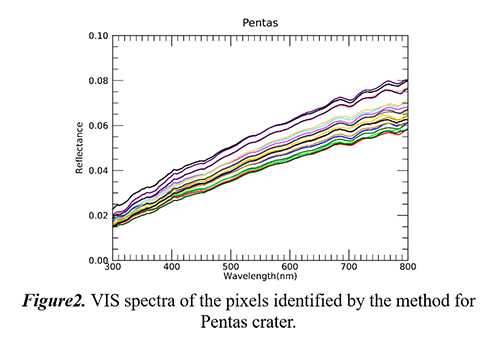
In Figure 1, the Pentas crater is shown, with the classified MASCS pixels marked in red and coincident with the vents associated to the facula catalogued in [10]. The VIRS spectra associated to the pixels (Figure 2) are flat and featureless.
From a preliminary spectral analysis of some of the classified areas (19 catalogued faculae and 3 newly identified locations), we found a correlation between the R550 and the UV slope, whereas the knee and the VIS slope are anti-correlated. Taking into account all locations revealed by the unsupervised classification, the histogram of the UV slope (Figure 3, left image) assumes a bimodal trend, possibly suggesting some compositional differences in the underlying terrains: one with a low UV slope, probably connected to Low-Reflectance Blue Plain (LBP) and the other terrain with a higher UV slope, likely the High-Reflectance Red Plains (HRP). The histogram of the knee (Figure 3, right image) presents a main peak at 460 nm and a minor peak at 500 nm: recurrently, the spectra of the same area belong to both groups, suggesting a spectral variation within the same location.
Not all the deposits previously catalogued [6,9,10,11,12,13,14] did emerge by this unsupervised classification one reason being the lack of coverage. However, we shall improve the work enlarging the number of training fields to take into account the full range of the observed spectral variability of the faculae.
Acknowledgments
We gratefully acknowledge funding from the Italian Space Agency (ASI) under ASI-INAF agreement 2017-47-H.0.
References
[1] Robinson,M.S. and Lucey, P.G., 1997, Science 275. [2] Strom, R.G. et al. , 1975, JGR 80. [3] Solomon S.C. et al., 2007, SSR 131. [4] Solomon S.C. et al., 2011, PSS 59. [5] Head. J.W. et al., 2008, Science 321. [6] Goudge, T.A. et al., 2014, JGR, Planets 119. [7] Klimczack, K.T. et al., 2018, Icarus 315. [8] Kerber, L. et al., 2009, EPSL. 285. [9] Blewett, D.T. et al., 2011, Science 333. [10] Kerber, L. et al., 2011, PSS 59. [11] Kerber, L. et al., 2014, 47th LPSC. [12] Thomas, T.J. et al., 2014, JGR Planets 119. [13] Jozwiak, L.M. et al., 2018, Icarus 302. [14] Pegg, D.L. et al., 2020, 2nd BPSC.
How to cite: Galiano, A., Capaccioni, F., Filacchione, G., and Carli, C.: Spectral identification of faculae on Mercury by unsupervised classification of MASCS/MESSENGER data, Europlanet Science Congress 2021, online, 13–24 Sep 2021, EPSC2021-252, https://doi.org/10.5194/epsc2021-252, 2021.
Introduction: The origin and formation of Hollows, puzzling surface features identified on MESSENGER (MErcury Surface, Space ENvironment, GEochemistry, and Ranging, [1]) images [2], represent one of the major open science questions about Mercury surface processes and landforms. Hollows are 10 m to several km-sized shallow, irregular, flat‐floored depressions characterized by bright interiors and haloes and found on crater walls, rims, floors, and central peaks [2,3]. Although a well-established framework explaining their nature and formation is still lacking, current hypotheses envision the release of volatiles from the surface of Mercury [1] through processes like sublimation, desorption, sputtering, micrometeorite impacts and pyroclastic volcanism. In this abstract, we analyze multi-angular Mercury Dual Imaging System (MDIS,[7]) wide angle camera (WAC) color images of hollows-hosting Canova (25.62°N, 3.75°W) and Tyagaraja craters (3.89 °N, 138.9°W), with the aim of investigating the spectrophotometric properties of these features.
Methodology: We collected multiple MDIS/WAC images covering the hollows at Canova and Tjagaraya crater in 8 out of 11 filters ranging from 433 nm to 996 nm. Each image was processed with the ISIS software through the spiceinit and mdiscal and cam2map commands and downsampled to 665 m/px. The phocube task was used to compute the local incidence, emission, phase and solar and spacecraft azimuth. Next, a sampling grid with a scale of 665 m was constructed (Fig. 1A). For all observations in each filter, the flux and the photometric angles are collected at each sampling point (Fig. 1A, 1B). This data was fitted with a basic Hapke model and different version of the Kasalaainen-Shkuratov models (KS1 to KS6 as defined in [8]). The fitted parameters were used to correct each observation to the standard illumination and observation geometry (i.e., incidence=30° and emission=0°) and average all the images in each band to obtain spectra at a higher SNR than those based on a single image of the same resolution.
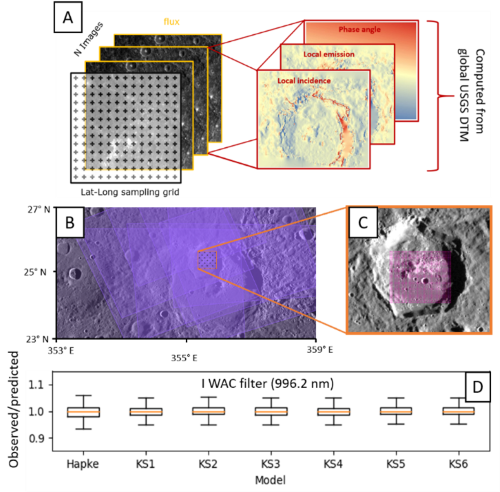
Figure 1 A) Sketch of the MDIS/WAC Canova dataset. B) WAC G-band image coverage (violet, in transparency. C) Area under investigation (pink square). D) Boxplots of the ratio between the observed and predicted flux for each fitted model.
Results and discussion: The performance of our correction is shown by the box-plots in Fig. 1D. On the y-axis we report the ratio of the observed vs predicted flux for the I (996.2 nm) band. We plot only 1 band for clarity, but the others give similar results. The fitted photometric models allow to reproduce the observed flux values with an error below 10% at 3σ, which is comparable with the radiometric accuracy of the MDIS/WAC datasets.
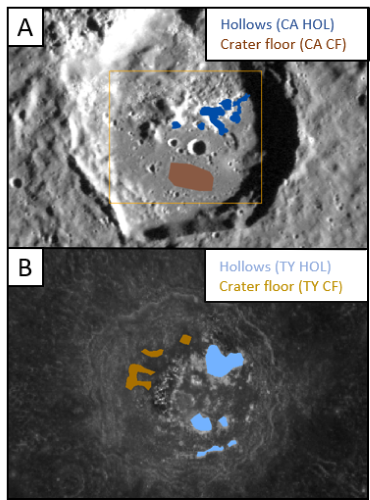
Figure 2 A) MDIS/NAC global mosaic of Mercury showing Canova crater. The blue and brown areas represent the Canova hollows (CA HOL). And crater floor material (CA CF) ROIs, respectively. B) MDIS/WAC image of Tyagaraja crater. Lightblue and gold areas are the Tyagaraja hollow (TY HOL) and crater floor material (TY CF) ROIs, respectively.
Figure 3 Continuum removed reflectance spectra of Canova and Tyagaraya hollows (CA HOL, TY HOL) and crater floor material (CA CF, TY CF).
Continuum removed reflectance spectra of the hollows and crater floor materials (“CA HOL” and “CA CF” ROIs in Fig. 2A for Canova ,“TY HOL” and TY CF” ROIs in Fig. 2B for Tyagaraja) were extracted from the average of all the corrected images in each band and are shown in Fig. 3. Consistently with the multi-band, MDIS/WAC, clustering-derived spectra from [5], our hollows spectra show an absorption between 600 and 800 nm. From the same ROIs we also extracted the best-fit parameters for all the photometric models. The distribution of the Hapke single-scattering albedo for the hollows and the crater floor material is shown in Fig. 3. In particular, hollows have a higher single-scattering albedo and a more spread distribution than the crater floor material. Interestingly, the hollows distributions are very similar for both craters.
Figure 4 Single scattering albedo (w) parameter for the Canova and Tygaraja Hollows (light-blue and blue histgorams) and crater floor materials (brown and gold histograms) in the MDIS/WAC filters.
Conclusions
We analyzed MDIS-WAC images in 8 out of the 11 WAC filters showing hollows on the floor of Canova and Tyagaraja craters on Mercury. These observations were used to fit several photometric models, allowing to standardize all images and obtain high SNR spectra of hollows and the crater floor material. Consistently with previous works, hollows are characterized by an absorption between 600 and 800 nm. In addition, we are investigating the model parameters for both materials in each band. This preliminary investigation already shows that hollows have a higher and more spread single-scattering albedo distribution than the crater floor material. In addition, the single-scattering albedo distributions of hollows at Canova and Tjagaraya are very similar. This spectrophotometric characterization will be useful to further investigate these features with high-resolution DTMs, color images and spectra from the SIMBIO-SYS [9] instrument onboard BepiColombo. A more in depth spectroscopic and photometric analysis, covering all the Hapke parameters and the considered photometric models will be presented at the conference.
Acknowledgements: This study is supported by the BepiColombo ASI-INAF contract n° 2017-47-H.0.
References: [1] Solomon, S.C., et al., 2007, Space Sci. Rev. Space Sci Rev 131, 3–39, [2] Blewett, D.T. et al, 2011. Science,80; [3] Blewett, D.T. et al., 2013 JGR:Planets,121,9,1798-1813; [4] Vilas, F., et al. 2016, GRL ,43,4, 1450-1456,[5] Lucchetti, A. et al., 2018. JGR:Planets, 123-9,2365-2379, [6] Pajola, M. et al, 2020, PSS, 105136, [7] Hawkins, S.E. et al., 2007. Space Sci Rev 131, 247–338 [9] Domingue, D. et al. 2016, Icarus, 268, 172-203 [9] Cremonese G. et al., 2020. Space Sci Rev 216, 75
How to cite: Munaretto, G., Lucchetti, A., Pajola, M., Cremonese, G., and Massironi, M.: Exploring the spectrophotometric properties of hollows from MESSENGER MIDS/WAC multiangular observations, Europlanet Science Congress 2021, online, 13–24 Sep 2021, EPSC2021-385, https://doi.org/10.5194/epsc2021-385, 2021.
1. Introduction
Launched on October 19th, 2018 (local time) towards Mercury, the BepiColombo spacecraft carries 16 instruments onboard the MPO and MMO orbiters. The SIMBIO-SYS (Spectrometer and Imagers for MPO BepiColombo Integrated Observatory SYStem) instrument [1] will image the surface of the innermost planet of the Solar system at unprecedented high spatial and spectral resolutions. SIMBIO-SYS is composed of 3 channels: STC (STereo Channel), a stereo camera; HRIC (High spatial Resolution Imaging Channel), a multispectral camera with a very high spatial resolution; and VIHI (Visible Infrared Hyperspectral Imager channel), a hyperspectral imager characterized by high spectral resolution and signal-to-noise ratio. The establishment of the target list for SIMBIO-SYS is underway. Therefore, studying potential targets of interest can be very useful to support their selection.
2. Data and methods
Here, we analyse the Degas crater, localized in the Shakespeare quadrangle (H-03) [2,3], hence at mid-latitudes of the northern hemisphere of Mercury (37.08°N, 232.66°E). Degas has been classified as a Kuiperian (-1 Gyr – today) crater [4] notably because of its well-preserved ray system of ejecta. We used MESSENGER data to investigate this crater with a three-fold approch: a multispectral analysis based on MDIS-WAC (Mercury Dual Imaging System-Wide Angle Camera) images have been combined with a spectroscopic analysis of MASCS (Mercury Atmospheric and Surface Composition Spectrometer) spectra and a geological analysis based on MDIS-NAC (Mercury Dual Imaging System-Narrow Angle Camera) images.
3. Preliminary results
3.1. Multispectral analysis
Using the MDIS-WAC images at the best spatial resolution available (95-250 m/pixel) and the Integrated Software for Imagers and Spectrometers (ISIS), we produced three color mosaics: an 11-bands mosaic to use all the multispectral information available with MDIS, an 8-bands mosaic to cover a wider area around the crater and study its surroundings (Figure 1), and a 3-bands mosaic with the best spatial resolution achievable (95 m/pixel).
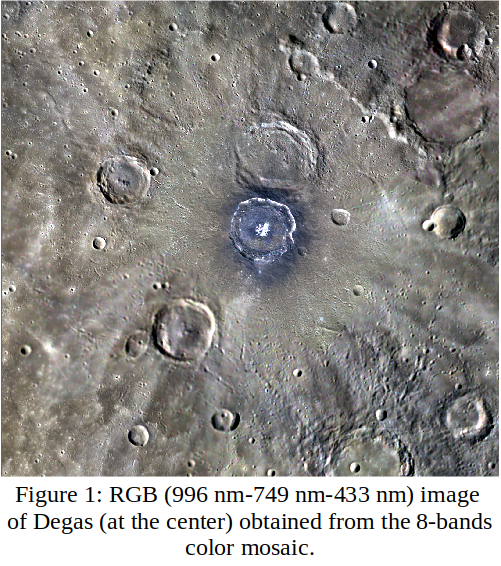
We also produced two high-resolution monochrome mosaics using MDIS-NAC images on which geological analysis was performed (see Section 3.3).
A Principal Component Analysis (PCA) was applied to the 11-bands mosaic. The enhanced color image obtained using PC1 and PC2 reveals an asymmetric distribution of LRM (Low Reflectance Material) [5] around the crater, which suggests an oblique impact. Finally, a K-mean clustering highlights 4 spectral units: the blue deposit on the crater floor, the floor not covered by this deposit, the LRM surrounding Degas and the ejecta blankets. Close spectral properties between hollows and the blue deposit on the floor of Degas are also evidenced.
3.2. Spectroscopic analysis
MASCS spectra have been extracted from the four multispectral units (Figure 2).
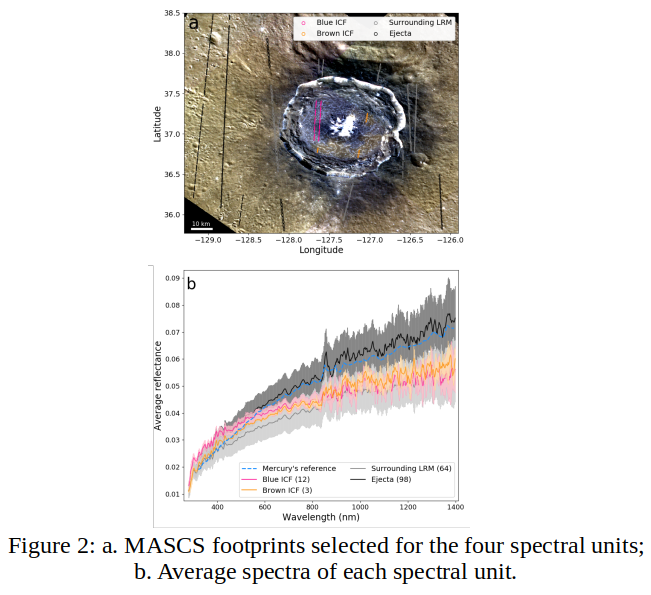
The spectral properties of both floor units differ in both the visible and the UV. To better highlight the variations of these spectral properties, we computed several spectral parameters: UV-downturn [6], reflectance at 750 nm, spectral slope in the visible, and spectral curvature [7]. We found that the two units of the floor have different visible slope and UV-downturn. Moreover, the blue deposit seems to have spectral properties similar to LRM, thus may contain such dark material.
3.3. Geological analysis
A high-resolution geological mapping of the Degas crater was performed on several NAC images mosaics of various spatial resolutions (Figure 3).
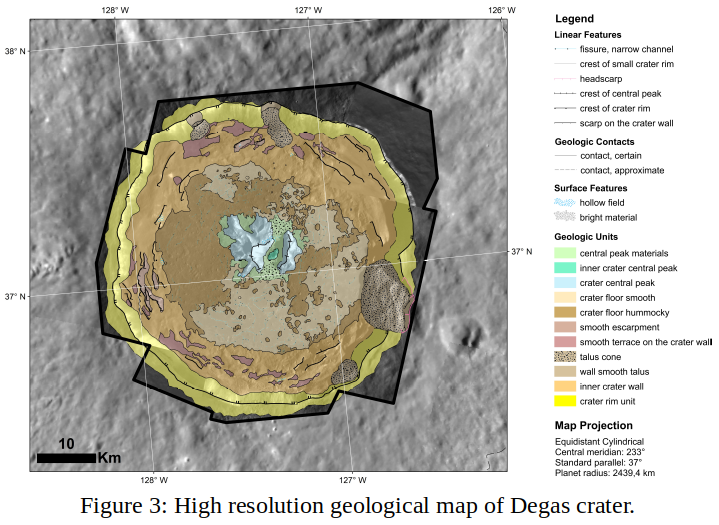
From a geological point of view, the floor is characterized by two different surficial textures mapped as smooth and hummocky crater floors. Dating of the floor shows a slightly younger age for the hummocky area than for the smooth area, but the floor as a whole is ~50 Ma younger than the ejecta. Finally, the central peak display hollows and bright materials at its base and an asymmetrical shape with a vergence towards East-South East. This provides another hint in favor of an oblique impact from North-North West, and is in good correlation with the LRM distribution around Degas.
4. Conclusion and perspectives
The crater Degas was probably formed by an oblique impact with a trajectory from North-North West to South-South East, and presents incredible geomorphological and compositional diversities. Its floor is morphologically and spectrally characterized by different materials, whose origins are still unclear (fall-back material or impact breccia for the hummocky area? Impact melt or resurfacing for the smooth area?). For these reasons, we strongly encourage closer observations of Degas with BepiColombo (SIMBIO-SYS, MERTIS, MIXS, MGNS and BELA).
Further results will be presented and discussed at the virtual talk.
Acknowledgements
This work is partly supported by the Centre National d'Études Spatiales. We gratefully acknowledge funding from the Italian Space Agency (ASI) under ASI-INAF agreement2017-47-H.0. The authors acknowledge the use of MESSENGER data.
References
[1] Cremonese, G, et al.: SIMBIO-SYS: Scientific Cameras and Spectrometer for the BepiColombo Mission, Space Sci Rev, 216, 2020.
[2] Guzzetta, L, et al.: Geology of the Shakespeare quadrangle (H03), Mercury, Journal of Maps, 13, 227-238, 2017.
[3] Bott, N, et al.: Global Spectral Properties and Lithology of Mercury: The Example of the Shakespeare (H-03) Quadrangle, JGR Planets, 124, 2326-2346, 2019.
[4] Banks, M. E., et al.: Revised constraints on absolute age limits for Mercury’s Kuiperian and Mansurian stratigraphic systems, JGR Planets, 122, 1010-1020, 2017.
[5] Klima, R. L., et al.: Global Distribution and Spectral Properties of Low-Reflectance Material on Mercury, Geophysical Research Letters, 45, 2945–2953, 2018.
[6] Goudge, T. A., et al.: Global inventory and characterization of pyroclastic deposits on Mercury: New insights into pyroclastic activity from MESSENGER orbital data, JGR Planets, 119, 2014.
[7] Barraud, O, et al.: Near-Ultraviolet to Near-Infrared Spectral Properties of Hollows on Mercury: Implications for Origin and Formation Process, JGR Planets, 125, 2020.
How to cite: Bott, N., Barraud, O., and Guzzetta, L.: The Degas crater on Mercury: an interesting target for the BepiColombo mission?, Europlanet Science Congress 2021, online, 13–24 Sep 2021, EPSC2021-412, https://doi.org/10.5194/epsc2021-412, 2021.
In 1991, the Earth-based radar observations by both Goldstone and the Very Large Array revealed areas with high radar backscatter within Mercury’s north polar region [1]. These radar-bright materials have been interpreted as water ice deposits located within the permanently shadowed regions (PSRs) of polar craters due to the similar radar characteristics between them and those observed on Martian polar ice caps. This interpretation is also supported by the thermal models constructed by [2], which indicated that Mercury’s polar environments are capable of hosting stable water-ice deposits at the surface or shallow subsurface for geologic timescales. In addition, multiple data sets from the MErcury Surface, Space ENvironment, GEochemistry, and Ranging (MESSENGER, [3]) mission measured high hydrogen concentrations confirming that these radar-bright materials are predominantly composed of water ice [4]. On the other hand, measurements of surface reflectance of permanently shadowed areas also reveal regions of anomalously dark and bright deposits at 1064 nm wavelength that are concentrated on poleward facing slopes and spatially collocated with areas of high radar backscatter. Correlation of observed reflectance with modeled temperatures indicates that the optically bright regions are consistent with surface water ice, whereas dark regions are consistent with a surface layer of complex organic material that overlies buried ice and provides thermal insulation [5].
Figure 1 shows the radar image of Mercury’s north polar region where yellow spots are representative of water ice deposits located within impact craters. The analysis of such craters can provide new insights into the behavior of water ice deposits and the landscape evolution. For this reason, in this work, we investigate the morphology of eleven craters located at latitude over 80° N. We chose such craters because they are situated in a high-density region of MLA tracks and host low-reflectance deposits. In particular, Ensor, Bechet and Fuller craters have been selected for the presence of brightness variations associated with secondary impact craters [6], while Jimenez, Kirby, Josetsu and Sapkota craters for their poor radar bright signals.
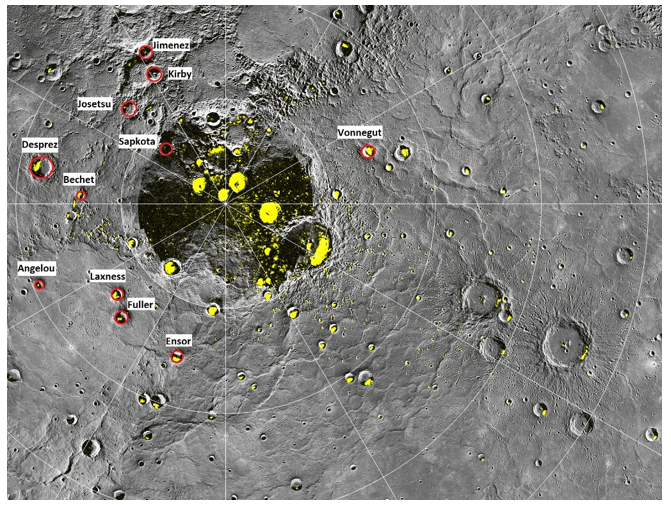
Fig.1 - The highest-resolution radar image of Mercury’s north polar region made from the Arecibo Observatory [7] is shown in yellow on a mosaic of MESSENGER orbital images. The red circles outline the craters analyzed in this work. Image credit: NASA/Johns Hopkins University Applied Physics Laboratory/Carnegie Institution of Washington
We are performing a high detailed geomorphological mapping of each impact crater (the preliminary work on Fig.2) using the highest resolution MDIS (Mercury Dual Imaging System [8]) image and, in addition, we will perform morphometric analysis using the MLA (Mercury Laser Altimeter [9]) data. Through the detailed analysis of the features and structures located within the selected impact craters, we will investigate their similarities and differences aiming to explain how the presence of the ice water deposits could affect their landscape and evolution.

Fig 2 – A preliminary mapping of Ensor crater. The data are managing in GIS environment and photointerpretation led to the identification of different units.
Acknowledgement: This activity has been realized under the BepiColombo ASI-INAF contract no 2017- 47-H.0.
References: [1] Butler B. J. et al. (1993) JGR 98, 15003-15024; [2] Paige D. A. et al. (1992) Science 258, 643-646; [3] Solomon S. C. et al., (2007) Space Sci. Rev. Space Sci Rev 131, 3–39 [4] Chabot N. L.., et al. (2018a), in Mercury: The View After MESSENGER, ed. S. C. Solomon et al. (Cambridge: Cambridge Univ. Press) 13; [5] Neumann G. A. et al., (2012) Science; [6] Deutsch A. N. et al. (2019) Earth and Planetary Science Letters 520, 26-33; [7] Harmon J. K. et al. (2011) Icarus 211, 37-50; [8] Hawkins S. E. et al. (2007) Space Sci Rev 131, 247–338; [9] Cavanaugh J.F. et al. (2007) Space Sci Rev 131, 451–479.
How to cite: Bertoli, S., Lucchetti, A., Pajola, M., and Cremonese, G.: Landform analysis of craters on the Permanently Shadowed Regions, Mercury, Europlanet Science Congress 2021, online, 13–24 Sep 2021, EPSC2021-471, https://doi.org/10.5194/epsc2021-471, 2021.
Introduction: The way that material is transported downslope via mass wasting can be indicative of the environmental conditions of that planetary body. For example, on Mars the discovery of gullies (alcove-channel-fan systems) was initially linked to flowing liquid water (e.g., Malin and Edgett, 2000), but now is linked to the seasonal sublimation of carbon dioxide ice (e.g., Dundas et al., 2019) and hence the existence of gullies tells us about the climate on Mars. The existence of long runout landslides on Ceres has been linked to the existence of ground ice on that body (Duarte et al., 2019). Before the arrival of MESSENGER at Mercury, processes driven by crustal volatiles were not considered likely, yet the existence of faculae indicating explosive volcanism (e.g., Jozwiak et al., 2018) and hollows indicating volatile loss in the top ten to hundreds of metres (e.g., Blewett et al., 2011), have refuted this assumption. Inspired by these discoveries and the serendipitous identification of what appear to be downslope mass wasting features (Malliband et al., 2019), we have performed a systematic survey for landforms that may indicate slope processes. In a second step we will then assess if these features are linked to surface volatile-driven processes. The results of our survey will be useful for selecting targets for acquisition by BepiColombo’s instruments.
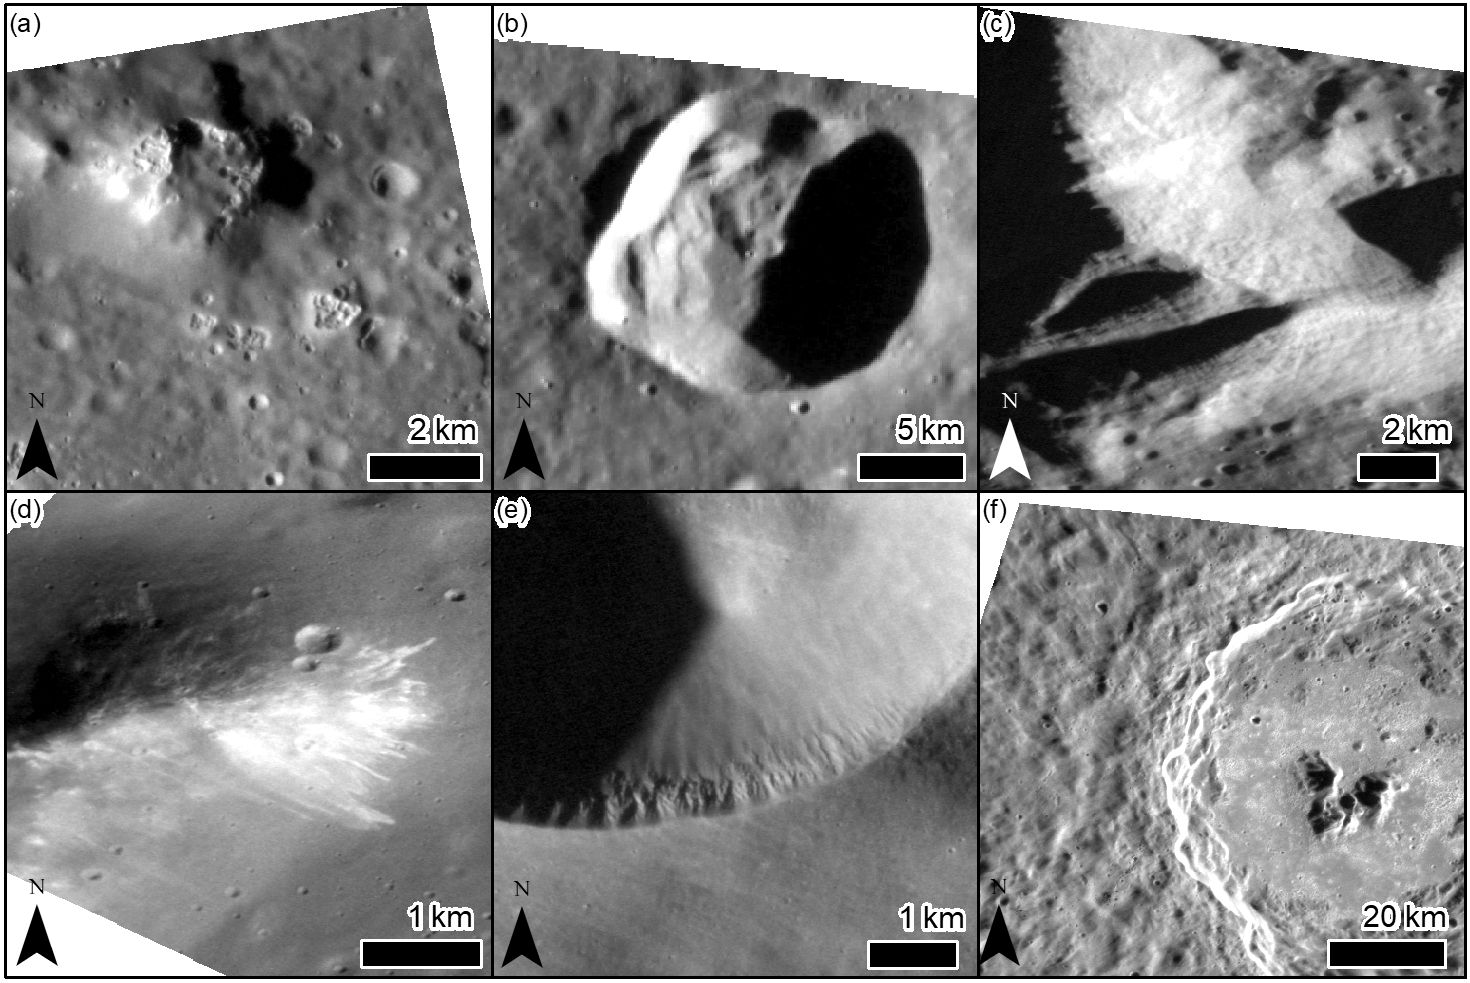
Figure 1: Examples of features identified in this study: (a) hollows in image EN0221196012M, (b) landslides on a crater wall in image EN0227768640M, (c) Cross-hatch texture in image EN0223744554M, (d) lineae in image EN1044173928M, (e) spur and gully morphology in EN1034263486M and (f) lobate ejecta in image EN0220761474M.
Data and Methods: We used all images from MESSENGER’s Mercury Dual Imaging System (MDIS) Narrow Angle Camera (NAC) at better than 100 m/pixel mean resolution between latitudes of 20°N and 65°N to survey for landforms that might indicate slope processes. Here, we report on the intermediate results where we have found 1387 images out of the 8936 so far analysed which have evidence for potential slope processes.
Preliminary results: We have so far identified the following distinct classes of landform (in descending order of frequency), shown in Figure 1:
- Hollows – these are the most common landform we identified and can be found superposed on sloping terrain. As reported in previous research (e.g. Blewett et al., 2011; Thomas et al., 2014) they are identifiable by their high albedo and are expressed as steep-sided shallow flat-floored depressions. They can be up to tens of kilometres in diameter. Hollows are identifiable even in the highest resolution images so we cannot give an estimate of their minimal diameter.
- Lineae – first identified by Malliband et al. (2019) these are downslope trending linear features that are expressed as albedo in high-sun images and as relief in low-sun images.
- “Cross-hatch” also called “Elephant hide” texture (Zharkova et al., 2020) which is also found on the Moon, is a regular surface texture.
- Landslides – identifiable by the head-scarp and associated deposits as reported in Brunetti et al. (2015).
- Spur and gully morphology - characterised by protruding regularly spaced spurs of bedrock at the top of the slope with talus aprons downslope. They commonly found on Mars (Conway et al., 2018) and rarely on the Moon (Senthil Kumar et al., 2013) and Vesta (Krohn et al., 2014).
- Ejecta lobes – these are coherent sheets of ejecta deposits with a somewhat lobate, raised lateral margins as described in (Xiao and Komatsu, 2013) and have been related to topographic steps.
- Rimless pits, interpreted as volcanic vents (e.g., Jozwiak et al., 2018; Pegg et al., 2021) – these were mapped to provide context to the other observations, as they indicate volatile-driven processes and their steep walls can host mass wasting features.
Conclusions and future work: Nearly all the features described above are associated with slopes on crater walls or peak elements, with relatively few occurring on the walls of pits interpreted as volcanic vents. We aim to analyse the geographic distribution of these features taking into account their visibility with viewing geometry/illumination conditions. Further, we will examine their context and inter-relationships. Our preliminary observations indicate that, spur and gully morphology, lineae and ejecta lobes only occur only in relatively fresh craters, whereas “Cross-hatch” morphology is only found in relatively degraded craters.
Acknowledgements: CA and SJC are grateful for the support of the French Space Agnecy CNES for supporting their BepiColombo related work. We gratefully acknowledge funding from the Italian Space Agency (ASI) under ASI-INAF agreement 2017-47-H.0.
References:
Blewett, D.T., et al., 2011. Hollows on Mercury: MESSENGER Evidence for Geologically Recent Volatile-Related Activity. Science 333, 1856–1859. https://doi.org/10.1126/science.1211681
Brunetti, M.T., et al., 2015. Large rock slides in impact craters on the Moon and Mercury. Icarus 260, 289–300. https://doi.org/10.1016/j.icarus.2015.07.014
Conway, S.J., et al., 2018. Glacial and gully erosion on Mars: A terrestrial perspective. Geomorphology 318, 26–57. https://doi.org/10.1016/j.geomorph.2018.05.019
Duarte, K.D., et al., 2019. Landslides on Ceres: Diversity and Geologic Context. J. Geophys. Res. Planets 2018JE005673. https://doi.org/10.1029/2018JE005673
Dundas, C.M., et al., 2019. The Formation of Gullies on Mars Today. Geol. Soc. Lond. Spec. Publ. https://doi.org/10.1144/SP467.5
Jozwiak, et al., 2018. Explosive volcanism on Mercury: Analysis of vent and deposit morphology and modes of eruption. Icarus 302, 191–212. https://doi.org/10.1016/j.icarus.2017.11.011
Krohn, et al., 2014. Mass movement on Vesta at steep scarps and crater rims. Icarus 244, 120–132. https://doi.org/10.1016/j.icarus.2014.03.013
Malin, M.C., Edgett, K.S., 2000. Evidence for recent groundwater seepage and surface runoff on Mars. Science 288, 2330–2335. https://doi.org/10.1126/science.288.5475.2330
Malliband, C.C., et al., 2019. Potential Identification of Downslope Mass Movements on Mercury Driven by Volatile-Loss, in: Lunar and Planetary Science Conference. p. #1804.
Pegg, D.L., et al., 2021. Explosive vent sites on mercury: Commonplace multiple eruptions and their implications. Icarus 365, 114510. https://doi.org/10.1016/j.icarus.2021.114510
Senthil Kumar, P., et al., 2013. Gullies and landslides on the Moon: Evidence for dry-granular flows. J. Geophys. Res. Planets 118, 206–223. https://doi.org/10.1002/jgre.20043
Thomas, R.J., et al., 2014. Hollows on Mercury: Materials and mechanisms involved in their formation. Icarus 229, 221–235. https://doi.org/10.1016/j.icarus.2013.11.018
Xiao, Z., Komatsu, G., 2013. Impact craters with ejecta flows and central pits on Mercury. Planet. Space Sci. 82–83, 62–78. https://doi.org/10.1016/j.pss.2013.03.015
Zharkova, A. Yu., et al., 2020. Regolith textures on Mercury: Comparison with the Moon. Icarus 351, 113945. https://doi.org/10.1016/j.icarus.2020.113945
How to cite: Aubry, C., Conway, S., Malliband, C., Galluzzi, V., and Giacomini, L.: A survey of landforms indicating slope processes in the mid-latitudes of Mercury, Europlanet Science Congress 2021, online, 13–24 Sep 2021, EPSC2021-490, https://doi.org/10.5194/epsc2021-490, 2021.
Introduction
The explosive volcanism of a planet is a key process for understanding its thermal and geochemical evolution and for assessing its volatile budget over time. The MESSENGER (MErcury’s Surface, Space ENvironment GEochemistry and Ranging) spacecraft highlighted products of Mercury's explosive activity. Pit landforms are interpreted to be endogenic pyroclastic vents on the basis of their irregular and often elongated morphology and their lack of raised rim [1]. These endogenic pits are often surrounded by high albedo deposits with diffuse borders, named faculae. They are interpreted as pyroclastic deposits formed by the fragmentation and ejection of magma particles from the central volcanic vent. Faculae exhibit redder spectral slope and stronger downturn of reflectance in the ultraviolet (UV) than their background terrains [2]. Here, we present a detailed spectral analysis of 26 faculae using all the available data of the Mercury Atmospheric and Surface Composition Spectrometer (MASCS) onboard MESSENGER. In order to constrain the eruptive style and the pyroclast composition, we investigated the spectral variability between the faculae.
Material and method
We used the MASCS Derived Data Record (DDR) data products available on the Planetary Data System (PDS). These data have been radiometrically and photometrically calibrated by the MESSENGER team. Additional processing, using the method developed by [3], is applied to the data to obtain a continuous spectrum from 300 to 1450 nm. The MASCS observations are filtered by instrument temperature and incidence angle. The data carried out in the highest temperature regime of the instrument (temperature exceeding 40°C) are discarded. Observations made at incidence angles greater than 75° have also been removed in order to limit variations due to photometry at high phase angles. With the aim to highlight spectral properties of faculae, we computed spectral parameters: the UV-downturn [2], the reflectance at 750 nm (R750) and the slope in the visible (VIS-slope) [4]. The parameters UV-downturn and VIS-slope are normalized by the Mercury’s reference spectrum [5], thus the VIS-slope and UV-downturn are respectively equal to 1 and 3.0 (reevaluated at 3.1 by Besse et al., 2020) for the average surface of Mercury.
The faculae with the highest number of observations, spatial coverage and spatial distribution of observations have been selected for this study [4]. The size of 26 of them has been determined with MASCS data allowing optimal spectral analysis [4]. As in [6], the spectral properties of the faculae are taken at the midpoint between the limit of the vent and edges of the facula. This allows to minimize the issue due to the intrinsic variability across the faculae (spectral parameters decrease from the limit of the vent to the edge of the facula) [3,6].
Results and discussion
The 26 faculae are located over a latitudinal range between 60°S and 50°N and a longitudinal range between -165°E and 160°E (Fig. 1). About three quarters of them are located within impact craters.
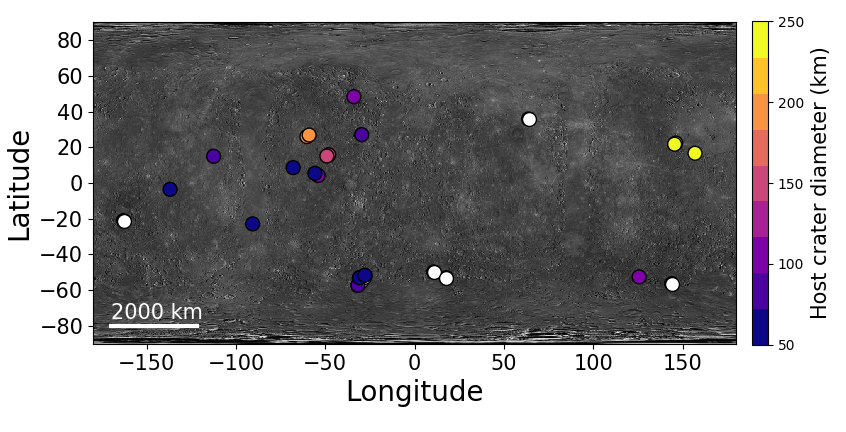
Figure 1: Location of the faculae analyzed here. The color code is the crater host diameter. The white faculae are not located within impact craters.
Spectral analysis revealed that faculae located within the same impact crater have close values of spectral parameters (Fig. 2). This finding may be explained by 1) same magmatic source between the nearby faculae or 2) large contributions of country rocks in the pyroclastic material. The first hypothesis has already been observed in lunar pyroclastic deposits within the Lavoisier impact crater which share similar spectral features indicating similar mineralogical compositions. The second hypothesis which suggests a low fraction of melt in rising magmas, is supported by the high volatile content needed to emplace. In addition, topographic data and modelling suggest that faculae are very thin blankets, which implies a low volume of material consistent with the hypothesis that the faculae are mainly composed of country rocks.
Nathair facula, which is the largest pyroclastic deposit on Mercury, appears as an endmember in the visible, with the highest values of R750 and VIS-slope, at the midpoint of the facula (Fig. 2) . The high reflectance of the Nathair facula in the visible may be due to finer grain size [7]. High dispersal and high degree of fragmentation of the pyroclasts are representative of phreatomagmatic eruptive style on Earth. The phreatomagmatic-like process occurs when hot-magma interacts with a volatile-rich surficial or subsurface volatile layer. The proximity of the Nathair facula to a carbon-enriched layer could explain this phreatomagmatic-like event.
Figure 2: Parameter spaces at the midpoint of the faculae in the visible and ultraviolet domains from [4]. The black dashed lines represent the Mercury mean spectrum (Izenberg et al., 2014). The error bars correspond to the standard deviation of the MASCS observations in each facula. The color code represents the host crater diameter (km). a) UV-downturn versus R750 at the midpoint of the facula. b) UV-Downturn versus VIS-slope at the midpoint of the facula.
Conclusion
Spectral analysis of 26 faculae at the surface of Mercury revealed that the hermean pyroclastic deposits may consist of a large fraction of country rock compared to juvenile magma. This hypothesis suggests that rising magmas are mainly composed of gas. The physical and spectral characteristics of the Nathair facula suggest emplacement by a phreatomagmatic-like event.
Future observations of the BepiColombo/ESA-JAXA mission will help to test these hypotheses about Mercury's explosive activity. Combined observations from BELA, SIMBIOS-SYS, MERTIS, MGNS and MIXS could constrain the volume of the faculae, the grain size (and thus the degree of fragmentation) and the composition of the pyroclasts (e.g. percentage of volcanic glass, mineralogical composition) in order to better determine the eruptive dynamics of explosive activity on Mercury.
References
[1] Thomas, R. et al., (2014), J. Geophys. Res. Planets 119. [2] Goudge, T. A. et al., (2014), J. Geophys. Res. Planets, 119. [3] Besse, S. et al., (2015), J. Geophys. Res. Planets, 120. [4] Barraud, O. et al (submitted). Icarus. [5] Izenberg, N.R. et al. (2014). Icarus, 228. [6] Besse, S. et al., (2020), J. Geophys. Res. Planets, 125 [7] Crown, D.A. and Pieters, C.M. (1987). Icarus, 72.
How to cite: Barraud, O., Besse, S., Doressoundiram, A., Cornet, T., and Munoz, C.: Eruptive style on Mercury, constraints from spectral analysis, Europlanet Science Congress 2021, online, 13–24 Sep 2021, EPSC2021-592, https://doi.org/10.5194/epsc2021-592, 2021.
Introduction: Mercury is divided into 15 quadrangles, and the one yet to be mapped using NASA’s MESSENGER mission data is the Bach quadrangle (H-15) at Mercury’s south pole. This region encompasses everything from 65 ° poleward. Prior to this project, the only published map of this quadrangle is at 1:4.3M scale, based on Mariner-10 imaging at 0.5 km per pixel or worse resolution, and covers less than half of H15 (Fig 1). It includes patches of a ‘very smooth plains’ unit that was not mapped elsewhere on Mercury at the time. Our inspection of MESSENGER image data suggests that some of these patches are additional examples of topographically/tectonically confined late-stage lavas recently tentatively identified further north, consistent with a drawn-out waning phase of effusive volcanism. We aim to produce a detailed 1:3M resolution geological map and interpret the geology of H-15, tying it in to the ongoing mapping of quadrangles H-11 and H-14 bordering it. This is essential preparation for planning more detailed studies using BepiColombo.
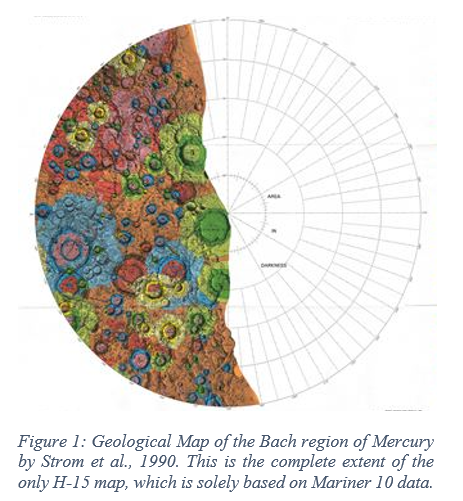
Alongside the geological mapping, this project aims to analyse polar tectonic features that are largely invisible in the north polar region (possibly because of flooding by the smooth plains of Borealis Planitia). This will involve comprehensive investigation of the nature, distribution and cause of the abundant south polar tectonic features and will use multiple illumination angles so as to limit illumination bias.
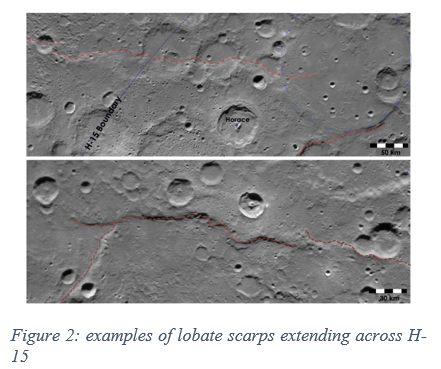
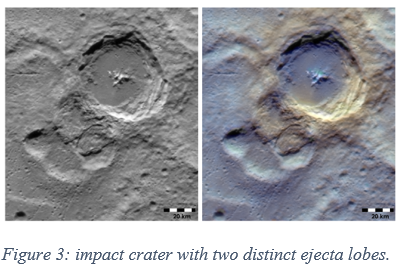
Our initial reconnaissance of the quadrangle has led to the identification of lobate ejecta forms extending from impact craters. Such craters with ejecta flows are rare on Mercury and in H-15 exclusively originate from the rims of fresh craters, propagating into interiors of older craters. The example with the most distinct lobes exhibits two discrete lobes with steep fronts, spectrally bright material around the crater rim and bluer impact melt on the larger of the two lobes (Fig 3). Comparisons can be drawn between the morphology of these lobate ejecta and ejecta deposits of the Hokusai crater (Barnouin et al., 2015)[1] and the Tsiolkovskiy crater on the Moon (Boyce et al., 2020)[2]. We find that formation of these ejecta flows is topographically controlled, and favour the conclusions of Barnouin et al. (2015) and Xiao and Komatsu (2013)[3] that these are fluidized ejecta deposits, although the nature and role of crustal volatiles is currently unclear.
References: [1] Barnouin et al. (2015) LPSC 46, 2672. [2] Boyce et al. (2020) Icarus 337, 113464. [3] Xiao, Z. and Komatsu, G. (2013) Planet. Space Sci. 82, 62–78.
How to cite: Lennox, A., Rothery, D., Wright, J., Balme, M., and Conway, S.: Geological Mapping of Mercury’s South Polar Quadrangle (H-15), Europlanet Science Congress 2021, online, 13–24 Sep 2021, EPSC2021-737, https://doi.org/10.5194/epsc2021-737, 2021.
Introduction
In light of the low oxygen fugacity inferred for Mercury, it is expected that Si is the dominant light constituent of Mercury’s core, potentially combined with smaller amounts of C and S. Depending on specific assumptions on Mercury’s oxidation state and bulk composition (for example, assuming a CB or EH chondrite-like bulk composition), geochemical estimates for the amount of Si, C, and S in Mercury’s core differ [1,2]. The concentration of light elements in Mercury’s core can be assessed independently from geochemical inferences using geophysical measurements. Geodetic constraints on the interior mass distribution of Mercury are derived from Mercury’s (close proximity to a) Cassini state 1 [3]. The compositional range of Mercury’s core for which the mass distribution of the planet is in agreement with geodetic measurements can be examined by planetary interior structure modelling [4-6]. Such interior structure modelling requires a composition-dependent parametrisation of the thermodynamic properties of metallic core alloys. Experimental measurements of density and of ternary Fe-Si-C liquids at high pressures have been lacking, although they are crucial to constrain the compositional range of Mercury’s core, and of bulk Mercury, using geodetic information of the planet.
We experimentally measured the density and P-wave velocity (VP) of Fe-Si-C liquid metallic mixtures at high pressure, and investigated the feasible range of Mercury’s core composition in light of present geodetic constraints by interior structure modelling.
Methods
Density measurements of Fe-Si-C liquid metals are performed at high-pressure and high-temperature by X-ray absorption techniques with a Paris-Edinburgh (PE) press at beamline ID-27 of the European Synchrotron Radiation Facility (ESRF) in Grenoble, France. Binary Fe-Si sample powder is loaded into a cylindrical diamond (C) sample container, which saturates the sample in C. X-ray absorption profiles of the C-saturated Fe-Si-C metallic liquid sample are obtained in-situ, and of the quenched sample after the experiment ended and brought to ambient conditions. The density of the recovered samples is measured by hydrostatic weighing at the IPGP in Paris, France. The density of the liquid sample at experimental conditions is derived by combining the density of the quenched sample and the post-situ X-ray absorption profile with the in-situ X-ray absorption profile, using the Beer-Lambert law for X-ray absorption.
Ultrasonic VP measurements of Fe-Si liquid metals are performed at high-pressure and high-temperature with a PE press at beamline 16-BMB of the Advanced Photon Source (APS) synchrotron facility, in Argonne, Illinois. Ultrasonic signals of 20 MHz, 25 MHz, and 30 MHz are generated and received in-situ by a lithium niobite transducer located at the top of the setup. Vertical wave reflections at the top and at the bottom of the sample are recorded and used to determine the vertical two-way travel time of the ultrasonic wave through the sample. The sample length is determined from radiographic images that are collected in situ. The ultrasonic sound speed (VP) through the sample is calculated using the sample length and the two-way travel time of sound waves.
The samples that are successfully recovered from both the density experiments and the VP experiments are analysed by electron microprobe at the Institute for Mineralogy in Münster, Germany. A ternary ideal mixing model (FESIC) is fitted to the Fe-Si-C liquid metal density and data obtained by us and to data available in literature. This mixing model is implemented in spherically symmetric interior structure models of Mercury that are constrained by the normalized moment of inertia of Mercury I=0.346±0.014 MR2 and that of its outer solid shell Im=0.1475±0.006 MR2 [3]. The thermal profile is taken linear in the upper part (assumingly conductive) of the core, and adiabatic lower in the core. An Fe-Si-C solid inner core is considered where temperature is below the melting temperature of the liquid alloy. The mantle and an assumed 40 km thick curst are parametrized as single density spherical shells with fixed density ratio.
Results
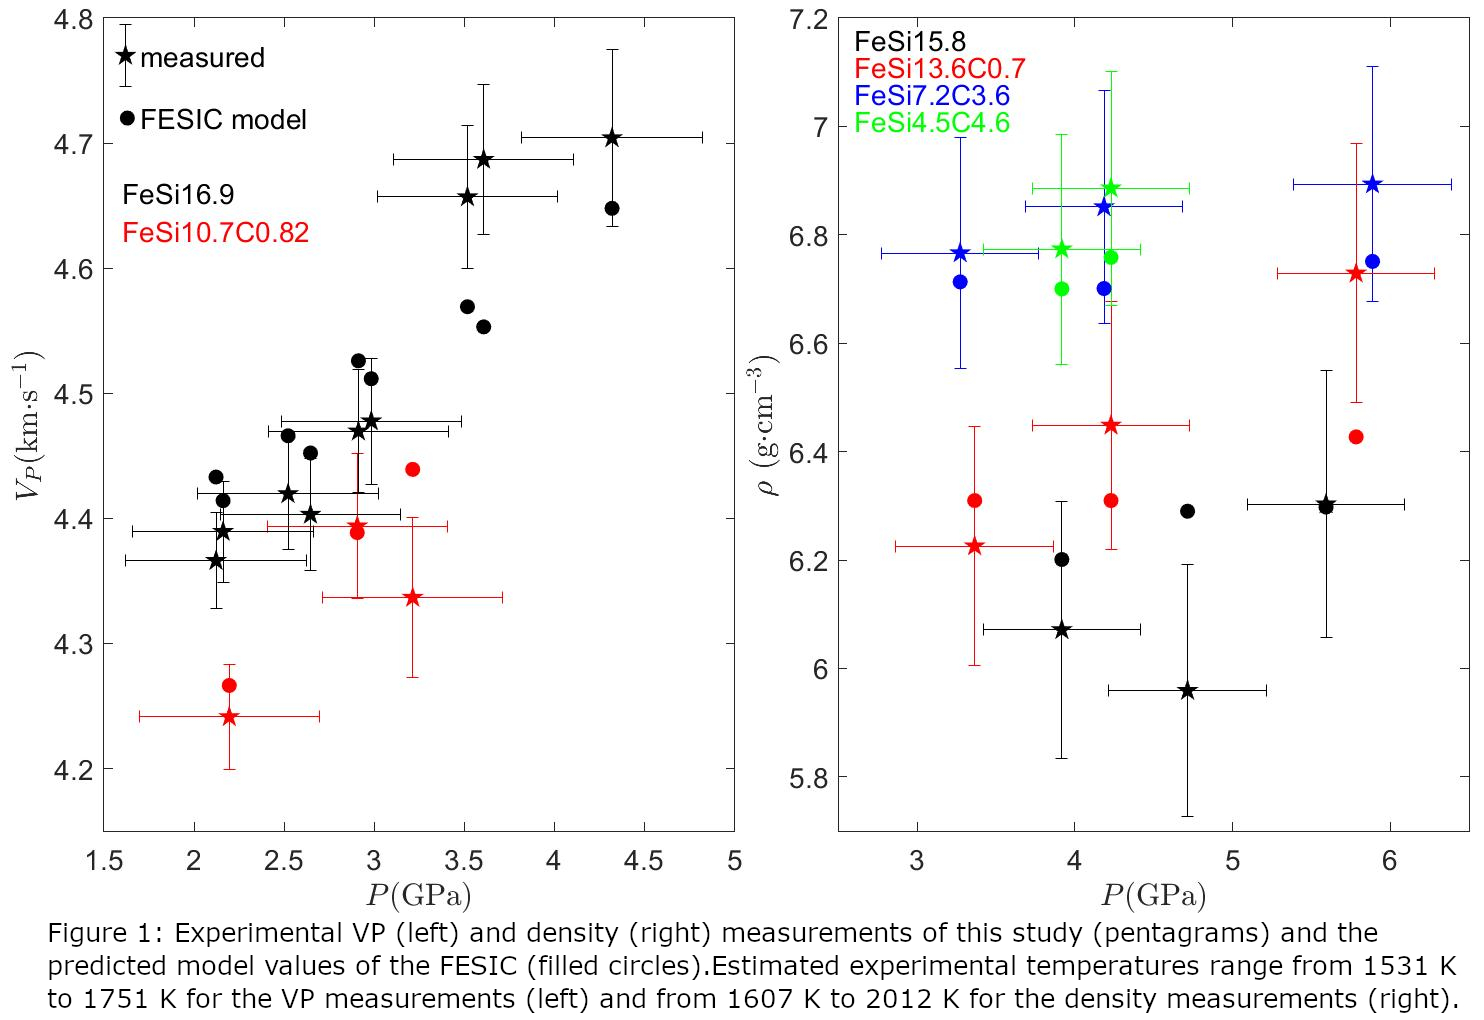
Figure 1 compares the obtained density and VP measurements with the FESIC mixing model. The results confirm previous studies that VP of Fe-rich liquid metal increases and the density decreases with increasing concentration of Si. For the C-saturated density measurements, the decrease of C with increasing Si concentration confirms that the solubility of C in Fe-Si metals decreases with increasing concentration of Si. In the VP experiments, the sample was not loaded in a C-saturated environment. Nonetheless, we did detect a small amount of C in the sample with ~10wt%Si.
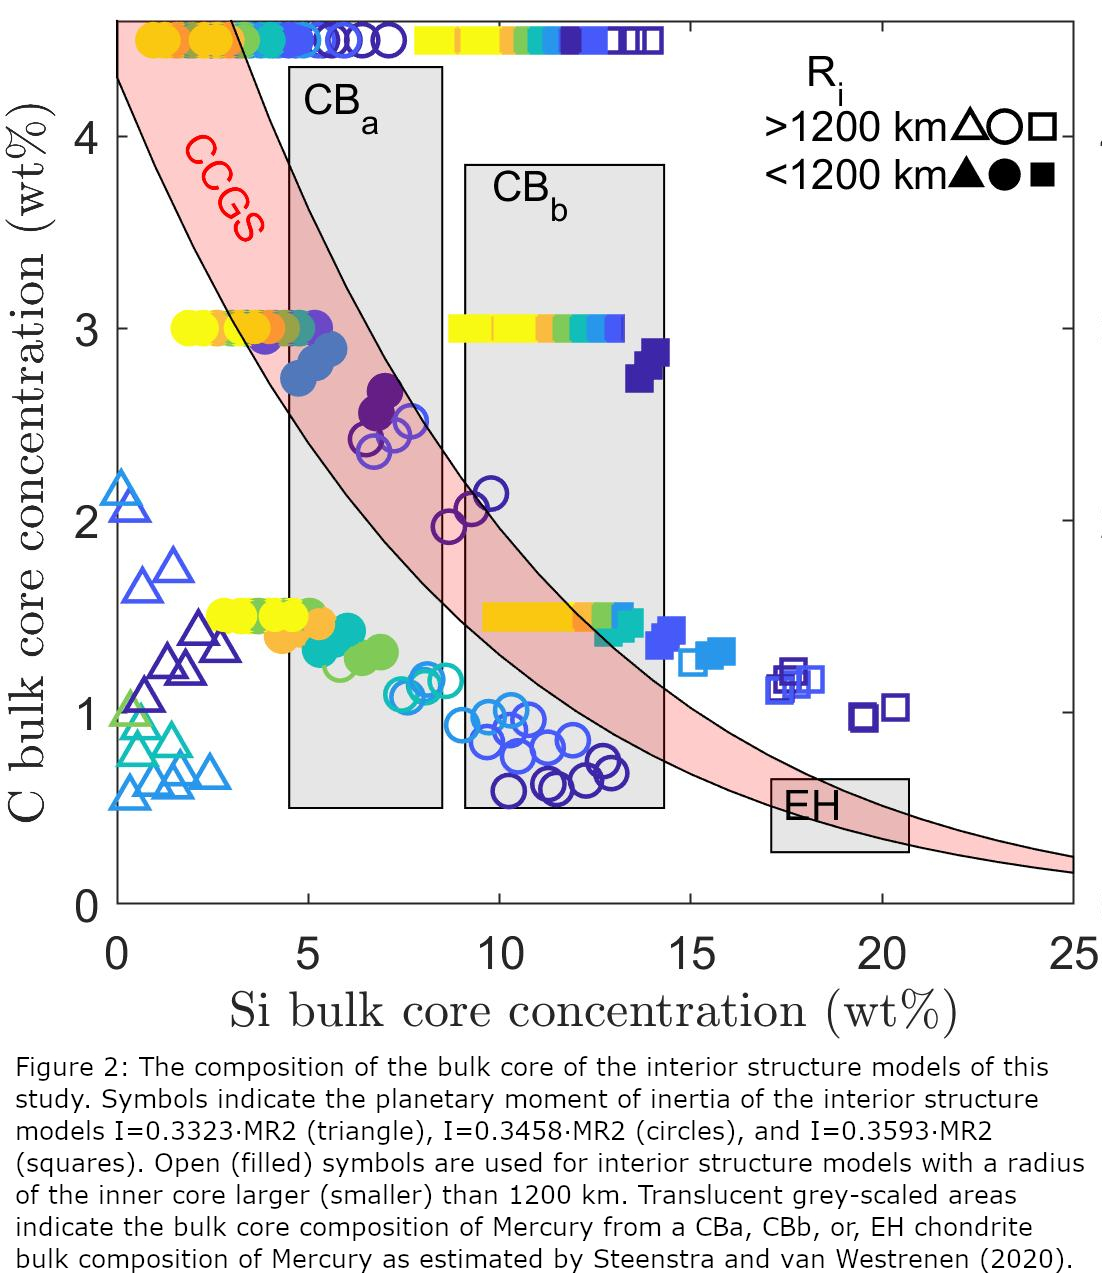
The bulk-core compositions of interior structure models, constrained by the I and Im mentioned above, are compared to estimated core composition from by geochemical methods [1] from assuming a bulk composition of Mercury similar to an EH chondrite or CB chondrites (figure 2). The Si and C concentrations of Mercury’s core that are estimated from assuming a CB-like bulk composition of Mercury are consistent with the core composition of interior structure models with the central value of I (0.3458·MR2). A EH chondrite-like bulk composition of Mercury is thought to have a large core concentration of Si, and can only be met with an obliquity of Mercury at the upper end of the uncertainty limit, the planet is cold, and the inner core is large. The latter is inconsistent with the deep-dynamo explanation for Mercury’s broad-scale low-intensity magnetic field [7]. This study is published and openly accessible [8].
Acknowledgements
We acknowledge the Marie Sklodowska-Curie grant No 845354 awarded to JSK and the BRAIN-be program grant (BR/143/A2/COME-IN) to TVH. The X-ray absorption measurements were performed at the European Synchrotron Radiation Facility (ESRF), Grenoble, France. The APS is operated by Argonne National Laboratory under Contract No. DE-AC02-06CH11357.
[1] Steenstra E. S. and W. van Westrenen (2020) Icarus, 340, 113621 [2] Vander Kaadden et al. (2020) JGR:Planets, 125(5), e2019JE006239 [3] Margot et al. (2012) JGR:Planets, 117(E12), E00L09 [4] Hauck et al. (2013), JGR:planets, 118(6), 1204-1220 [5] [Rivoldini A. and T. Van Hoolst (2013) Earth Planet. Sci. Lett., 377-378, 62-72 [6] Knibbe J. S. and W. van Westrenen (2015) JGR:Planets, 120(11), 1904-1923. [7] Christensen, U. (2006) nature, 444(7122), 1056-1058. [8] Knibbe et al. (2021), JGR:Planets, 126(1), e2020JE006651.
How to cite: Knibbe, J., Rivoldini, A., Luginbuhl, S., Namur, O., Charlier, B., Mezouar, M., Sifre, D., Berndt, J., Kono, Y., Neuville, D., van Westrenen, W., and Van Hoolst, T.: Mercury’s Interior Structure constrained by Density and P-wave Velocity Measurements of Liquid Fe-Si-C Alloys, Europlanet Science Congress 2021, online, 13–24 Sep 2021, EPSC2021-747, https://doi.org/10.5194/epsc2021-747, 2021.
Abstract
The BepiColombo spacecraft was launched on 20 October 2018 from the European spaceport in French Guyana and is currently on its way to Mercury. On its way, the spacecraft will swing-by Mercury six times in its stacked configuration, before releasing the Mercury Magnetospheric Orbiter (MMO) and the Mercury Planetary Orbiter (MPO) in their corresponding orbits around the target planet.
Introduction
Mercury is in many ways a very different planet from what we were expecting. On 20 October 2018 the BepiColombo spacecraft [1] started its 7 year journey to the innermost terrestrial planet to investigate on the fundamental questions about its evolution, composition, interior, magnetosphere, and exosphere.
BepiColombo is a joint project between the Euro- pean Space Agency (ESA) and the Japanese Aero- space Exploration Agency (JAXA). The Mission con- sists of two orbiters, the Mercury Planetary Orbiter (MPO) and the Mercury Magnetospheric Orbiter (MMO). From their dedicated orbits the two space- craft will be studying the planet and its environment.
The mission has been named in honor of Giuseppe (Bepi) Colombo (1920–1984), who was a brilliant Italian mathematician, who made many significant contributions to planetary research and celestial mechanics.
During the cruise phase, the spacecraft flies in a stacked configuration: the MMO and MPO are mounted ontop of the Mercury Transfer Module (MTM). As a consequence, most remote sensing instruments onboard the MPO are mounted towards the MTM and have a fully obstructed field-of-view. The MMO instrumentation is shielded by a protection shield (MOSIF) and several instruments still await the deployment on measurement booms.
Despite the reduced instrument availability, scientific and engineering operations will be scheduled during the cruise phase, especially during the swing-bys.
Mercury Swing-bys
Following the Earth and two Venus swing-bys, six Mercury swing-bys are foreseen from October 2021 until 9 January 2025. The poster will discuss the flyby geometries and potential operation opportunities, in comparison with the three MESSENGER Mercury swing-bys from 2008 and 2009 [2][3].
References: [1] Benkhoff, J., et al. (2010) Planet. Space Sci. 58, 2-20. [2] Baker, D.N. et al. (2011) Planet. Space Sci 59, 2066-2074. [3] McNutt, R.L. et al. (2010), Acta Astronautica V67, Iss 7-8, p 681-687
How to cite: Zender, J., Benkhoff, J., Murakami, G., and Montagnon, E.: BepiColombo – Mercury Swing-Bys, Europlanet Science Congress 2021, online, 13–24 Sep 2021, EPSC2021-353, https://doi.org/10.5194/epsc2021-353, 2021.
BepiColombo was launched on 20 October 2018 from the European spaceport Kourou in French Guyana and is now on route to Mercury to unveil Mercury’s secrets. BepiColombo a joint project between the European Space Agency (ESA) and the Japanese Aerospace Exploration Agency (JAXA) consists of two orbiters, the Mercury Planetary Orbiter (MPO) and the Mercury Magnetospheric Orbiter (Mio). It will perform measurements to increase our knowledge on the fundamental questions about Mercury’s evolution, composition, interior, magnetosphere, and exosphere.
During its 7-year long journey to the innermost terrestrial planet Mio and MPO are connected to each on-top of the Mercury Transfer Module (MTM). The MTM contains a solar electric propulsion engine and will bring the two spacecraft to Mercury. In late 2025, this ‘stack’ configuration is abandoned, the MTM will be jettisoned and the individual elements spacecraft are brought in to their final Mercury orbit: 480x1500km for MPO, and 590x11640km for Mio.
On its way BepiColombo with its state of the art and very comprehensive payload has several opportunities for scientific observations - during the cruise into the inner solar system and during its nine planetary flybys (one at Earth, two at Venus and six at Mercury). However, since the spacecraft is in a stacked configuration not all of the instruments can be operated during the cruise phase.
Some of the instruments have been already operated regularly or partially during the flybys in their “scientific” observation mode: e.g. the magnetometer (MPO-MAG), the accelerometer (ISA), the environmental sensor (BERM), the gamma-ray and neutron spectrometer (MGNS), the solar intensity x-ray and particle spectrometer (SIXS), the radio science experiment (MORE), using the X-band and the Ka-band, the thermal infrared spectrometer (MERTIS), the UV spectrometer (PHEBUS) and some sensors of the SERENA suite. Also, instruments or some parts of the instruments of the Japanese Mio spacecraft like the dust monitor (MDM), the plasma wave instrument (PWI), the particle and plasma experiments of MPPE and the magnetometer (MGF) were already successfully operated in their science modes. BepiColombo also took regular “selfie” images with their three monitoring cameras on the MTM. These cameras were also able to take a sequence of outreach images during the flybys at Earth and Venus in 2020. Other instruments such as cameras and NIR spectrometer (SIMBIO-SYS), the laser altimeter (BELA), the x-ray spectrometer (MIXS), and parts of the electron, neutron, and iron sensors of SERENA on MPO and MSASI and some dedicated sensors of PWI and MPPE are operational, but can only be used in their scientific modes after the Mercury in-orbit commissioning in early 2026 because their field of view is blocked by the underlying Transfer Module.
Despite the reduced instrument availability, scientific and engineering operations has been scheduled during the cruise phase, especially during the swing-bys. A status of the mission and instruments and a summary of first results from measurements taken during the first three years en route to Mercury will be given.
How to cite: Benkhoff, J., Zender, J., Murakami, G., and Montagnon, E.: The ESA-JAXA BepiColombo mission: status and first results, Europlanet Science Congress 2021, online, 13–24 Sep 2021, EPSC2021-365, https://doi.org/10.5194/epsc2021-365, 2021.
The BepiColombo Laser Altimeter (BELA) is one of ten payloads on-board the Mercury Planetary Orbiter (MPO) on cruise to Mercury as part of the ESA and JAXA mission BepiColombo. BELA is a single beam laser altimeter operating at 1064 nm. The nominal pulse repetition is 10 Hz, while the pulse energy of each transmitted pulse is 50 mJ. The detector features a silicon avalanche photo diode (APD) with enhanced quantum efficiency for infrared radiation. The detected return pulse signal can be amplified using 16 predefined gain settings within the Analogue Electronics Unit (AEU). Finally, the amplified signal is digitized with a sampling frequency of 80 MHz, i.e. in samples of 12.5 ns, and is analysed by an on-board signal processing unit, the Range Finder Module (RFM). Within this pulse processing, nominal values for time of flight are determined for up to four alternative return pulse candidates. Additional parameters such as pulse width and pulse energy are obtained.
Since launch in 2018 the receiver, power converter, and data processing modules of BELA were checked regularly twice a year. The instrument showed excellent performance and all tested parts are operating nominaly. However, the transmitter was not operated because the line-of-sight of the lasers is right in the direction of the BepiColombo transfer module. Hence, the instrument’s data acquisition and processing were tested with dark noise measurements.
The expected power of the return pulse from Mercury’s surface will vary roughly between 1 and few hundred nW, depending on altitude and surface slope. In order to face this large variability, 16 gain settings with signal amplifications between 4 and 44 dB will be used for different phases within the orbit. The measurements during the cruise checkouts were used to characterize the noise of the receiver as a function of the commanded gain. By simulating realistic return pulse signals over one revolution about Mercury the commanded gain setting for each spacecraft altitude will be optimized with the ultimate goal of reaching the highest accuracy in the range measurement. Here we will report on the results of the first 5 BELA cruise checkouts, performed between 2019 and June 2021.
BELA is a joint German–Swiss project with the participation of Spain. LML acknowledges financial support from the State Agency for Research of the Spanish MCIU through the "Center of Excellence Severo Ochoa" award to the Instituto de Astrofısica de Andalucia (SEV-2017-0709) and from project PGC2018-099425-B-I00 (MCI/AEI/FEDER, UE).
How to cite: Stark, A., Hussmann, H., Wickhusen, K., Lüdicke, F., Hüttig, C., Gwinner, K., Thomas, N., Lara, L. M., and BELA team, T.: In-cruise checkouts of the BepiColombo Laser Altimeter (BELA): Implications for performance and operations at Mercury, Europlanet Science Congress 2021, online, 13–24 Sep 2021, EPSC2021-648, https://doi.org/10.5194/epsc2021-648, 2021.
Introduction: The IRIS (Infrared and Raman for Interplanetary Spectroscopy) laboratory at the Institut für Planetologie in Münster produces a database of mid-infrared spectra for the ESA/JAXA BepiColombo mission to Mercury. The MERTIS (Mercury Radiometer and Thermal Infrared Spectrometer) instrument onboard the BepiColombo Mercury Planetary Orbiter allows mapping spectral features in the 7-14 µm range, with a spatial resolution of about 500 meters [1,2].
In addition to a variety of natural terrestrial and meteoritic materials for the comparison of the expected results, we started using synthetic analogues based on the chemical composition of Mercury measured by MESSENGER. This allows to produce infrared spectra of bodies from which no material as returned samples or meteorites is available so far [3-5]. Advanced modelling based on the chemistry of Mercurian lavas and high-temperature experiments to simulate the mantle formation and the crystallization of lavas at the surface resulted in prediction for modal mineral compositions for distinct surface regions [6-8]. This allows to produce synthetic mixtures of minerals and glass representative for these hermean regions.
Samples & Techniques: For the first round of mixing studies of powdered samples, sample compositions were selected from modal compositions based on experiments covering the dominant mineralogically diverse, 3.6–3.5 Gyr old volcanic smooth plains regions on Mercury [6,7]. The experimental conditions (for details see [7,8]) were temperatures between 1170-1360°C and highly reducing conditions (ΔIW of -4.9 to -6.2). Of the run products described in [7], we picked modal compositions covering a wide range of phase compositions, ranging from pure glass to the most crystalline composition modelled (crystalline content from 9-58 wt%).
The analogues were prepared using mixtures of synthetic glass material based on hermean compositions [7-9] and natural crystalline forsterite, enstatite, diopside and plagioclase, with compositions in the range that was observed in the petrological experiments [7]. All materials were sieved into 4 size fractions before (0-25 µm, 25-63 µm, 63-125 µm, 125-250 µm), and the analogue mixtures composed directly from the size fractions.
Diffuse reflectance mid-infrared spectra were made with a Bruker Vertex 70 infrared system using a Cooled MCT detector. Analyses of the powders were made at low pressure (10-3bar) to reduce atmospheric bands from 2-20 µm. For calibration, a diffuse gold standard was used for ratioing, to guarantee low noise, we integrated 512 scans for each spectrum. Spectral features of interest are the Christiansen Feature (CF), a characteristic reflectance low that also serves as proxy for the bulk composition; the Transparency Feature (TF), typical and indicator for the finest grain size fraction (0-25 µm); and the Reststrahlen Bands (RBs), the molecular vibration modes.
Results: In the range of interest for MERTIS (7-14 µm), the entirely glassy end member shows a simple spectrum with a strong RB at 9.6 µm, a CF at 7.9 µm and the TF at 11.77 µm [4]. Increased crystalline content (9 wt% forsterite, 91 wt% glass) in sample ID 345 Smooth Plains has two RB appearing at 9.6 µm and 10.5-10.6 µm, and a weaker RB at 10.2 µm. The CF is at 7.9-8 µm, the TF at ~11.7 µm.
Sample ID 344 Smooth Plains contains several crystalline species (5 wt% forsterite, 2 wt% diopside, 28 wt% plagioclase and 11 wt% enstatite). This results in a feature-rich spectrum, with RBs at 9.5 µm, 9.9 µm, 10.2 µm, 10.5 µm, 10.8 µm, 11.1 µm and 11.3-114 µm. The CF is found at 7.8-7.9 µm, the TF is at 11.7 µm.
The crystalline-rich end member ID 343 Smooth Plains has only 42 wt% glass components with 6 wt% forsterite, 11 wt% diopside, 34 wt% plagioclase and 7 wt% enstatite. RBs are seen at 9.4 – 9.6 µm, 9.9 µm, 10.2 µm, 10.5 µm, 10.8 µm and 11.3 µm. The TF is at 11.6 µm, the CF at 7.9 - 8 µm.
Discussion: Spectra show increasing RB features with decreasing content of glass (Fig.1). However, a comparison of the finest size fractions (0-25 µm) (Fig.2) of the 4 samples shows astonishingly similar spectra, basically the smooth glass spectra of with relatively weak RB on top, with the spectrum dominated by the TF. This could make distinguishing of such spectra of a continuum of similar composition difficult.
Contrasts between the spectra are stronger at the larger grain size fractions (>25µm), where the RB features are stronger. Variations in band intensities between the different samples – particular the high intensity of the ID 344 Smooth Plains spectrum – could be results of a highly reflective component (Enstatite?) or indicator of insufficient mixing of the phases.
Summary & Conclusions: We will continue by mixing further samples based on the hermean surface models and experiments [7], with the aim to have series of samples representative for each of the terranes. Future spectral unmixing models will test if the individual mineral components can be extracted by modelling form the spectra.
References: [1] Benkhoff J. et al. (2020) Planetary and Space Science 58, 2-20 [2] Hiesinger H. et al. (2020) Planetary and Space Science 58, 144–165 [3] Morlok et al. (2020) Icarus 335, 113410 [4] Morlok et al. (2019) Icarus 324, 86-103 [5] Weber et al. (2020) Earth and Planetary Science Letters 530, 115884 [6] Weider S.Z. et al. (2015) Earth and Planetary Science Letters 416, 109-120 [7] Namur and Charlier (2017) Nature Geoscience 10, 9-15 [8] Namur O. et al. (2016) Earth and Planetary Science Letters 448, 102-114 [9] Nittler L.R. et al. (2018) Mercury: The View after MESSENGER. Cambridge University Press, Cambridge, pp. 30-51.
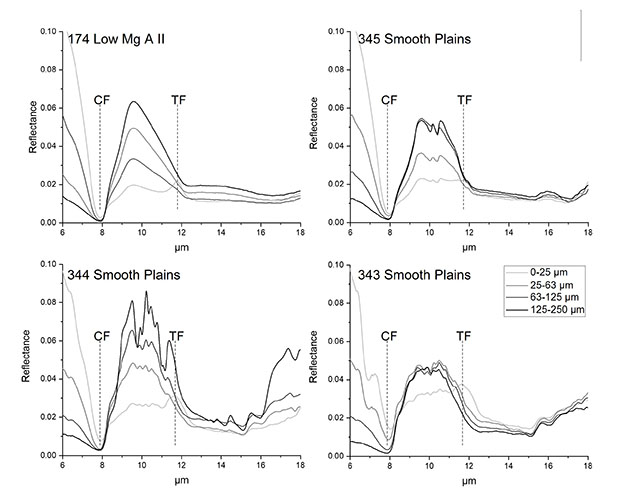
Figure 1. Mid-infrared diffuse reflectance spectra of 4 size fractions. CF: Christiansen Feature, TF: Transparency Feature.
Figure 2. Mid-infrared diffuse reflectance spectra of the 0-25 µm size fractions.
How to cite: Andreas, M., Charlier, B., Renggli, C., Klemme, S., Namur, O., Weber, I., Stojic, A. N., Reitze, M. P., Bauch, K. E., Schmedemann, N., Carli, C., Hiesinger, H., and Helbert, J.: Synthetic Analogs for the Surface of Mercury: FTIR Studies of Smooth Plains Analogs, Europlanet Science Congress 2021, online, 13–24 Sep 2021, EPSC2021-294, https://doi.org/10.5194/epsc2021-294, 2021.
Glassy materials have been recognized over Mars, Moon and many different meteorites (Farrand et al. 2016; Delano 1986; Varela & Kurat 2004). Planetary glasses result from impact events but they are also found as volcanic products (Farrand et al 2016). Morlock et al. (2017) and Morlok et al. (2021) investigated by means of different experimental techniques (bi-directional diffuse reflectance FTIR, in situ FTIR microscopy, Raman, EPMA and optical microscopy) a suite of synthetic samples with composition similar to those inferred for different Hermean terrains. Here we extended the study of the same materials to the VNIR region (bidirectional reflectance spectroscopy: 350 to 2500 nm). We analyzed 8 different samples with different chemical compositions, produced under different oxygen fugacity conditions We prepared eight granulometric classes between 0 and 250 μm, namely: 0-25; 25-63; 63-100; 100-125; 125-150; 150-180; 180-200 and 200-250 μm. The dominant feature in the VNIR region is due to the Fe absorption band at about 1 μm accompanied, in the more oxidized samples, by a smaller feature at 480 nm likely due to ferric oxide development. Iron free samples (FeO < 0.1 wt%) show characteristic spectral shapes with a distinctive feature at about 640 nm attributable to TiO2. Even for very low FeO content, it is possible to observe a weak yet clear band at about 900-1000 nm due to Fe absorption which explain the dominance of the spectral features due to Fe absorption at higher FeO content. Additional small bands at higher wavelengths (1300-1400 and 1900 nm) suggest a low content of water and/or –OH species in the samples. We investigated the spectral features as a function of composition, grain size and oxidation in order to gain as much information as possible on the nature of the spectra and compare them with remote sensing data or meteorites VNIR comparison. Our data on synthetic and realistic Hermean compositions will allow a better understanding of remotely acquired VisNIR spectra, which will be particularly helpful in view of the upcoming beginning of the BepiColombo ESA/JAXA mission.
Acknowledgments: The authors acknowledge financial contribution from the Italian Space Agency (ASI) under ASI-INAF agreement 2017-47-H.0 (Simbio-SYS). CC, EB are also supported by agreement ASI-INAF n.2018-16-HH.0.
How to cite: Bruschini, E., Carli, C., Morlok, A., Capaccioni, F., Stojic, A., Weber, I., Reggli, C., Klemme, S., and Hiesinger, H.: Vnir reflectance spectroscopyof Mercury like glasses, Europlanet Science Congress 2021, online, 13–24 Sep 2021, EPSC2021-741, https://doi.org/10.5194/epsc2021-741, 2021.
Introduction
Mercury reflectance spectra obtained with the Mercury Atmospheric and Surface spectrometer (MASCS) on board MESSENGER spacecraft lack absorption features to constrain the mineralogical composition of surface materials. In particular, reflectance spectra exhibit no clear evidence for an absorption band centered near 1 µm that would be associated with the presence of ferrous iron in silicates [1]. Multispectral measurements from the Mercury Dual Imaging System (MDIS/MESSENGER) show evidence of weak absorption features in several geological units. Multispectral observations of Low Reflectance Materials (LRM) exhibit a weak, broad absorption band near 600 nm, which is consistent with carbon [2]. Hollows landforms, unique to Mercury, revealed a weak absorption feature around 630 nm attributed to sulfides like CaS and/or MgS [3], or a mixture of sulfides and pyroxenes [4]. MASCS reflectance spectra of hollows lack absorption features, however, they show a strong concave curvature between 300 and 600 nm, unique to hollow materials [5]. Here, we present a comparison between the reflectance spectra of Mercury's hollows and measurements carried out in laboratory under the thermal conditions of Mercury's surface [6] in preparation for the BepiColombo observations. This comparison is done with the aim to better constrain the composition of Mercury’s hollows from reflectance spectra.
Material and method
The MASCS instrument consists of a visible detector (VIS) between 300 and 1050 nm and a second detector in the near-infrared range (NIR) between 850 and 1450 nm. We used the MASCS Derived Data Record (DDR) data products available on the Planetary Data System (PDS). These data have been radiometrically and photometrically calibrated by the MESSENGER team. Additional processing, using the method developed by [7], is applied to the data to obtain a continuous spectrum from 300 to 1450 nm with a spectral resolution of 5 nm. Due to the configuration of the spacecraft, MASCS observations are carried out with large phase angles; no observations below 78° are available. The reflectance spectra of hollows used in this study are similar to those used by [5]. The 113 spectra are from hollows within Hopper, Tyagaraja, Warhol and Eminescu impact craters.
The laboratory measurements used are carried out on synthetic powder samples of sulfides (CaS, MgS-old, MgS-syn, CrS, FeS, MnS, NaS, TiS) of at least 99 % purity and grain size about 10 µm. Here, we used spectra achieved on fresh and heated (500°C) sulfides between 300 and 1000 nm with a spectral resolution around 4 cm-1 and phase angle of 80°.
The curvature of MASCS and laboratory spectra are computed in the same way. This parameter is represented by the coefficient of the squared power of the polynomial fit (degree 2) of the spectrum between 300 and 600 nm [5]:
Reflectance= cλ2+ bλ + a (c=curvature)
The curvature is then normalized to the reference spectrum provided by [1], who computed it from an average of 850,000 spectra of Mercury's surface. Thus, Curvature parameter equals to 1 is representative of Mercury's mean surface.
Results
The curvature parameter of MASCS reflectance spectra of hollows ranges from 3 to 17. The curvature of the samples MgS-old heated, TiS heated (gray exterior), CaS heated and CaS fresh are respectively 22, 38, 45 and 72. MgS-syn (heated and fresh) and NaS (heated and fresh) have curvature parameters superior to 100. The sample of CrS, FeS, MnS and TiS (heated green interior) heated and fresh have negative curvature parameters which indicate convexe spectral curvature.
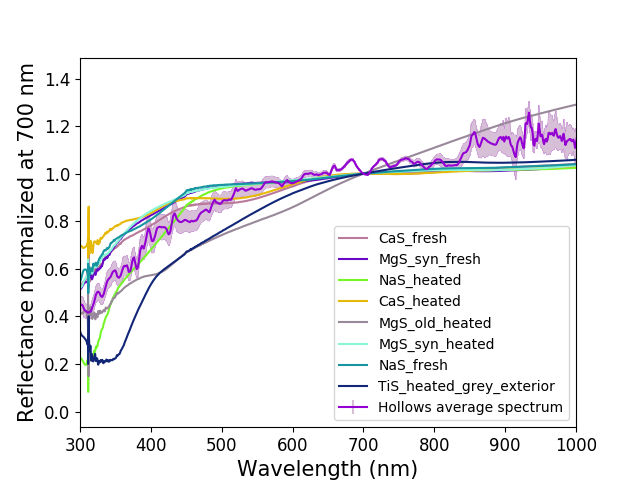
Figure 1: Hollows mean spectrum [5] and sulfides spectra [6]. The spectra are normalized by the reflectance at 700 nm for comparison. Only the sulfides with curvature superior to one are represented here.
Reflectance spectra of TiS heated sample (grey exterior) exhibits a strong absorption band centered around 330 nm which is not observed in MASCS data (Fig. 1). In addition, MESSENGER XRS (X-ray spectrometer) and GRS (Gamma ray spectrometer) observations indicate low abundance of Ti (<1 wt%) which makes TiS an unlikely candidate for hollows [8]. The most favourable candidates are CaS, MgS et NaS. Although the curvature of these quasi-pure samples is higher than that of the MASCS spectra, a portion of them in the hollows may contribute to the observed curvature. XRS data reveal a positive correlation between the concentrations of S and Ca on Mercury’s surface interpreted as evidence for an abundance of Ca-bearing sulfide minerals (e.g., oldhamite) [8].
Conclusion
Preliminary results show that the curvatures observed in hollows reflectance spectra may be related to the presence of sulfide-bearing minerals. The curvature parameter, if linked to the composition, allows us to eliminate a number of sulfides including CrS, FeS, MnS and TiS (fresh) which have negative curvatures. The most likely candidates seem to be CaS, MgS and NaS, the first two having already been proposed for the weak absorption band observed in the multispectral data. To better characterize the volatiles, we conduct further work on linear spectral or physical mixture models to quantify the sulfide concentrations in hollows by comparing with observation.
References
[1] Izenberg et al. (2014). Icarus, 228. [2] Klima et al. (2018). GRL, 45(7), 2945-2953. [3] Vilas et al. (2016). GRL, 43(4), 1450-1456. [4] Lucchetti et al., (2018). J. Geophys. Res. Planets, 123. [5] Barraud et al. (2020). JGR: Planets, 125(12), e2020JE006497. [6] Varatharajan et al. (2019). Earth and Planetary Science Letters, 520, 127-140. [7] Besse et al., (2015), J. Geophys. Res. Planets, 120. [8] Nittler et al. (2011). Science, 333.
How to cite: Barraud, O., Doressoundiram, A., and Besse, S.: Spectral curvature of hollows on Mercury as an indicator of their composition?, Europlanet Science Congress 2021, online, 13–24 Sep 2021, EPSC2021-596, https://doi.org/10.5194/epsc2021-596, 2021.
Orbital data from the Messenger spacecraft (1) reveal that part of the Mercury surface is covered by smooth plains, which are interpreted to be flood volcanic material across the planetary surface (2). In this work, we present a detailed geo-structural map of the northern smooth plains between latitudes 29°N and 65°N. Our 1:100.000-scale map is obtained semi-automatically, using an algorithm to map all scarps from a DEM (3,4) followed by visual inspection and classification in ArcGIS. We created a DEM using the raw MLA (Mercury Laser Altimeter) data (1) ,with 500 m/pix, and we used the Mercury Messenger MDIS (Mercury Dual Imaging System) (1,2) base map with 166m per pixel for the classification stage. With this approach, we mapped and characterized 51664 features on Mercury, creating a database with several morphometric attributes (e.g. length, azimuth, scarp height) which we will use to study the tectonic evolution of the smooth plains.
In this way, we classified wrinkle ridges’s scarps, ghost craters, rim craters and central peaks. The morphometric parameters of the wrinkle ridges will be quantitatively analyzed, in order to characterizer the possible tectonic process that could have formed them.
This map can be considered an enhancement for the north pole of the global geological map of Mercury (1, 5).
References
- Hawkins, S. E., III, et al. (2007), The Mercury Dual Imaging System on the MESSENGER spacecraft, Space Sci. Rev., 131, 247–338..
- Denevi, B. W., et al. (2013), The distribution and origin of smooth plains on Mercury, J. Geophys. Res. Planets, 118, 891–907, doi:10.1002/jgre.20075.
- Alegre Vaz, D. (2011). Analysis of a Thaumasia Planum rift through automatic mapping and strain characterization of normal faults. Planetary and Space Science, 59(11-12), 1210–1221. doi:10.1016/j.pss.2010.07.008 .
- Vaz, D. A., Spagnuolo, M. G., & Silvestro, S. (2014). Morphometric and geometric characterization of normal faults on Mars. Earth and Planetary Science Letters, 401, 83–94. doi:10.1016/j.epsl.2014.05.022.
- Kinczyk, M. J., Prockter, L., Byrne, P., Denevi, B., Buczkowski, D., Ostrach, L., & Miller, E. (2019, September). The First Global Geological Map of Mercury. In EPSC-DPS Joint Meeting 2019 (Vol. 2019, pp. EPSC-DPS2019).
How to cite: cardinale, M., Di Achille, G., and A.Vaz, D.: Global Mapping and Analysis of the Structural Features in the Northern Smooth Plains of Mercury, Europlanet Science Congress 2021, online, 13–24 Sep 2021, EPSC2021-743, https://doi.org/10.5194/epsc2021-743, 2021.
Abstract
The coordinated Mercury’s global mapping project (Galluzzi et al. (2021), aims at delivering quadrangle geological maps for the entire surface of Mercury by using the available basemaps derived from the NASA MESSENGER Mercury Dual Imaging Systems (MDIS) images. The NASA MESSENGER mission was able to cover the surface of Mercury with an average resolution of 200 m/px globally. This allows to produce a series of 1:3M regional geologic maps to be used in support to the ESA/JAXA BepiColombo mission. Here we present the status of the geologic mapping of the Eminescu (H-09) quadrangle, which covers the area between latitudes 22.5°N, -22.5°S and longitudes 72°E, 144°E. The selection of this quadrangle was based on its wealth of many interesting features (e.g., Beagle Rupes, hollow deposits on Eminescu crater, pyroclastic deposits at the margin of the Caloris basin) and on the color variability between the different terrain types that allows to reconstruct the geological history of H-09.
Methods
In this work, we used the available basemaps derived from the MESSENGER MDIS instrument images, such as the monochrome morphology image mosaics at high- and low-incidence angle (BDR, HIE, HIW and LOI) with a resolution of 166 m/px, together with the enhanced-color and 3-color global mosaics, having a resolution of 665 m/px.
The chosen 1:3M output scale is achieved by mapping at an average scale of 1:400k, which is appropriate for the used basemaps. For the symbology, we applied, and in some cases revisited, the Federal Geographic Data Committee (FGDC) and the United Stated Geographic System (USGS) recommendations. The classification of the crater types was based on their diameter, degradation degree and superposition order. The crater's ejecta, central peak, and floor morphology (hummocky or smooth) were distinguished and mapped only for craters larger than 20 km, to avoid the saturation of map features. The terrain units were identified by means of morphology and crater-density, by distinguishing between smooth, intermediate and intercrater plains. We used different symbologies for geological contacts and linear features by distinguishing between certain and approximate contacts, or certain and uncertain/hidden structures, respectively. In particular, the linear features layer encompasses morphologies such as crater rims (up to 5 km in diameter), fault scarps, wrinkle ridges and volcanic vents. The variability in color and albedo was digitized within a surface features polygon layer (e.g., dark material, bright material, and hollow clusters). We did not consider details smaller than 4 km, nor linear features whose distance was smaller than this same threshold to avoid map readability issues.
Results
The mapping of H-09 is still in progress. The preliminary analysis shows an intriguing morphology related to endogenic and exogenic processes, where intensive tectonic and cratering structures constitute together the main geological events that provided the heterogeneity of terrains in the quadrangle. The tectonic events were probably driven by global cooling, however, we found both compressive and tensional tectonic features on the surface. Hollow clusters are spread all over the quadrangle in different sizes and locations (e.g., crater floors, central peaks). The Eminescu crater located in H-09, between latitudes 12.3°N, 8.8°N and longitudes 115.9°E, 112.2°E in H-09, is a relatively young crater on Mercury's surface and is characterized by extensive ejecta for one radius from the crater's rim and a recently hollowed central peak. These features and its enhanced color variability will probably require a higher-resolution study of this crater by integrating the geomorphological map with spectral data.
This map will be the first geological product for this region with such a scale. Once the mapping is completed, we will be able to determine the absolute ages of the units to classify the terrains in chronological order and provide a complete geological and morphological analysis to understand the geological evolution of the quadrangle. Therefore, through the mapping of H-09 we aim at supporting the ESA/JAXA BepiColombo mission to Mercury by targeting all interesting features and contributing to the investigation and the understanding of Mercury.
Keywords: Mercury (planet), Eminescu Quadrangle, Geological Mapping, MESSENGER, MDIS.
Acknowledgements
This research has been supported by European Union’s Horizon 2020 under grant agreement N° 776276-PLANMAP.
References
Galluzzi et al. (2021), PGM Meeting 2021, LPI Contrib. No. 2610.
How to cite: El Yazidi, M., Tognon, G., Galluzzi, V., Giacomini, L., and Massironi, M.: Geology of the Eminescu (H-09) quadrangle: Mapping status, Europlanet Science Congress 2021, online, 13–24 Sep 2021, EPSC2021-682, https://doi.org/10.5194/epsc2021-682, 2021.
Introduction:
Thermal evolution studies of planet Mercury consistently predict that the heat flux at Mercury’s core-mantle boundary drops below the adiabatic heat flux early in Mercury’s evolution and thermally stratifies at least the outer part of Mercury’s core [1-3]. The deep dynamo explanation for Mercury’s broad-scale and low-intensity magnetic field suggests that a thick stratified liquid layer covers the convective dynamo region in Mercury’s core [4,5] and adds evidence that the top of Mercury’s core is stratified. In the simplest scenario that the liquid planetary core is well-mixed and that stratification of an upper liquid core layer is exclusively thermal in nature, the temperature profile satisfies the conduction equation in the stratified region of the core and it approaches the adiabat in the lower region of the core where heat fluxes are super-adiabatic.
Thermal evolution modelling of a core that is partly conductive and partly adiabatic involves a moving boundary problem in which the radius of the interface between the conductive region and the adiabatic region varies with time. One-dimensional thermal evolution models for the Earth have been performed that take thermal stratification into consideration by discretizing the core in many small spherically symmetric intervals [6]. For Mercury, Knibbe and van Westrenen (2018) have taken the development of a thermally stratified layer in consideration in a thermal evolution model [3]. They implemented a ‘steady-flux’ form of the temperature profile in the conductive region, by which we mean that they implemented the converged solution of the conduction problem where fluxes remain constant in time. This approach leads to a considerable numerical simplification, because discretizing the conductive part of the core is not needed. However, the approach is inconsistent with the time-variable fluxes that apply throughout Mercury’s evolution. We have recently improved the steady-flux approach of Knibbe and van Westrenen (2018) by the development of a numerical scheme that does not rely on the steady-flux assumption. Here, we present this method along with implications for Mercury’s thermal evolution.
Method:
We developed a ‘piece-wise steady-flux’ (PWSF) numerical scheme, which solves one-dimensional thermal conduction problems up to arbitrary precision with increase of spatial resolution. This numerical scheme assumes a steady flux form of temperature in each of the intervals, which is continuous and differentiable in radial direction. These smoothness properties are convenient for implementing the numerical scheme in an energy-conserved thermal evolution approach for Mercury’s core, in which a conductive thermally stratified layer is considered that develops below the core-mantle boundary when the heat flux drops below the adiabatic heat flux. If a single interval is used by the numerical scheme, the method is equivalent to the steady-flux approach of Knibbe and van Westrenen (2018).
Results:
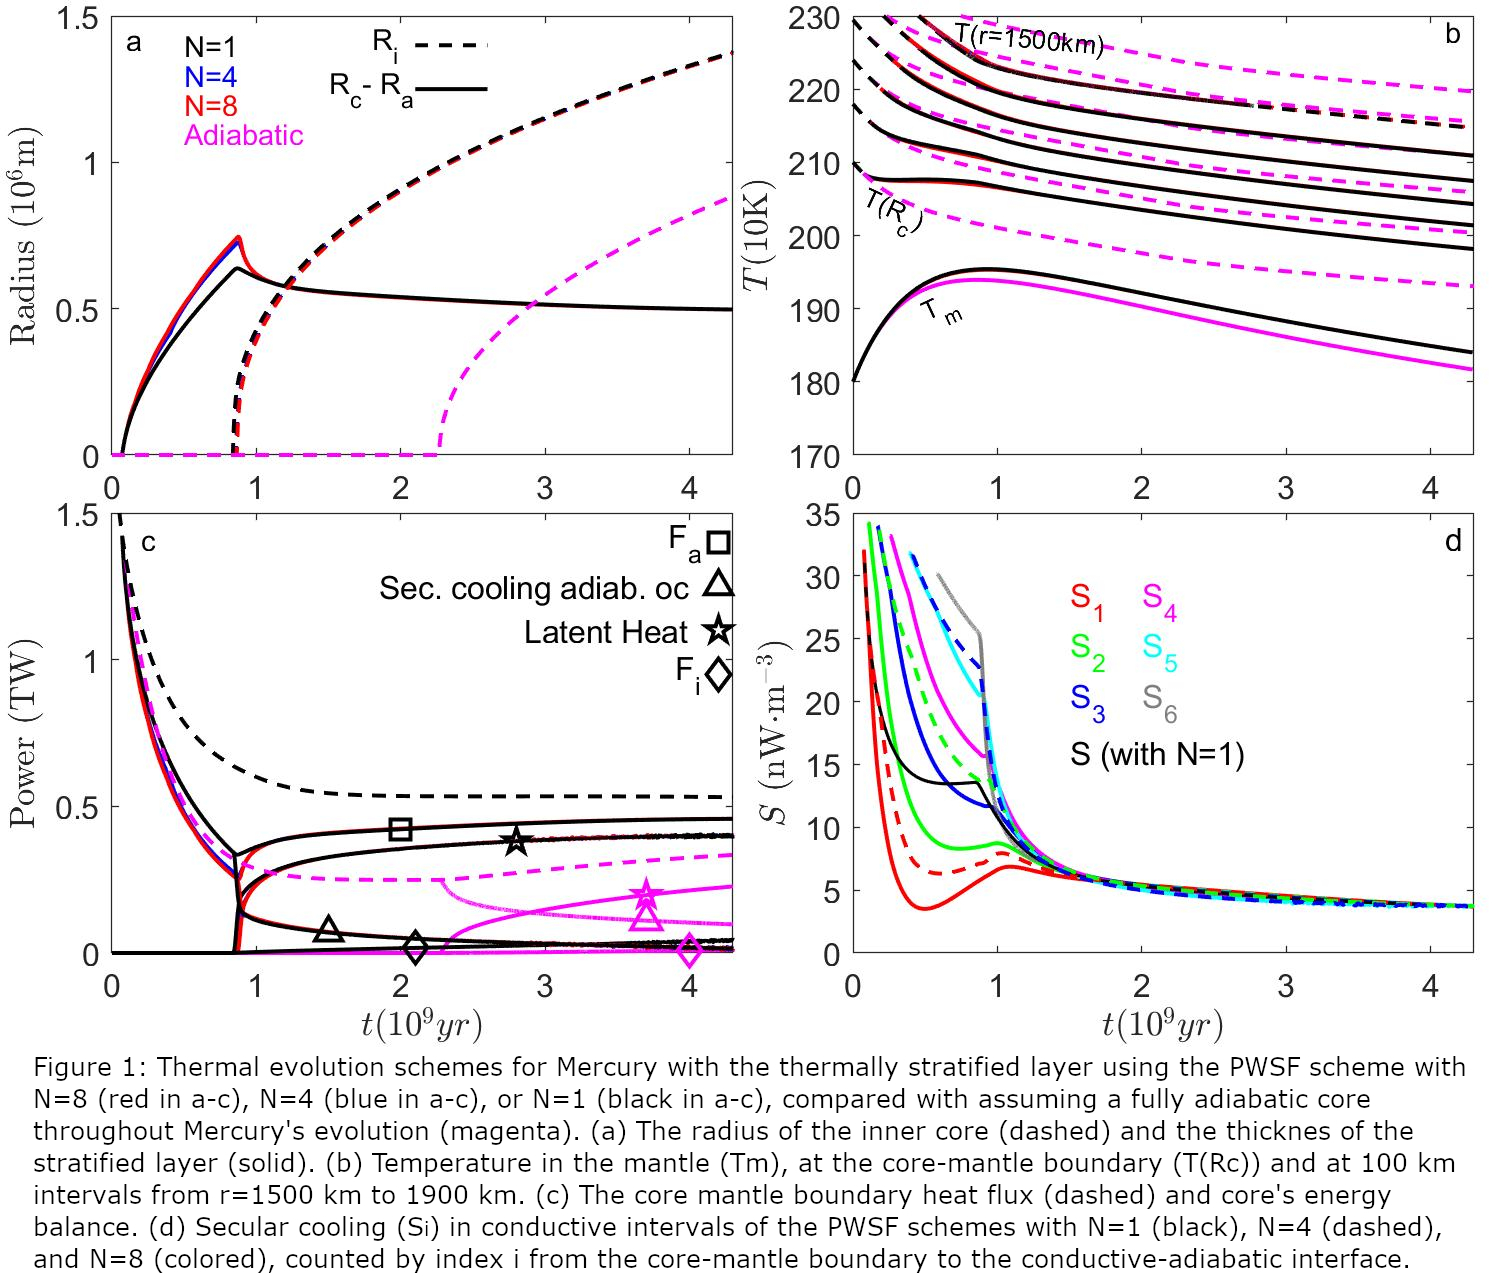
Figure 1 shows an example of a thermal evolution scheme for Mercury. The close similarity between the PWSF scheme with N=4 and that with N=8 (N being the number of adopted equal-volume intervals for the total core) indicates that N=4 is a sufficiently high resolution. For the PWSF scheme with N=1, the thermally stratified region of thickness Rc-Ra grows at a slightly lower rate compared to the PWSF scheme with higher resolution, but for the rest the N=1 scheme shows a very similar thermal evolution as compared to those with higher resolution. After heat fluxes are stabilized (figure 1c), which is in this scenario at about 1 billion years where the inner core (Ri) starts to form (figure 1a), the PWSF scheme with N=1 becomes even more consistent with the PWSF schemes that use higher resolution. The reason is that the radial variation of average secular cooling within the stratified region becomes negligible (figure 1d). The similarity between the PWSF schemes with N=1 and with higher resolution suggests that the steady-flux approach of Knibbe and van Westrenen (2018) is appropriate for studying Mercury’s thermal evolution.
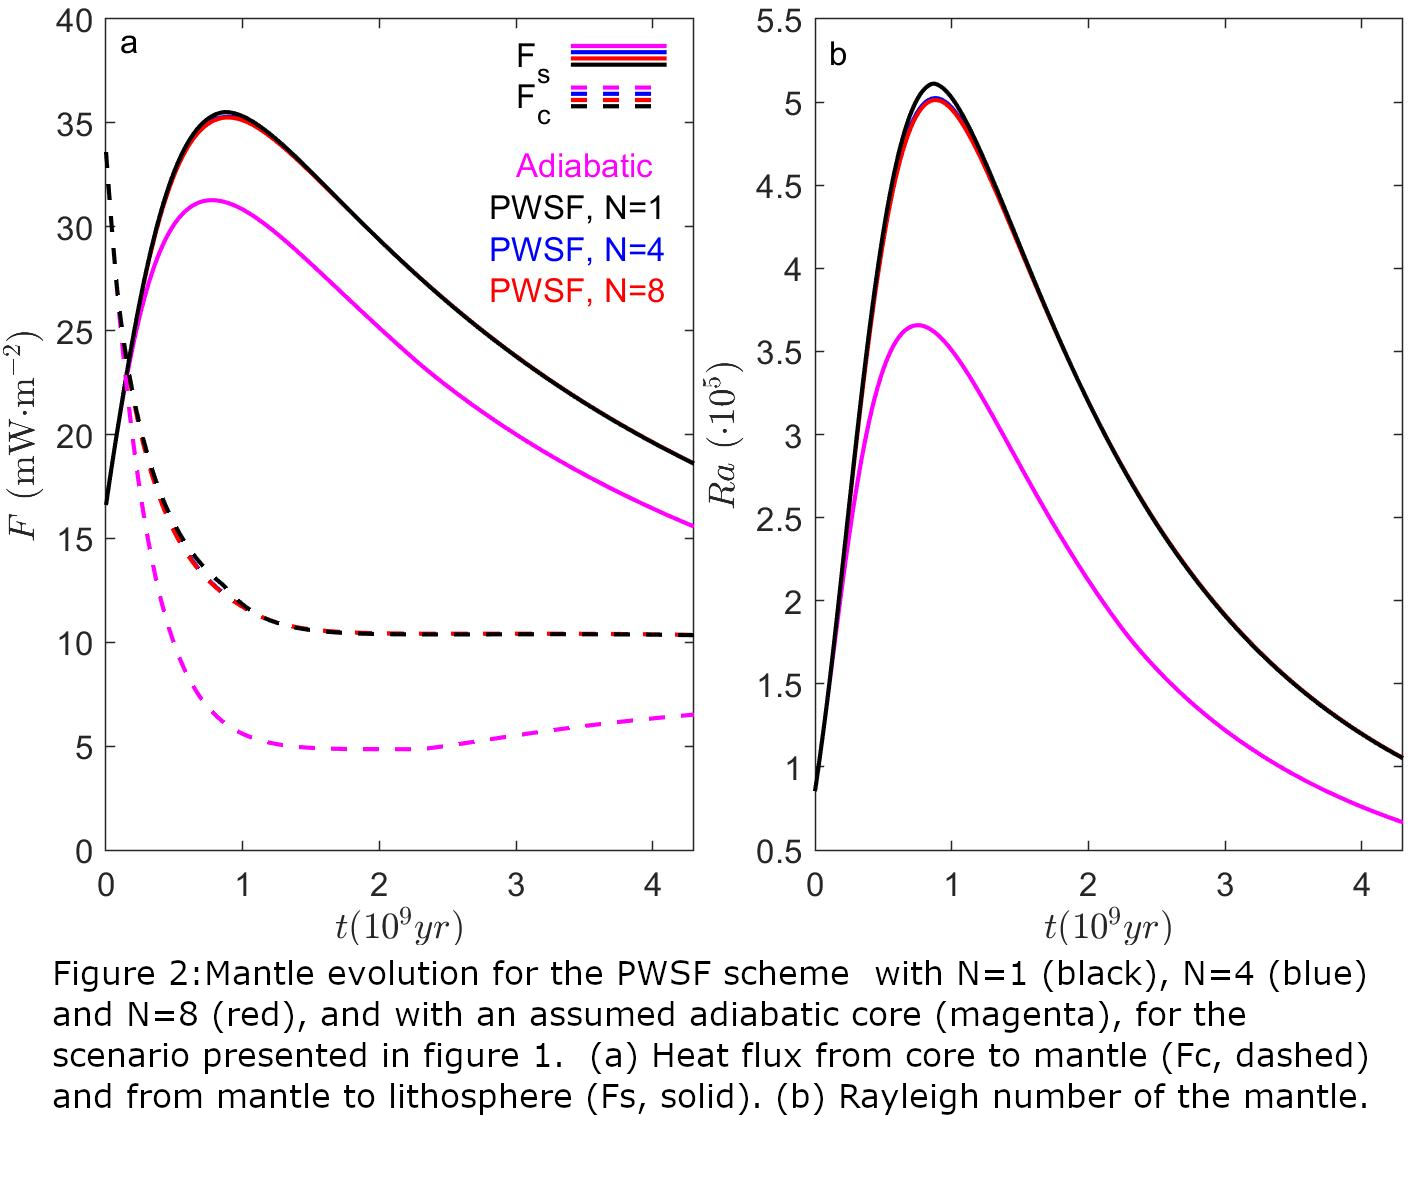
The implications of considering a thermally stratified layer in a thermal evolution model for Mercury are significant and cannot be neglected. By considering thermal stratification in a planetary core where the heat flux is lower than the adiabatic heat flux, radial variations in the cooling rate are accounted for whereas otherwise the distribution of energy in the core is fixed by the imposed adiabat. During the growth of the thermally stratified region to about 500 km in thickness (figure 1a), the deep part of the core cools more rapidly than the outer part of the core (figure 1b). Therefore, the inner core grows to a larger size (figure 1a) and the temperature and heat flux at the core-mantle boundary are higher and larger, respectively, if a thermally stratified region is considered (figure 1b and 1c). The higher heat flux into the mantle leads to a slightly higher mantle temperature (figure 1b) and higher heat flux through the silicate mantle. The latter is reflected by a larger heat flux into the lithosphere of Mercury (and larger heat flux out of the planet), and a higher Rayleigh number of the mantle (figure 2). These results indicate that the vigour and duration of mantle convection is underestimated if the evolution of a thermally stratified layer is not considered.
Details of the new thermal evolution model and of the consequences for Mercury’s thermal evolution will be presented in more detail at the conference.
[1] Stevenson D. J. et al. (1983) Icarus, 54(3), 466-489. [2] Tosi N. et al. (2013) JGR:Planets, 118(12), 2474-2487. [3] Knibbe J. S. and W. van Westrenen (2018), Earth Planet. Sci. Lett., 482, 147-159. [4] Christensen U. (2006), Nature, 444(7122), 1056-1058. [5] Takahashi et al. (2019) Nat. Comm., 10, 208. [6] Labrosse S. et al. (1997) Phys. Earth. Planet. Int., 99(1-2), 1-17.
How to cite: Knibbe, J. and Van Hoolst, T.: Modelling of thermal stratification at the top of Mercury’s core, Europlanet Science Congress 2021, online, 13–24 Sep 2021, EPSC2021-604, https://doi.org/10.5194/epsc2021-604, 2021.
We present a study conducted on a number of selected events characterised by a significant increase in the solar proton fluxes measured by FIPS-MESSENGER during the period 2011-2013. For each of them, the magnetic connection between Mercury and the solar corona (Source Surface Field @2.5 RS) has been reconstructed, in order to identify the possible source of the accelerated particles on the solar surface. The transport of the magnetic field lines in the heliosphere is here evaluated with a Monte Carlo code that computes a random displacement at each step of the integration along the Parker magnetic field model. Such displacement is proportional to a “local” diffusion coefficient, which is a function of the fluctuation level and magnetic turbulence correlation lengths. The simulation is tailored to the specific events by using the observed values of solar wind velocity and magnetic fluctuation levels.
How to cite: Ippolito, A., Plainaki, C., Zimbardo, G., Alberti, T., Massetti, S., Milillo, A., and Orsini, S.: Reconstruction of the magnetic connection from Mercury to the solar corona, during events in the solar proton fluxes observed by MESSENGER, Europlanet Science Congress 2021, online, 13–24 Sep 2021, EPSC2021-115, https://doi.org/10.5194/epsc2021-115, 2021.
Please decide on your access
Please use the buttons below to download the presentation materials or to visit the external website where the presentation is linked. Regarding the external link, please note that Copernicus Meetings cannot accept any liability for the content and the website you will visit.
Forward to presentation link
You are going to open an external link to the presentation as indicated by the authors. Copernicus Meetings cannot accept any liability for the content and the website you will visit.
We are sorry, but presentations are only available for users who registered for the conference. Thank you.
Please decide on your access
Please use the buttons below to download the presentation materials or to visit the external website where the presentation is linked. Regarding the external link, please note that Copernicus Meetings cannot accept any liability for the content and the website you will visit.
Forward to session asset
You are going to open an external link to the asset as indicated by the session. Copernicus Meetings cannot accept any liability for the content and the website you will visit.
We are sorry, but presentations are only available for users who registered for the conference. Thank you.

