
Frost on dark surfaces: Finding a possible link between spectrally blue spots and frost on the surface of comet 67P/Churyumov-Gerasimenko
 2,3,1,1
- 1Université Grenoble Alpes, CNRS, Institut de Planétologie et Astrophysique de Grenoble (IPAG), UMR 5274, Grenoble, France
- 2LESIA, Observatoire de Paris, Université PSL, CNRS, Université de Paris, Sorbonne Université, Meudon, France
- 3Institut Universitaire de France, Paris, France
During its two years of operation on the comet 67P/Churyumov-Gerasimenko (67P), the Rosetta/OSIRIS instrument had observed numerous bright spots on the comet surface, with flat spectra in the visible (VIS) range that indicates the presence of water ice or other volatiles [1][2][3]. Towards the end of the mission in June – September 2016, a number of bright spots with an unsual negative VIS slope were detected in shadowed areas. Similar to the "blue" spots, frost was only observed on comet 67P in the Hapi region prior to the 2015 perihelion [4] but more widespread on the comet surface after that [5]. This correlation prompts us to investigate frost at different thicknesses, in which we produce and measure frost with the use of the SHINE equipment in IPAG.
Frost is produced by exposing a cold sample holder covered in black tape to the open air, which allows atmospheric vapor to condense on top. The sample holder can be cooled simultaneously with frost disposition via liquid nitrogen; or it can be placed inside a sealed cold chamber e.g. a freezer, and the frost condensation occurs after removing the sample holder from the cold chamber and results in the formation of porous "needles" structures. After frost production, the sample holder is transferred inside the pre-cooled SHINE chamber in order to obtain spectra. The inner chamber is kept at approximately 200 K and atmospheric level pressure throughout each acquisition in order to stabilize the frost, and frost thickness can be reduced by operating the vacuum pump for a few minutes. All measurements are conducted with the same observational geometry: incidence i = 0, emergence e = 30° and azimuth a = 0.
Our spectra feature show absorption bands at approximately 1.5 µm, 2 µm and 3 µm and also 1.65 µm in thicker frost samples (see Fig. 1). The water bands deepen with increasing frost thickness, in which the ~3 µm band is the first to appear with very thin frost layer (Fig. 1b) due to its highest sensitivity to water ice presence [6] and reaches saturation as soon as the frost layer is thick enough for the other two bands at 1.5 µm and 2 µm to appear. The Fresnel peak at ~3.1 µm is present in all spectra (except for the "pure" black tape"), indicating that the produced frost is composed of crystalline ice whose grain size is at least a few microns [7]. The ~1.65 µm peak is also a crystalline ice indicator, and its weak presence in our spectra can be explained by its high susceptiblity to temperature [8].
Fig. 1 also shows that frost becomes more spectrally blue in the VIS range with increasing thickness, where the thickest frost specimen (Fig. 1a) has a linear-fitted slope of -3.36%/ (100 nm) in the 540 – 880 nm range, similar to a few "blue" spots on the comet whose spectral slope value is approximately -3%/ (100 nm) in the 535 – 882 nm range. A possible explanation for the blue VIS slope is the presence of very large water ice grain i.e. mm-sized or larger, as shown in simulated water ice spectra by Hapke modelling [9]. These results appear to support our hypothesis that frost could be a possible cause of the spectrally blue bright spots, and future experiments will seek to investigate the aforementioned matter further.
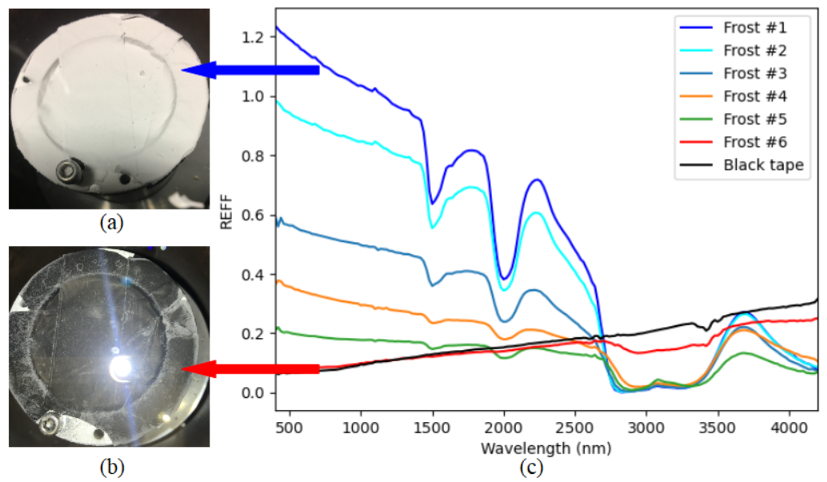
Fig. 1: The image of a thick frost sample (a) and a thin frost sample (b) inside the SHINE chamber prior to measurement, alongside the spectra of frost at different thicknesses (c). The (a) and (b) samples correspond to the dark blue line and red line, respectively
References: [1] Barucci et al., 2016, A&A 595, A102; [2] Oklay et al., 2017, MNRAS 469, S582–S597; [3] Deshapriya et al., 2018 A&A 613, A36; [4] De Sanctis et al., 2015, Nature 525, 500–503; [5] Fornasier et al., 2016, Science 354, 1566; [6] Clark & Lucey., 1984, JGR 89, 6341-6348; [7] Hansen & McCord., 2004, JGR 109, E01012; [8] Grundy et al., 1999, Icarus 142, 536–549 (1999); [9] Raponi et al., 2016, MNRAS 462, S476–S490
How to cite: Hoang, H. V., Quirico, E., Fornasier, S., Poch, O., Beck, P., and Schmitt, B.: Frost on dark surfaces: Finding a possible link between spectrally blue spots and frost on the surface of comet 67P/Churyumov-Gerasimenko, European Planetary Science Congress 2021, online, 13–24 Sep 2021, EPSC2021-261, https://doi.org/10.5194/epsc2021-261, 2021.