Temporal variations in vertical haze distribution of Jupiter’s Great Red Spot and its surroundings from HST/WFC3 imaging & dynamical interactions with incoming vortices in 2021
- 1Universidad del País Vasco UPV/EHU, Física Aplicada I, Bilbao, Spain (asier.anguiano@ehu.eus)
- 2Dpto. Ciencias Experimentales, Universidad Europea Miguel de Cervantes, Valladolid, Spain
- 3Dpto. Física Teórica, Atómica y Óptica, Universidad de Valladolid, Valladolid, Spain
- 4Department of Physics, Atmospheric, Oceanic and Planetary Physics, University of Oxford, Oxford, UK
An important unknown concerning Jupiter’s Great Red Spot (GRS) is the composition and origin of the chromophore species that provide its reddish color, which is closely related to the vertical hazes and upper cloud structure. A chromophore-candidate was proposed by Carlson et al. (2016), in which the short-wavelength absorbing compound is the result of photolyzed ammonia reacting with acetylene. Sromovsky et al. (2017) suggested that this coloring agent could act as “universal chromophore”, i.e., this single chromophore could account for all of the different colorations in the Jovian atmosphere. As far as dynamics are concerned, the GRS became the subject of discussion in 2019, when it interacted with a number of smaller vortices that were able to detach material from its reddish oval. Sánchez-Lavega et al. (2021) concluded that this phenomenon was only affecting the upper cloud-tops of the GRS, and that the intense vorticity, large size and deep structure of the GRS are factors that prevent its destruction.
In this work, we analyze high spatial resolution images taken with the Wide Field Camera 3 onboard the Hubble Space Telescope corresponding to the period between 2015 and 2021. Images were taken in 11 different filters, with a spectral range spanning from UV to near infrared wavelengths, and two filters matching two methane absorption bands of different depths. These images have been calibrated in absolute reflectivity, and from them we have obtained the spectral brightness of the GRS and its surroundings, focusing on selected dynamical regions. An important advantage of this set of filters is that they are sensitive to the particle vertical distribution in the upper troposphere and lower stratosphere of Jupiter.
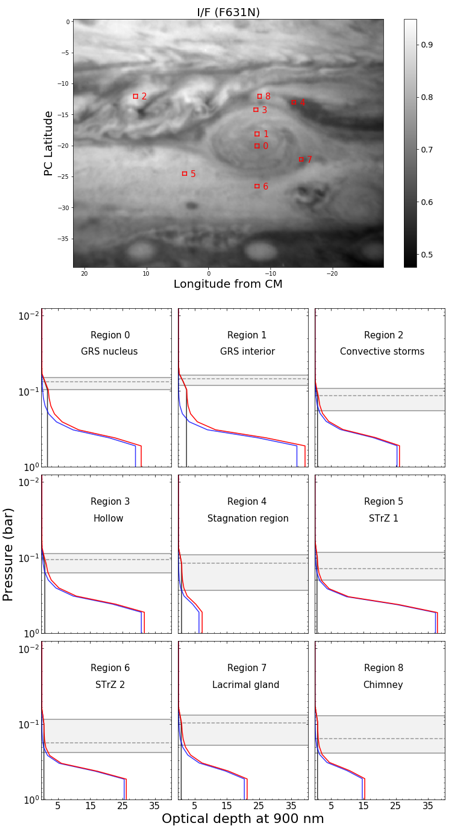
From the calibrated images, spectra corresponding to different viewing geometries are constructed for each of the studied regions. Such spectra have been analyzed with the NEMESIS radiative transfer suite (Irwin et al., 2008) to retrieve a number of key atmospheric features (e.g., particle vertical and size distributions, refractive indices, optical thickness…). In order to start from an objective a priori atmospheric model, we run a grid of almost 12,000 different models to fit STrZ spectra corresponding to images taken in December 2016. We choose as optimal the model presenting the best simultaneous fit of both the measured spectra and the observed limb-darkening. In Figure 1, we show the regions analyzed in December 2016 together with the retrieved accumulated optical depths for each region.

Figure 1. Upper panel shows the selected regions in December 2016. Lower panel shows the retrieved accumulated optical depth as a function of pressure. The black, blue and red lines represent the stratospheric, tropospheric and total aerosol optical depths, respectively. The upper and lower grey lines mark the τaer=0.5 and τaer=2 pressure levels. The dashed line marks the τaer=1 pressure level.
Our main results concerning the vertical haze distribution in the GRS area are as follows:
- Independently from temporal or spatial region-to-region variations, we retrieve a model with two main layers: a stratospheric haze with its base near the tropopause and optical depths of the order of unity, and an optically thick (τ(900 nm) ̴ 10) tropospheric haze that extends down to 500 mbar with micron sized particles.
- Both the stratospheric and tropospheric hazes show a short wavelength absorbing nature, but with clearly distinct imaginary refractive indices, and thus our work suggests the presence of two different chromophores.
- For the stratospheric haze, we retrieve imaginary refractive indices that seem to be compatible with the ones corresponding to the chromophore agent proposed by Carlson et al. (2016).
- We have quantified the temporal evolution in the vertical cloud distribution of clouds and hazes in the GRS area.
As occurred in 2019-20, during the present campaign the GRS is undergoing several interactions with smaller vortices. We also present here measurements of the wind fields in the GRS and the surrounding area and other dynamical considerations before, during and after the interactions, following our recently published study Sánchez-Lavega et al. (2021).
References
- Carlson, R.W., Baines, K.H., Anderson, M.S., Filacchione, G., & Simon, A.A. (2016). Chromophores from photolyzed ammonia reacting with acetylene: Application to Jupiter’s Great Red Spot. Icarus, 274, 106-115.
- Irwin, P.G.J., Teanby, N.A., de Kok, R., Fletcher, L.N., Howett, C.J.A., Tsang, C.C.C., Wilson, C.F., Calcutt, S.B., Nixon, C.A., & Parrish, P. D. (2008). The NEMESIS planetary atmosphere radiative transfer and retrieval tool. J. of Quant. Spec. and Radiative Transfer, 109 , 1136-1150.
- Sánchez‐Lavega, A., Anguiano‐Arteaga, A., Iñurrigarro, P., Garcia‐Melendo, E., Legarreta, J., Hueso, R., et al. (2021). Jupiter’s Great Red Spot: Strong interactions with incoming anticyclones in 2019. J. Geophys. Res. Planets, 126, e2020JE006686.
How to cite: Anguiano-Arteaga, A., Pérez-Hoyos, S., Sánchez-Lavega, A., Sanz-Requena, J. F., and Irwin, P.: Temporal variations in vertical haze distribution of Jupiter’s Great Red Spot and its surroundings from HST/WFC3 imaging & dynamical interactions with incoming vortices in 2021, European Planetary Science Congress 2021, online, 13–24 Sep 2021, EPSC2021-271, https://doi.org/10.5194/epsc2021-271, 2021.

