Europlanet Science Congress 2021
Virtual meeting
13 – 24 September 2021
Europlanet Science Congress 2021
Virtual meeting
13 September – 24 September 2021
OPS5
Aerosols and clouds in planetary atmospheres

OPS5

Aerosols and clouds in planetary atmospheres
Co-organized by TP/EXO
Convener: Panayotis Lavvas | Co-conveners: Nathalie Carrasco, Anni Määttänen
Thu, 23 Sep, 15:10–15:55 (CEST)

Session assets

Discussion on Slack

Oral and Poster presentations and abstracts

Chairpersons: Panayotis Lavvas, Nathalie Carrasco, Anni Määttänen
Laboratory Studies
EPSC2021-469
|
solicited
Ella Sciamma-O'Brien, Erika Barth, Tanguy Bertrand, Jason Cook, Dale Cruikshank, Cristina Dalle Ore, David Dubois, Will Grundy, Laura Iraci, Rachel Mastrapa, Ted Roush, Farid Salama, and Sandrine Vinatier and the NASA Center for Optical Constants (NCOC) Team

Clouds and hazes play a major role in (exo)planetary atmospheres. They can absorb and reflect light from UV to thermal infrared wavelengths, changing the atmospheric emission, reflection, and transmission spectra dramatically. The organic aerosols forming the haze can act as cloud condensation nuclei. Then can also settle down onto the surface, hence participating in its composition. Dedicated laboratory experiments have been developed to produce solid materials that are analogs of haze and cloud particles, under different experimental conditions (molecular precursors, temperature, pressure, energy source…). These experimental studies are key to investigating the physical and chemical processes that drive the formation of solid particles from gas and solid phase molecular precursors in planetary environments. These experiments also allow the characterization of the physical, optical and chemical properties of the laboratory-generated haze and cloud particle analogs, hence providing critical information that can be used as input parameters in models for the analysis and interpretation of observational data (e.g. optical constants, vapor pressures, spectral features, grain morphology, etc).

Here, as examples of these laboratory efforts, we will present various studies that combine (1) experiments performed to produce analogs of Titan and Pluto atmospheric aerosols from gas phase molecular precursors, (2) experiments conducted to simulate the formation of benzene ice cloud particles in Titan’s stratosphere, and (3) experiments carried out to characterize the haze and cloud particle analogs to provide, in particular, optical constants and vapor pressures. We will show how important these studies are for the interpretation of observational data from past, current and future (exo)planetary missions. We will also introduce the newly funded NASA Center for Optical Constants whose overarching goal is to support a stable, long-term, synergistic laboratory effort to address a critical need throughout the broader planetary science community for the development of a comprehensive database containing complex refractive indices (optical constants) of laboratory-generated analogs of organic refractory materials, and ices present in planetary atmospheres and surfaces.

How to cite: Sciamma-O'Brien, E., Barth, E., Bertrand, T., Cook, J., Cruikshank, D., Dalle Ore, C., Dubois, D., Grundy, W., Iraci, L., Mastrapa, R., Roush, T., Salama, F., and Vinatier, S. and the NASA Center for Optical Constants (NCOC) Team: On the Importance of Producing and Characterizing Laboratory Analogs of Planetary Atmospheric Aerosols and Clouds and Their Use to Interpret Observations, Europlanet Science Congress 2021, online, 13–24 Sep 2021, EPSC2021-469, https://doi.org/10.5194/epsc2021-469, 2021.

EPSC2021-491
|
ECP
Zoé Perrin, Nathalie Carrasco, Audrey Chatain, Lora Jovanovic, Nathalie Ruscassier, Ludovic Vettier, and Guy Cernogora
  • Introduction

Titan, Saturn's largest moon, has a thick nitrogen-based atmosphere, where during its flyby, the IRIS infrared spectrometer aboard the Voyager 1 spacecraft detected nitriles, such as HCN, formed by EUV photochemistry based on methane CH4 and molecular nitrogen N2. Titan is also surrounded by an organic photochemical haze, according to the observations of the Cassini-Huygens and Voyager 1 missions.

In-situ measurements by the Huygens spacecraft [1], and laboratory experiments synthesizing Titan analog aerosols (called tholins), have revealed that HCN is one of the major chemical signatures extracted from the aerosols, and their laboratory analogues.

Laboratory experiments were conducted using a powder plasma reactor mimicking Titan's ionosphere, replicating the formation of Titan-like organic aerosols, and the associated chemistry. In this work, we simultaneously study the temporal evolution of HCN present in the gas phase, and the formation and growth of Titan tholins.


  • 1 - Aerosol production

Analogues of Titan aerosols are formed using the experiment PAMPRE [4]. PAMPRE is a reaction chamber, where a cold radiofrequency plasma capacitively coupled is ignited at low pressure (~0.9 mbar). A gas mixture of 95% N2 and 5% CH4 is introduced into the reactor. Subsequently, a 12W discharge is generated between two electrodes, which ionizes the N2 and CH4 present.

In this plasma, the radicals and products formed by ionization of methane and nitrogen, will combine by several reaction pathways, to form more complex organic particles and nitriles such as HCN, in the same way as in the ionosphere of Titan.

In this study, the gas flow rate was optimized, to increase the residence time of the gas mixture in the reactor as much as possible. The chemical growth of the solid particles is thus favored, allowing to follow simultaneously the formation and the evolution of the particles, as well as the co-evolution of the gas mixture composition.


  • 2 - Morphology analysis of tholins by scanning electron microscopy

The formed samples were observed by scanning electron microscopy (SEM field emission gun).

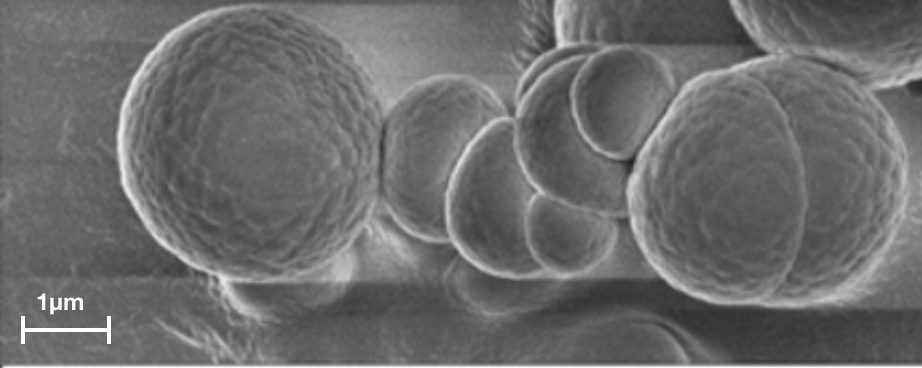
Figure 1 - SEM picture of Titan tholins obtained after 160 s in the discharge

The images show primary nanometer monomers coagulated and formed aggregates (Figure 1). These aggregates continue to evolve to form single spherical particles of ~1.5 µm in diameter (Figure 1). These experimental results are in agreement with the evolution predicted by the model [2] on aerosols residing in the atmosphere of Titan.

  • 3 - Chemical analysis of tholins by infrared spectroscopy

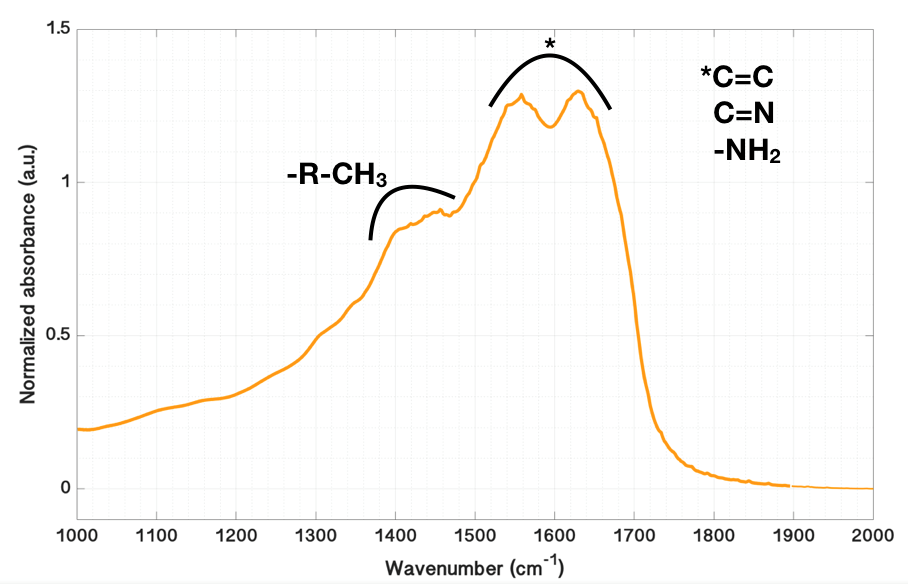
Absorbance measurement is performed using an FTIR, on pellets composed of ~ 99.6% KBr and ~ 0.4% tholins. Three absorption bands stand out on the mid-infrared absorption spectrum. In particular, the intense bands at 1560 cm-1 and 1630 cm-1 (Figure 2) which correspond to different functional groups, such as aromatic or aliphatic -NH2, C=N, C=C, aromatic or heteroaromatic groups, difficult to distinguish from each other. The presence of these nitrogenous aromatic compounds can be promoted by HCN [3] [5].

Figure 2 - Normalized IR spectra showing the aromatic or aliphatic groups bands


  • 4 - Conclusions and Perspectives

The growth of the particles could be observed by the SEM analysis. Moreover, the IR analysis shows the presence of nitrogenous chemical bonds, corresponding to aromatic compounds or nitrile. This growth may be due to the incorporation of HCN chemistry on the surface of the tholins. Indeed, MS analysis of the gas phase shows a progressive consumption of HCN during the formation and growth of  Titan tholins. Our experimental results are consistent with numerical models based on Cassini-Huygens observations: A formation of atmospheric HCN on Titan, and its efficient incorporation in Titan’s haze to produce large organic polymers.

References

[1] Israël G. et al., Nature 438 : 796-99 (2005).

[2] Lavvas P. et al., The Astrophysical Journal (2011).

[3] Imanaka H. et al., Icarus, 168: 344-66 (2004).

[4] Szopa C. et al., Planetary and Space Science 54 (2006).

[5] Gautier T. et al., Icarus, 221, 320-327 (2012).

How to cite: Perrin, Z., Carrasco, N., Chatain, A., Jovanovic, L., Ruscassier, N., Vettier, L., and Cernogora, G.: An atmospheric origin for HCN-derived polymers on Titan, Europlanet Science Congress 2021, online, 13–24 Sep 2021, EPSC2021-491, https://doi.org/10.5194/epsc2021-491, 2021.

Photochemical Hazes
EPSC2021-391
|
ECP
|
solicited
Kazumasa Ohno, Xi Zhang, Ryo Tazaki, and Satoshi Okuzumi

Abstract

 Aerosols are ubiquitous in planetary atmospheres in solar and extrasolar systems. Since aerosols greatly impact atmospheric thermal structures and observations, it is vital to understand how they form in a variety of environments. Here, we investigate photochemical haze formation on Triton---the largest moon of Neptune---using a detailed microphysical model. We found that simulated haze profiles without condensation of C2H4 ices hardly explain both UV and visible observations of Voyager 2 simultaneously, while icy haze models can reasonably explain the observations. Thus, condensation of hydrocarbon ice likely plays vital roles in the haze formation on Triton. Our study highlights the importance of condensation physics in haze formation, which has often been neglected in modeling studies, especially for exoplanetary hazes.

Introduction

Aerosols are universally present in atmospheres on solar system planets. Recent observations also suggest that photochemical hazes are ubiquitous even in the extrasolar planets (e.g., Sing et al. 2016, Crossfield & Kreidberg 2017). Because the hazes significantly impact on atmospheric energy balance (e.g., Zhang et al. 2017) as well as the observability of atmospheres (e.g., Lavvas & Koskinen 2017, Kawashima & Ikoma 2018, Gao & Zhang 2020, Ohno & Kawashima 2020), it is crucial to figure out how they form in a variety of environments. To this end, solar system objects provide a great opportunity to study the haze formation process thanks to abundantly available observations. Titan, Pluto, and Triton are typical solar system objects that possess hazy atmospheres. For Titan and Pluto, haze formation processes have been studied by microphysical models (e.g., Lavvas et al. 2010, 2020, Gao et al. 2017). For Triton, however, the haze formation process has not been investigated in detail since the discovery of near-surface haze layer during the Voyager 2 flyby 1989. 

Methods

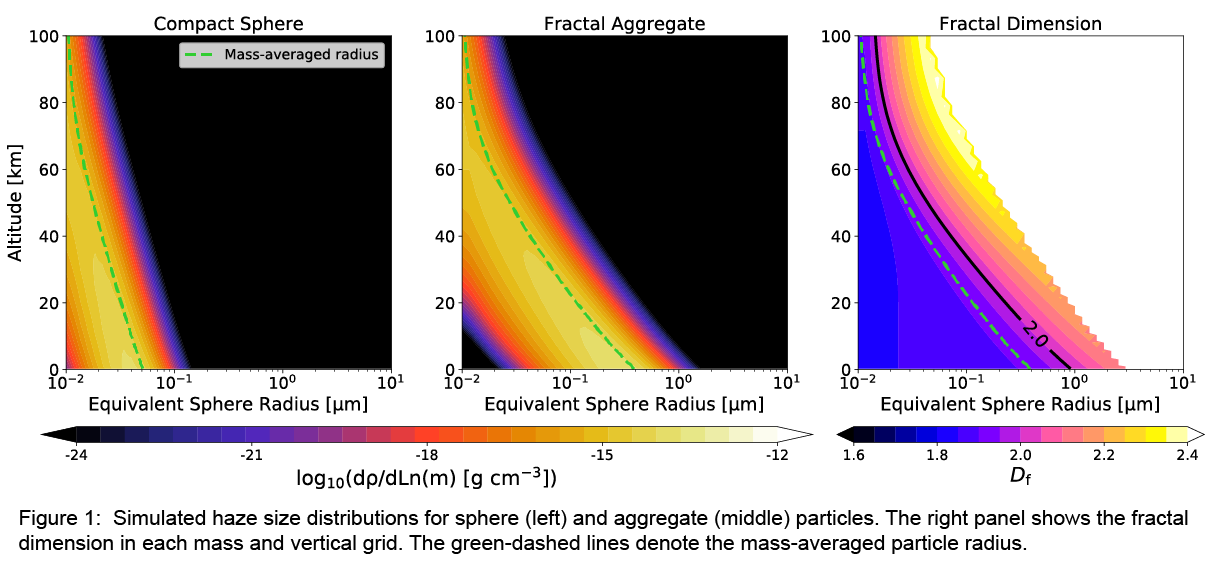
We have developed a new microphysical model to study the haze formation on Triton (Ohno et al. 2021). Our model simulates the evolution of both size and porosity distributions of haze particles in a self-consistent manner without assuming a specific fractal dimension (Figure 1). We compare the simulated haze profiles with those constrained by Voyager’s observations of solar occultation in UV and scattered lights in visible (Herbert & Sandel 1991, Rages & Pollack 1992). We investigate several possible nature of Triton’s haze, namely spherical and non-spherical particles with and without condensation of C2H4 ice. 

Results and Discussion

Ice-free hazes, usually assumed for Titan, Pluto, and exoplanet hazes, cannot simultaneously explain both visible and UV observations of Triton’s hazes. This is because spherical hazes hardly grow into sufficiently large sizes, and aggregate hazes have low single scattering albedo with optical constants of Titan’s haze analog. We suggest that condensation of C2H4 ice onto haze particles can remedy the model-observation discrepancy by altering haze material properties, such as density and optical constants. Both ice sphere and ice aggregate models reasonably explain the existing observations of Voyager 2 (Figure 2) when the haze mass flux is comparable to the column-integrated photolysis rate of CH4. Future Triton missions with wider wavelength coverage and phase angles would be able to disentangle these two scenarios. Our results suggest the potential importance of haze-cloud interaction, which has been often neglected in modeling studies. We will also discuss the implication of haze microphysics studied here to interpret observations of exoplanetary atmospheres.

How to cite: Ohno, K., Zhang, X., Tazaki, R., and Okuzumi, S.: Microphysics of Haze Formation on Triton, Europlanet Science Congress 2021, online, 13–24 Sep 2021, EPSC2021-391, https://doi.org/10.5194/epsc2021-391, 2021.

EPSC2021-126
|
ECP
Anthony Arfaux and Panayotis Lavvas

Photochemical hazes are expected to be present in exoplanet atmospheres with quantities spanning a large range of values, from quasi-non-detectable traces in clear atmospheres, to large amounts dramatically modifying their environment. Our purpose is to determine the properties of these haze particles in hot- Jupiters’ atmosphere.

We first calculate thermochemical abundances (Gordon & McBride, 1994) and haze distributions from a microphysics model (Lavvas & Koskinen, 2017), using clear-atmosphere temperature profiles (Sing et al., 2016). This allows to derive the theoretical spectrum that can be be confronted to the observations to determine the best couple of parameters defining the haze production. These best-fitting parameters are then used in a disequilibrium chemistry (Lavvas et al., 2014) and microphysics model, providing a more detailed picture of the atmosphere. The calculated chemical and haze distributions allow for the evaluation of a new temperature profile (Lavvas & Arfaux, 2021) for each planet which can be used in the disequilibrium chemistry model. This process is repeated until the model is converged providing a self-consistent picture of the atmosphere.

Disequilibrium chemistry accounts for transport of species through the atmosphere as well as their interactions with the radiation field. The implications of these effects are revealed by comparing the thermochemical equilibrium abundances with those derived by the disequilibrium model. Chemical distributions basically show larger mixing ratios between 1e-2 and 1e-6 bar compared to thermochemical equilibrium and lower mixing ratios above 1e-6 bar altitude related to the destruction of molecules through photolysis (Fig. 1). These modifications of the chemical composition do not have significant impact on the calculated transit spectra (Fig. 2) considering the resolution and precision of the observations and the still small abundances of the modified species. Water, that has a major signature on the transit spectra is modified above 1e-6bar, in a region that is not affecting by the observations. However, the disequilibrium chemistry allows for the calculation of the mass flux from the photolysis of species considered as haze precursors, thus providing additional constraints to assess the realisticity of the haze production parameters retrieved from thermochemical equilibrium.
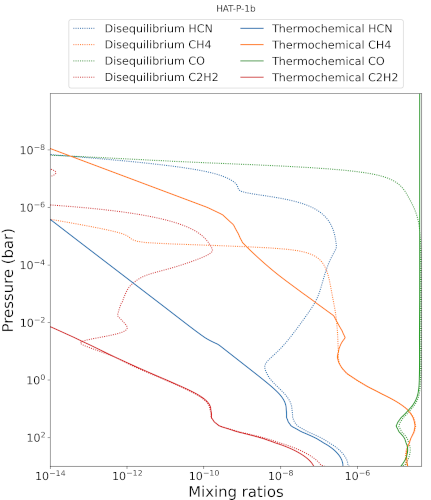
 

Fig.1: Haze precursors mixing ratio comparison between thermochemical and disequilibrium abundances.
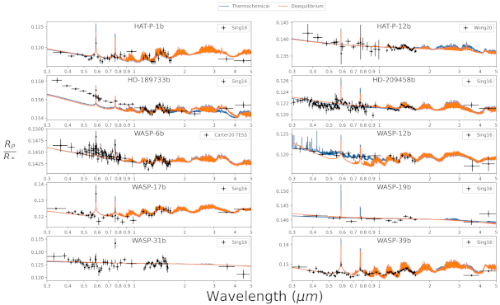
 

Figure 2: Transit spectra obtained from thermochemical equilibrium (blue line) and disequilibrium chemistry (orange line) compared to observations (black crosses) from Sing et al. (2016); Wong et al. (2020); Carter et al. (2020)


Disequilibrium composition gases and haze opacities have major impact on the temperature profile (Lavvas & Arfaux, 2021) which, in turn, has a large influence on the chemical composition and haze growth. These feedback effects are investigated through a self-consistent model coupling temperature, haze and chemical profiles calculation. Results show a clear trend for the increase of temperature under the influence of haze heating (Fig. 3), which has further ramifications on chemistry and haze profiles.

Figure 3: Self-consistently derived temperature profiles (dotted lines) and initial haze-free temperature profiles (solid line) from Sing et al. (2016) for HD- 189733b (left panel) and WASP-6b (right panel). The horizontal black lines corresponds to the radiative/convective boundaries.


These modifications in the atmospheric chemical and microphysics composition have a major impact on the transit spectra, with the most important feature being the increase of the atmospheric scale height due to the higher temperatures, thus yielding a larger transit depth. This last effect can thus enhance the steepness of the UV-visible slope observed in the spectra (Fig. 4) and decreases the requirement for a strong haze mass flux. These results demonstrate the need for a self-consistent description of haze interaction with the atmosphere.

Figure 4: Disequilibrium (red line) and self-consistent (blue line) theoretical spectra compared to observations (black crosses).


References

Figure 4: Disequilibrium (red line) and self-consistent (blue line) theoretical spectra compared to observations (black crosses).

Carter, A. L., Nikolov, N., Sing, D. K., Alam, M. K., Goyal, J. M., Mikal-Evans, T., Wakeford, H. R., Henry, G. W., Morrell, S., Lòpez-Morales, M., Smalley, B., Lavvas, P., Barstow, J. K., Garcìa Mun ̃oz, A., Gibson, N. P., & Wilson, P. A. (2020). Detection of Na, K, and H2O in the hazy atmosphere of WASP-6b. Monthly Notices of the Royal Astronomical Society, 494(4), 5449–5472.

Gordon, S., & McBride, B. J. (1994). Computer Program for Calculation of Complex Chemical Equilibrium Compositions and Applications I. Analysis. National Aeronautics and Space Administration (NASA).

Lavvas, P., & Arfaux, A. (2021). Impact of photochemical hazes and gases on exoplanet atmospheric thermal structure. Monthly Notices of the Royal Astronomical Society, 502(4), 5643–5657.

Lavvas, P., & Koskinen, T. (2017). Aerosol properties of the atmospheres of extrasolar giant planets. The Astronomical Journal, 847.

Lavvas, P., Koskinen, T., & Yelle, R. V. (2014). Electron densities and alkali atoms in exoplanet atmospheres. arXiv e-prints, (p. arXiv:1410.8102).

Sing, D. K., Fortney, J. J., Nikolov, N., Wakeford, H. R., Kataria, T., Evans, T. M., Aigrain, S., Ballester, G. E., Burrows, A. S., Deming, D., Désert, J.-M., Gibson, N. P., Henry, G. W., Huitson, C. M., Knutson, H. A., Lecavelier Des Etangs, A., Pont, F., Showman, A. P., Vidal-Madjar, A., Williamson, M. H., & Wilson, P. A. (2016). A continuum from clear to cloudy hot-Jupiter exoplanets without primordial water depletion. Nature, 529.

Wong, I., Benneke, B., Gao, P., Knutson, H. A., Chachan, Y., Henry, G. W., Deming, D., Kataria, T., Lee, G. K. H., Nikolov, N., Sing, D. K., Ballester, G. E., Baskin, N. J., Wakeford, H. R., & Williamson, M. H. (2020). Optical to near-infrared transmission spectrum of the warm sub-saturn hat-p-12b. The Astronomical Journal, 159(5).

How to cite: Arfaux, A. and Lavvas, P.: Study of photochemical hazes in exoplanet atmospheres: disequilibrium chemistry effects and haze feedback, Europlanet Science Congress 2021, online, 13–24 Sep 2021, EPSC2021-126, https://doi.org/10.5194/epsc2021-126, 2021.

EPSC2021-271
|
ECP
Asier Anguiano-Arteaga, Santiago Pérez-Hoyos, Agustín Sánchez-Lavega, José Francisco Sanz-Requena, and Patrick Irwin

An important unknown concerning Jupiter’s Great Red Spot (GRS) is the composition and origin of the chromophore species that provide its reddish color, which is closely related to the vertical hazes and upper cloud structure. A chromophore-candidate was proposed by Carlson et al. (2016), in which the short-wavelength absorbing compound is the result of photolyzed ammonia reacting with acetylene. Sromovsky et al. (2017) suggested that this coloring agent could act as “universal chromophore”, i.e., this single chromophore could account for all of the different colorations in the Jovian atmosphere. As far as dynamics are concerned, the GRS became the subject of discussion in 2019, when it interacted with a number of smaller vortices that were able to detach material from its reddish oval. Sánchez-Lavega et al. (2021) concluded that this phenomenon was only affecting the upper cloud-tops of the GRS, and that the intense vorticity, large size and deep structure of the GRS are factors that prevent its destruction.

In this work, we analyze high spatial resolution images taken with the Wide Field Camera 3 onboard the Hubble Space Telescope corresponding to the period between 2015 and 2021. Images were taken in 11 different filters, with a spectral range spanning from UV to near infrared wavelengths, and two filters matching two methane absorption bands of different depths. These images have been calibrated in absolute reflectivity, and from them we have obtained the spectral brightness of the GRS and its surroundings, focusing on selected dynamical regions. An important advantage of this set of filters is that they are sensitive to the particle vertical distribution in the upper troposphere and lower stratosphere of Jupiter.

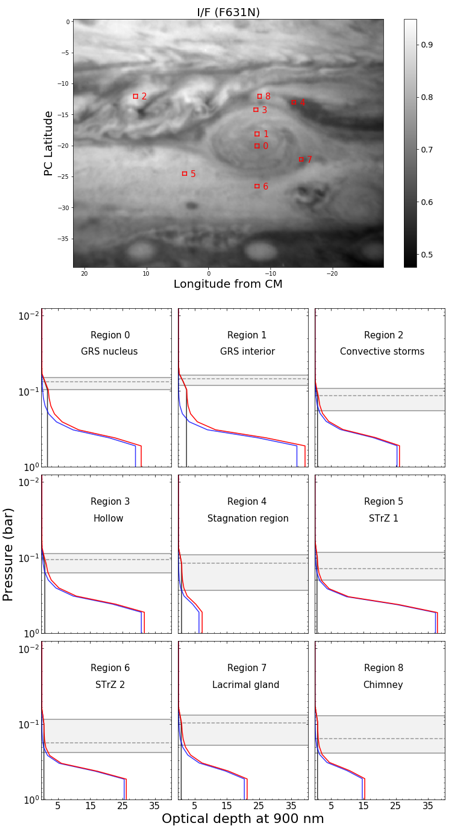
From the calibrated images, spectra corresponding to different viewing geometries are constructed for each of the studied regions. Such spectra have been analyzed with the NEMESIS radiative transfer suite (Irwin et al., 2008) to retrieve a number of key atmospheric features (e.g., particle vertical and size distributions, refractive indices, optical thickness…). In order to start from an objective a priori atmospheric model, we run a grid of almost 12,000 different models to fit STrZ spectra corresponding to images taken in December 2016. We choose as optimal the model presenting the best simultaneous fit of both the measured spectra and the observed limb-darkening. In Figure 1, we show the regions analyzed in December 2016 together with the retrieved accumulated optical depths for each region.


Figure 1. Upper panel shows the selected regions in December 2016. Lower panel shows the retrieved accumulated optical depth as a function of pressure. The black, blue and red lines represent the stratospheric, tropospheric and total aerosol optical depths, respectively. The upper and lower grey lines mark the τaer=0.5 and τaer=2 pressure levels. The dashed line marks the τaer=1 pressure level.

Our main results concerning the vertical haze distribution in the GRS area are as follows:

  • Independently from temporal or spatial region-to-region variations, we retrieve a model with two main layers: a stratospheric haze with its base near the tropopause and optical depths of the order of unity, and an optically thick (τ(900 nm) ̴ 10) tropospheric haze that extends down to 500 mbar with micron sized particles.
  • Both the stratospheric and tropospheric hazes show a short wavelength absorbing nature, but with clearly distinct imaginary refractive indices, and thus our work suggests the presence of two different chromophores.
  • For the stratospheric haze, we retrieve imaginary refractive indices that seem to be compatible with the ones corresponding to the chromophore agent proposed by Carlson et al. (2016).
  • We have quantified the temporal evolution in the vertical cloud distribution of clouds and hazes in the GRS area.

As occurred in 2019-20, during the present campaign the GRS is undergoing several interactions with smaller vortices. We also present here measurements of the wind fields in the GRS and the surrounding area and other dynamical considerations before, during and after the interactions, following our recently published study Sánchez-Lavega et al. (2021).

References

- Carlson, R.W., Baines, K.H., Anderson, M.S., Filacchione, G., & Simon, A.A. (2016). Chromophores from photolyzed ammonia reacting with acetylene: Application to Jupiter’s Great Red Spot. Icarus, 274, 106-115.

- Irwin, P.G.J., Teanby, N.A., de Kok, R., Fletcher, L.N., Howett, C.J.A., Tsang, C.C.C., Wilson, C.F., Calcutt, S.B., Nixon, C.A., & Parrish, P. D. (2008). The NEMESIS planetary atmosphere radiative transfer and retrieval tool. J. of Quant. Spec. and Radiative Transfer, 109 , 1136-1150.

- Sánchez‐Lavega, A., Anguiano‐Arteaga, A., Iñurrigarro, P., Garcia‐Melendo, E., Legarreta, J., Hueso, R., et al. (2021). Jupiter’s Great Red Spot: Strong interactions with incoming anticyclones in 2019. J. Geophys. Res. Planets, 126, e2020JE006686.

How to cite: Anguiano-Arteaga, A., Pérez-Hoyos, S., Sánchez-Lavega, A., Sanz-Requena, J. F., and Irwin, P.: Temporal variations in vertical haze distribution of Jupiter’s Great Red Spot and its surroundings from HST/WFC3 imaging & dynamical interactions with incoming vortices in 2021, Europlanet Science Congress 2021, online, 13–24 Sep 2021, EPSC2021-271, https://doi.org/10.5194/epsc2021-271, 2021.

Clouds
EPSC2021-418
|
ECP
Ramanakumar Sankar, Csaba Palotai, and Chloe Klare

Observations of the jovian atmosphere over the last few decades have revealed a plethora of planetary scale disturbances which lead to a disruption of the chromophoric and dynamical structure of the atmosphere at the latitude that form in. These outbreaks occur every few years, forming from small localized plumes, and result in the generation of unique cloud features that persist for a short while after the plume formation (Sanchez-Lavega et al 2017, Fletcher et al 2017). The initial plumes are thought to be driven by latent heat release from the deep water layer, making these outbreaks an important feature in the study of the deep jovian atmosphere.

Since it is difficult to directly observe and study the dynamics of the deeper layer, due to the presence of upper level clouds, we use the Explicit Planetary hybrid-Isentropic Coordinate (EPIC) General Circulation Model (GCM) (Dowling et al 2006) to study the dynamics of these plumes. We vary the abundance of the water in the deep layers, and investigate its effects on the plume formation and the subsequent cloud features. With the addition of a new sub-grid scale moist convective scheme (Sankar et al 2020), we investigate the resulting convective storm intensity and upwelling mass flux, in an effort to constrain the dynamics and volatile structure of the water cloud layer. We present our results from the addition of this scheme as well as applications to the 24deg N jet region.


How to cite: Sankar, R., Palotai, C., and Klare, C.: Moist convection in the 24degree N jet: modelling the convective plume formation with the EPIC model, Europlanet Science Congress 2021, online, 13–24 Sep 2021, EPSC2021-418, https://doi.org/10.5194/epsc2021-418, 2021.

EPSC2021-487
|
ECP
Jorge Hernandez Bernal, Agustín Sánchez-Lavega, and Teresa Del Río-Gaztelurrutia

In a recently published paper, we reported the existence and properties of the Arsia Mons Elongated Cloud (AMEC; Hernández-Bernal et al., 2021). We are now exploring models for the theoretical understanding of this outstanding phenomenon.

The AMEC forms at sunrise over the western slope of the Arsia Mons volcano, and for ~3 hours expands to the west following zonal winds, leaving behind a characteristic white bright tail. This process repeats in a daily cycle for a long season around the southern solstice. According to observations in MY34, the AMEC reaches a length of up to 1800 km, and expands at a velocity of around 170 m/s (~130 m/s in other years) at ~45 km in altitude. In comparison, winds predicted by the Global Circulation Model LMD-MCD are ~60m/s (Millour et al. 2018).

The cloud is clearly driven by upward winds forced by the topography of the volcano. We are analysing from the theoretical perspective the formation and particular features of this cloud.

References

Hernández‐Bernal, J., Sánchez‐Lavega, A., del Río‐Gaztelurrutia, T., Ravanis, E., Cardesín‐Moinelo, A., Connour, K., ... & Hauber, E. (2021). An extremely elongated cloud over Arsia Mons volcano on Mars: I. Life cycle. Journal of Geophysical Research: Planets, 126(3), e2020JE006517.

Millour, E., F. Forget,A. Spiga, et al.  "Mars climate database. (Version 5.3)" From Mars Express to ExoMars (2018)

How to cite: Hernandez Bernal, J., Sánchez-Lavega, A., and Del Río-Gaztelurrutia, T.: Exploring the formation of the Arsia Mons Elongated Cloud on Mars, Europlanet Science Congress 2021, online, 13–24 Sep 2021, EPSC2021-487, https://doi.org/10.5194/epsc2021-487, 2021.

EPSC2021-372
|
ECP
Alex Innanen, Brittney Cooper, Charissa Campbell, Scott Guzewich, Jacob Kloos, and John Moores

1. INTRODUCTION

The Mars Science Laboratory (MSL) is located in Gale Crater (4.5°S, 137.4°E), and has been performing cloud observations for the entirety of its mission, since its landing in 2012 [eg. 1,2,3]. One such observation is the Phase Function Sky Survey (PFSS), developed by Cooper et al [3] and instituted in Mars Year (MY) 34 to determine the scattering phase function of Martian water-ice clouds. The clouds of interest form during the Aphelion Cloud Belt (ACB) season (Ls=50°-150°), a period of time during which there is an increase in the formation of water-ice clouds around the Martian equator [4]. The PFSS observation was also performed during the MY 35 ACB season and the current MY 36 ACB season.

Following the MY 34 ACB season, Mars experienced a global dust storm which lasted from Ls~188° to Ls~250° of that Mars year [5]. Global dust storms are planet-encircling storms which occur every few Mars years and can significantly impact the atmosphere leading to increased dust aerosol sizes [6], an increase in middle atmosphere water vapour [7], and the formation of unseasonal water-ice clouds [8]. While the decrease in visibility during the global dust storm itself made cloud observation difficult, comparing the scattering phase function prior to and following the global dust storm can help to understand the long-term impacts of global dust storms on water-ice clouds.

2. METHODS

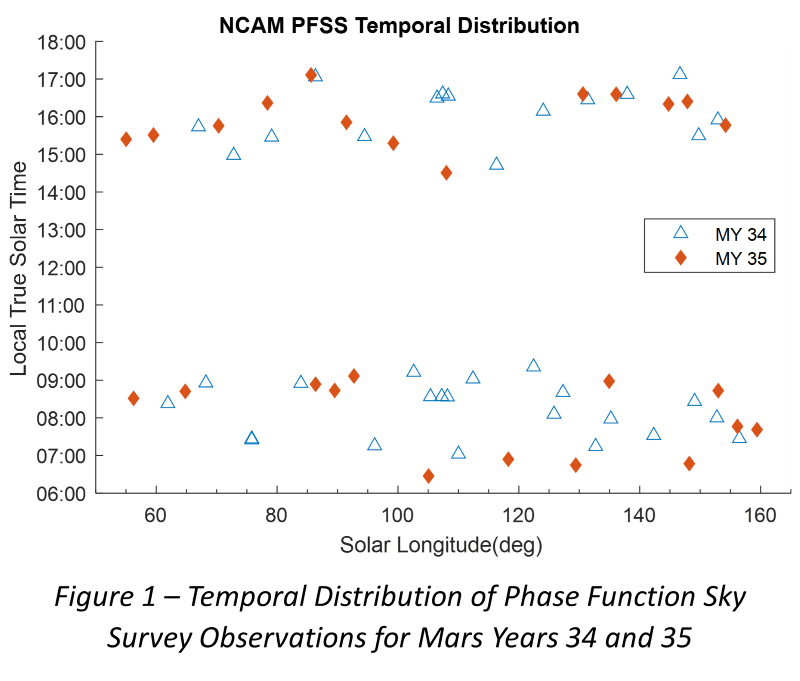
The PFSS consists of 9 cloud movies of three frames each, taken using MSL’s navigation cameras, at a variety of pointings in order to observe a large range of scattering angles. The goal of the PFSS is to characterise the scattering properties of water-ice clouds and to determine ice crystal geometry.  In each movie, clouds are identified using mean frame subtraction, and the phase function is computed using the formula derived by Cooper et al [3]. An average phase function can then be computed for the entirety of the ACB season.

Figure 1 – Temporal Distribution of Phase Function Sky Survey Observations for Mars Years 34 and 35

Figure 1 shows the temporal distributions of PFSS observations taken during MYs 34 and 35. We aim to capture both morning and afternoon observations in order to study any diurnal variability in water-ice clouds.

3. RESULTS AND DISCUSSION

There were a total of 26 PFSS observations taken in MY 35 between Ls~50°-160°, evenly distributed between AM and PM observations. Typically, times further from local noon (i.e. earlier in the morning or later in the afternoon) show stronger cloud features, and run less risk of being obscured by the presence of the sun. In all movies in which clouds are detected, a phase function can be calculated, and an average phase function determined for the whole ACB season.  

Future work will look at the water-ice cloud scattering properties for the MY 36 ACB season, allowing us to get more information about the interannual variability of the ACB and to further constrain the ice crystal habit. The PFSS observations will not only assist in our understanding of the long-term atmospheric impacts of global dust storms but also add to a more complete image of time-varying water-ice cloud properties.

How to cite: Innanen, A., Cooper, B., Campbell, C., Guzewich, S., Kloos, J., and Moores, J.: A Comparison of Aphelion Cloud Belt Phase Functions Before and After the Mars Year 34 Global Dust Storm, Europlanet Science Congress 2021, online, 13–24 Sep 2021, EPSC2021-372, https://doi.org/10.5194/epsc2021-372, 2021.

EPSC2021-451
|
ECP
Charissa Campbell, Doug Ellison, Christina Smith, and John Moores

Abstract

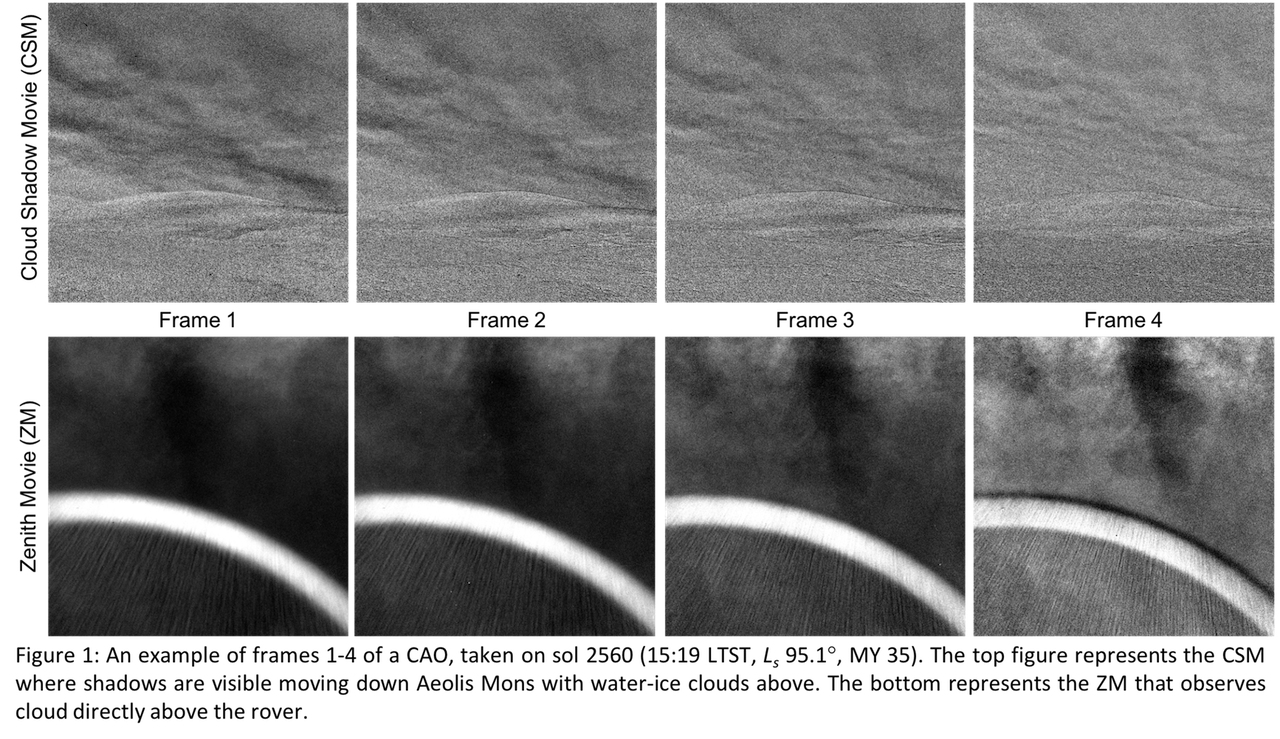
The altitudes of Martian water-ice clouds above Gale crater are being calculated through the Cloud Altitude Observation (CAO) taken by the Mars Science Laboratory (MSL, Curiosity). Typically, a mission needs a lidar onboard to calculate altitude, but this observation utilizes local topography – Aeolis Mons – to follow shadows and determine an absolute wind velocity. Comparing this velocity to the angular wind velocity found in a paired vertical movie determines the cloud’s altitude. This method is useful for the community when a mission doesn’t have a lidar but nearby terrain to observe shadows. During Mars Year (MY) 35, 28 observations were collected and will be compared to Campbell et al. [1] results from MY 34 to determine any changes.

Introduction

The Aphelion Cloud Belt (ACB) season is a yearly equatorial cloud belt caused by cooler atmospheric temperatures. Occurring between solar longitude (Ls) 45°-150°, water-ice clouds are typically visible during two times of each sol, early morning and late afternoon [2,11]. Since 2012, MSL has been observing the ACB season in Gale crater (4.5°S, 137.4°E) with a variety of cloud observations to study seasonal and diurnal changes of different parameters such as seasonal and diurnal changes [1,8,9], cloud altitude [1], opacity [8,9,10] and ice crystal geometry [3].

One parameter, altitude, is of interest to the atmospheric science community to determine the cloud’s relation to the Planetary Boundary Layer (PBL). Orbiters are able to constrain cloud altitudes through limb measurements but observations within 10 km of the surface are hampered by dust opacity [7]. This is difficult for studying the PBL in Gale crater from orbit as the PBL is very shallow during the ACB season, ranging between 2-3 km [5,12]. From the surface, cloud altitudes could be measured with a lidar [4, 13], but only a single Mars mission has carried this instrument and therefore we must employ other methods to find altitude.

As described in Campbell et al. [1], a new atmospheric observation was implemented on MSL during the MY 34 ACB season. Typically used for dust-devil searching, the Navigation Camera (Navcam) took a movie pointed at Aeolis Mons observed shadows moving along the mountain cast by clouds above. These shadows were georeferenced with a digital terrain model and the distance travelled was used to determine an absolute wind velocity. Angular wind velocity is already determined using a vertically pointed movie that follows how clouds move with respect to the camera’s field of view [1]. When these two movies are paired together, the comparison between velocities is used to calculate altitude via trigonometry. Therefore, this paired movie combination facilitates a way to directly calculate cloud altitudes at Gale crater for the first time. For the remainder of MY 34 season, these observations were paired whenever possible and resulted in 9 detections of clouds and their shadows, with the results reported in [1].

Following this success, a new MSL observation was designed, optimized, and implemented to observe water-ice cloud shadows and deduce the water-ice cloud altitudes for the MY 35 ACB season and named the Cloud Altitude Observation (CAO).

Cloud Altitude Observation

The CAO is performed in the ACB season on a weekly cadence. It consists of two movies – Cloud Shadow Movie (CSM) and Zenith Movie (ZM) – taken one after the other by the Navcam. Both are made up of eight 1022x1022 pixeled images and span 240 seconds each. The CSM (Figure 1, top) points directly at Aeolis Mons to capture shadow motion which is used to determine an absolute wind velocity. The ZM (Figure 1, bottom) points directly above the rover and is used to determine an angular velocity based on the camera’s field of view. Comparing these two velocities allows the altitude of the clouds to be calculated.

Results and Discussion

A total of 28 observations were collected between Ls 47°-163° and will be compared to MY 34 results [1] to determine any seasonal changes. Processing and analysis of these observations are ongoing, but the entire MY 35 ACB season's data will be processed and analyzed by the time of the conference.

The MY 35 ACB season is unique in that it followed a Global Dust Storm (GDS) that occurred from Ls 188°-250° [6]. These storms are large enough to envelope the entire planet and affect the local and global environment. MSL has the unique ability to continue operations during a GDS and detected dust optical depths of up to an order of magnitude larger than normally observed [6]. Studying how the cloud altitudes change before/after the GDS will help determine if there are any long-term effects to the water-ice clouds. Once the MY 36 ACB season concludes, it will be added to the current data set to further determine any seasonal changes.

References

[1] Campbell et al., Planet. Space Sci. 182. 104785. 2020.

[2] Clancy et al., Icarus. 122, 36-62. 1996.

[3] Cooper et al., P&SS. 168, 62-72. 2019.

[4] Dickinson et al., Geophys. Res. Lett. 37, L18203. 2010.

[5] Guzewich et al., JGR-Planets, 122, 2779–2792. 2017.

[6] Guzewich et al., Geophys. Res. Lett., 46, 71-79. 2019.

[7] Kleinbohl et al., JGR-Planets, 114, E10006. 2009.

[8] Kloos et al., Adv Sp Res. 58, 1223-1240. 2016.

[9] Kloos et al., JGR-Planets. 123, 233–245. 2018.

[10] Moores, et al., Adv. Space Res. 55, 2217–2238. 2015b.

[11] Tamppari et al., JGR-Planets. 108, 5073. 2003.

[12] Tyler, Barnes, Int. J. Mars Sci. Explor. 8, 58–77. 2013.

[13] Whiteway et al., Science. 325. 68. 2009.

How to cite: Campbell, C., Ellison, D., Smith, C., and Moores, J.: Updated Altitudes for Martian Water-Ice Clouds above Gale Crater, Europlanet Science Congress 2021, online, 13–24 Sep 2021, EPSC2021-451, https://doi.org/10.5194/epsc2021-451, 2021.

EPSC2021-388
|
ECP
Grace Bischof, Brittney Cooper, and John E. Moores

Introduction:

    On Mars, near-surface and ground temperatures undergo massive diurnal fluctuations. Amplitudes can surpass 70 K between the daily maximum and minimum temperatures [1].  Because Mars’ thin atmosphere is largely transparent to infrared radiation, the solar radiation from the sun and the outgoing longwave radiation from the surface are the primary drivers of the near-surface temperature [2].

    However, the influence from the atmosphere is not entirely negligible. It is well known that dust in the atmosphere has a secondary, but measurable, effect on the temperature by scattering visible-band solar radiation and absorbing longwave radiation [3]. This atmospheric thermal effect is not only caused by dust; Water-ice clouds have a similar influence, where outgoing longwave radiation may be absorbed and reflected back toward the ground, resulting in a warming of the near-surface temperature [4]. This project will investigate the amount of flux reflected by water-ice clouds by calculating the thermal forcing at the Phoenix landing site.

Background:

    The Phoenix mission landed in the Martian northern Arctic, at a latitude of 68.2°N in 2008. Phoenix operated for 151 sols, collecting data up to and through the northern summer solstice. About 60 sols into the mission, water-ice clouds were observed both by images taken by the Stereo Surface Imager (SSI) [5] and by backscatter detected using a light detecting and ranging (LIDAR) instrument onboard the lander [6]. On four occasions, by using the LIDAR and SSI together, surface-fog was detected [7]. In the second half of the mission, surface-based clouds formed nightly around 23:00 Local True Solar Time (LTST). By 01:00 LTST, a second clouds base formed at altitudes near 4 km. The clouds dissipated by the late morning, but were observed to linger as the mission progressed past summer solstice [8].

Methods:

     Data for the near-surface air temperature are acquired from the Planetary Data System. Phoenix carried three thin-wire temperature sensors at heights of 1 m, 0.5 m, and 0.25 m off the deck of the lander, itself located 1 m above the surface. Temperature measurements were recorded every 2 s through the duration of a sol, with an approximately 20-minute break, usually occurring around midday.

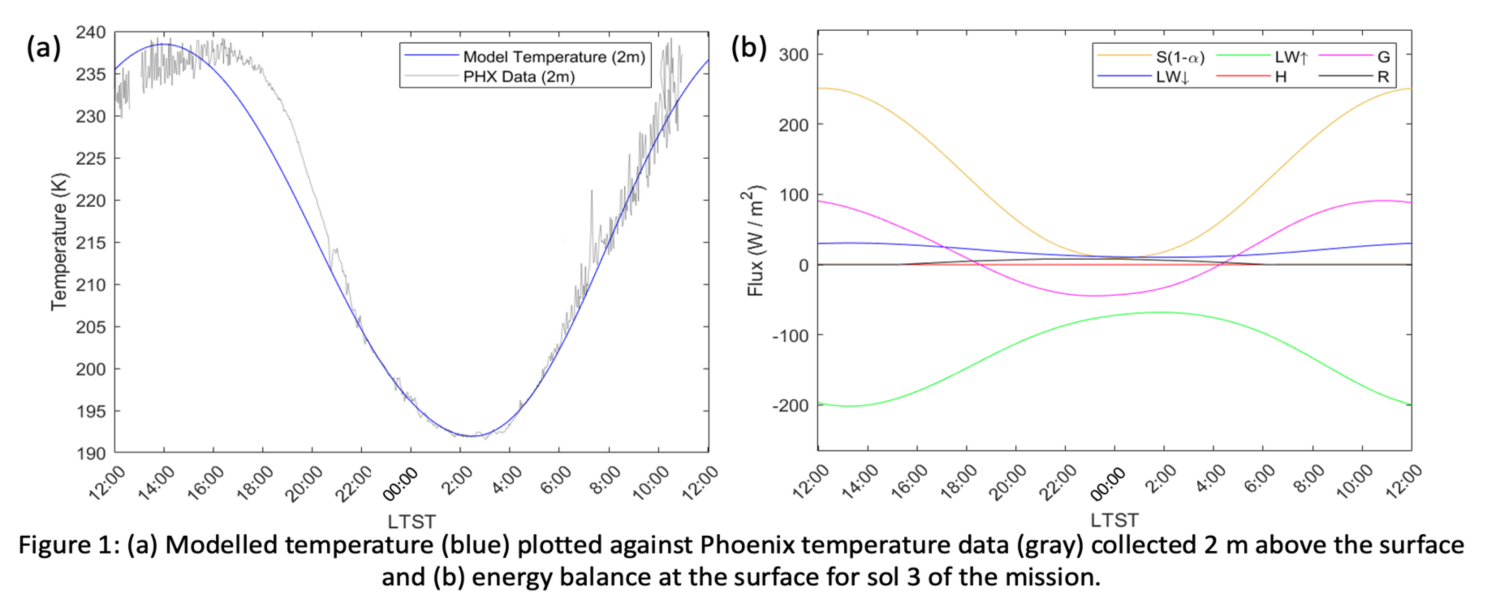
     To determine the thermal impacts due to water-ice clouds, an energy balance at the surface is needed. Adapted from [9], the energy balance is given by


where G is the net flux into the ground, S is the solar radiation, α is the surface albedo, LW↓ is the longwave radiation downwelling from the atmosphere, LW↑ is the longwave radiation emitted from the surfaced, H is the sensible heat flux, and L is the latent heat flux of water. R describes the additional longwave radiation downwelling from the atmosphere, which we attribute to water-ice clouds. R is maintained as an independent parameter which may be varied throughout a run of the model in 3 hour-intervals.

     With this energy balance, a subsurface conduction model is used to find the surface temperature at the Phoenix site. At each timestep, the surface temperature is coupled to the air temperature by

where the terms are described in [9].  

      The modelled air temperatures are plotted against the air temperature data collected by Phoenix to evaluate the additional flux reflected by clouds (given by R) that is needed for the model to match the data collected in situ.

Results and Discussion:  

     Figure 1(a) shows the modelled temperaure plotted against the Phoenix data for sol 3 of the mission. During the midday, R = 0 W m-2 implying there is no flux reflected from water-ice clouds. Moving into the evening, R = 5 W m-2 starting at 21:00 LTST. This increases to 8 W m-2 by 00:00 LTST. At 03:00 LTST, the reflected flux drops back down to 5 W m-2, and is back to 0 W m-2 by 06:00 LTST. This additional flux is not a dominant energy term, as shown in Figure 1(b), but a resulting temperature increase of 2 K is seen. This analysis suggests that clouds were present at the Phoenix landing site earlier than they were detected in images or LIDAR data products.


     Moving forward, the amount of flux reflected by water-ice clouds will be determined for each sol of the misson. This will show how the reflected flux evolves diurnally – particularly through the nighttime – and as the mission progressed past summer solstice.

References:

[1] Martínez G.M. et al (2017) Space Sci Rev, 212, 295–338.

[2] Savijärvi H. (2014) Icarus, 242, 105–111.

[3] Guzewich S.D. et al (2019) Geophys. Res. Lett., 46, 71–79.

[4] Wilson R.J. (2007) Geophys. Res. Lett., 34.

[5] Moores J.E. et al (2010) JGR: Planets, 115.

[6] Whiteway J.A. et al (2009) Science, 325, 68–70.

[7] Moores J.E. et al (2011) Geophys. Res. Lett., 38.

[8] Dickinson C. et al (2010) Geophys. Res. Lett., 37.

[9] Martínez G.M. et al (2014) JGR: Planets, 119, 1822–1838.


How to cite: Bischof, G., Cooper, B., and Moores, J. E.: Water-Ice Cloud Thermal Effects at the Phoenix Mission Landing Site, Europlanet Science Congress 2021, online, 13–24 Sep 2021, EPSC2021-388, https://doi.org/10.5194/epsc2021-388, 2021.

EPSC2021-7
Jean Lilensten, Jean-Luc Dauvergne, Christophe Pellier, Marc Delcroix, Emmanuel Beaudoin, Mathieu Vincendon, Emil Kraaikamp, Guillaume Bertrand, Clyde Foster, Christopher Go, Μanos Kardasis, Alexei Pace, Damian Peach, Anthony Wesley, Evangelia Samara, Stefaan Poedts, and Francois Colas

During the 2020 Mars opposition, we observe from Earth the occurrence of a non-typical large-scale high-altitude clouds system, extending over thousands of km from the equator to 50°S. Over 3 hours, they emerge from the night side at an altitude of 90 (-15/+30) km and progressively dissipate in the dayside. They occur at a solar longitude of 316°, west of the magnetic anomaly and concomitantly to a regional dust storm. Despite their high altitude, they are composed of relatively large particles, suggesting a probable CO2 ice composition, although H2O cannot be totally excluded. Such ice clouds were not reported previously. We discuss the formation of this new type of clouds and suggest a possible nucleation from cosmic particle precipitation.

How to cite: Lilensten, J., Dauvergne, J.-L., Pellier, C., Delcroix, M., Beaudoin, E., Vincendon, M., Kraaikamp, E., Bertrand, G., Foster, C., Go, C., Kardasis, Μ., Pace, A., Peach, D., Wesley, A., Samara, E., Poedts, S., and Colas, F.: A new type of cloud discovered from Earth in the upper Martian atmosphere, Europlanet Science Congress 2021, online, 13–24 Sep 2021, EPSC2021-7, https://doi.org/10.5194/epsc2021-7, 2021.

EPSC2021-742
|
ECP
Thomas Mangan, Anni Määttänen, Benjamin Murray, and John Plane

Introduction

H2O ice clouds in the mesospheres of terrestrial planets have been observed for Earth as Polar Mesospheric Clouds (PMCs) and are thought to be condensed on meteoric smoke [1, 2]. In contrast, on Mars both H2O and CO2 ice clouds have been observed [3, 4]. These clouds play an important role in redistributing condensable material and the chemistry of the mesospheres of Mars and Earth. The possibility of sub-visible H2O ice clouds on Venus was speculated in 1983 by Turco, et al. [5] based on a limited set of observations (four Pioneer entry probes), however, no high-altitude ice clouds have ever been observed on Venus. More recent satellite observations have shed new light on the extreme low temperature conditions of the upper atmosphere [6]. Through satellite observation, experimental studies and modelling, our understanding of cloud formation and composition within terrestrial mesospheric clouds on Earth and Mars has improved significantly in recent decades. Here we apply this improved understanding of mesospheric clouds and the breadth of atmospheric observations to the possibility of ice clouds on Venus and importantly whether they could be detected in satellite observations.

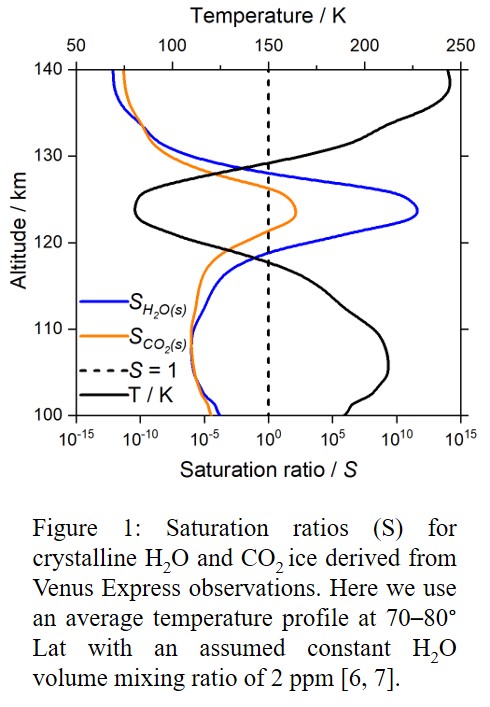
Figure 1 shows an example polar temperature profile for Venus and the calculated saturation ratio with respect to both H2O and CO2 ice. The temperature drops below 80 K between 120 – 130 km, causing significant supersaturations with respect to the solid phases of CO2 and particularly H2O, conditions which are conducive to ice cloud formation.

Findings

The first step in ice cloud formation is nucleation, which we evaluate homogeneously and heterogeneously for both H2O and CO­2 ice, nucleated by vapour deposition using Classical Nucleation Theory (CNT), an approach applied previously to Martian mesospheric clouds [8, 9]. Several nucleating particles are discussed and considered in the heterogeneous calculations, including meteoric smoke and in the case of CO2 nucleation, H2O ice particles [8, 10, 11]. This theory is applied to a planet-wide set of temperature observations (160+ occultations) from the SOIR instrument onboard Venus Express to help determine possible cloud locations and frequency. Preliminary results indicate that in the presence of suitable nanometre-sized nucleating particles, conditions exist on Venus for both H2O and CO2 to nucleate, especially where the coldest temperatures are reached in the polar regions above 120 km. If visible clouds are possible in Venus mesosphere condensation of the primary constituent (CO2­, significantly more abundant than H2O) onto the initial ice seeds is the likely pathway.

The growth of CO2 ice particles are then predicted under favourable nucleation conditions, using a 1D model which accounts for growth, sublimation, and sedimentation of the particles. The model shows that the clouds form in a region of the atmosphere where the pressure is very low (< 1 × 10⁻² Pa). The ice particles therefore sediment rapidly into a warmer layer of the atmosphere and sublimate, so that they are very short-lived (typically < 5 mins).  Once peak particle sizes and lifetimes are determined, the extinction coefficient can be calculated for a realistic particle population using Mie theory, and hence the probability of the clouds being observed in occultation by a satellite spectrometer can be evaluated.

Acknowledgements

This work is supported by grant ST/T000279/1 from the UK Science and Technology Facilities Council.

References

[1]         M. Hervig, R. E. Thompson, M. McHugh, L. L. Gordley, J. M. Russell III, and M. E. Summers, "First confirmation that water ice is the primary component of polar mesospheric clouds," Geophysical Research Letters, vol. 28, no. 6, pp. 971-974, 2001.

[2]         M. E. Hervig, L. E. Deaver, C. G. Bardeen, J. M. Russell, S. M. Bailey, and L. L. Gordley, "The content and composition of meteoric smoke in mesospheric ice particles from SOFIE observations," Journal of Atmospheric and Solar-Terrestrial Physics, vol. 84-85, pp. 1-6, 2012.

[3]         F. Montmessin et al., "Hyperspectral imaging of convective CO2 ice clouds in the equatorial mesosphere of Mars," Journal of Geophysical Research Planets, vol. 112, no. E11, Nov 13 2007.

[4]         J. A. Whiteway et al., "Mars Water-Ice Clouds and Precipitation," Science, vol. 325, no. 5936, p. 68, 2009.

[5]         R. P. Turco, O. B. Toon, R. C. Whitten, and R. G. Keesee, "Venus: Mesospheric hazes of ice, dust, and acid aerosols," Icarus, vol. 53, no. 1, pp. 18-25, 1983.

[6]         A. Mahieux et al., "Densities and temperatures in the Venus mesosphere and lower thermosphere retrieved from SOIR on board Venus Express: Carbon dioxide measurements at the Venus terminator," Journal of Geophysical Research Planets, vol. 117, no. E7, 2012.

[7]         S. Chamberlain et al., "SOIR/VEx observations of water vapor at the terminator in the Venus mesosphere," Icarus, vol. 346, p. 113819, 2020.

[8]         M. Nachbar, D. Duft, T. P. Mangan, J. C. G. Martin, J. M. C. Plane, and T. Leisner, "Laboratory measurements of heterogeneous CO2 ice nucleation on nanoparticles under conditions relevant to the Martian mesosphere," Journal of Geophysical Research Planets, vol. 121, pp. 753 - 769, 2016.

[9]         C. Listowski, A. Määttänen, F. Montmessin, A. Spiga, and F. Lefevre, "Modeling the microphysics of CO2 ice clouds within wave-induced cold pockets in the martian mesosphere," Icarus, vol. 237, pp. 239-261, 2014.

[10]       D. L. Glandorf, A. Colaprete, M. A. Tolbert, and O. B. Toon, "CO2 snow on Mars and early Earth: Experimental constraints," Icarus, vol. 160, no. 1, pp. 66-72, 2002.

[11]       J. M. C. Plane, J. D. Carrillo-Sanchez, T. P. Mangan, M. M. J. Crismani, N. M. Schneider, and A. Määttänen, "Meteoric Metal Chemistry in the Martian Atmosphere," Journal of Geophysical Research Planets, vol. 123, no. 3, pp. 695-707, 2018.


How to cite: Mangan, T., Määttänen, A., Murray, B., and Plane, J.: Elusive ice clouds in the upper mesosphere of Venus, Europlanet Science Congress 2021, online, 13–24 Sep 2021, EPSC2021-742, https://doi.org/10.5194/epsc2021-742, 2021.