

- University of Leicester, School of Physics and Astronomy, Leicester, United Kingdom
Introduction: The Galilean satellites’ surfaces and subsurfaces will be explored by robotic spacecraft in the late 2020s and early 2030s, but significant advances from ground-based astronomical facilities will be possible in the coming decade. Ganymede’s surface is composed of regions of brighter young terrain with similar composition to Europa’s young surface, and older dark terrain that has a higher abundance of silicate-rich material [11,16]. Infrared spectra from the Galileo orbiter Near-Infrared Mapping Spectrometer (NIMS) provided high-spatial-resolution IR spectra of Ganymede but with limited spatial coverage in many locations. In recent years, ground-based adaptive optics observations in the infrared with Keck/OSIRIS and VLT/SINFONI have provided new insights into the distributions of surface materials on the Galilean satellites [2,4,10,11].
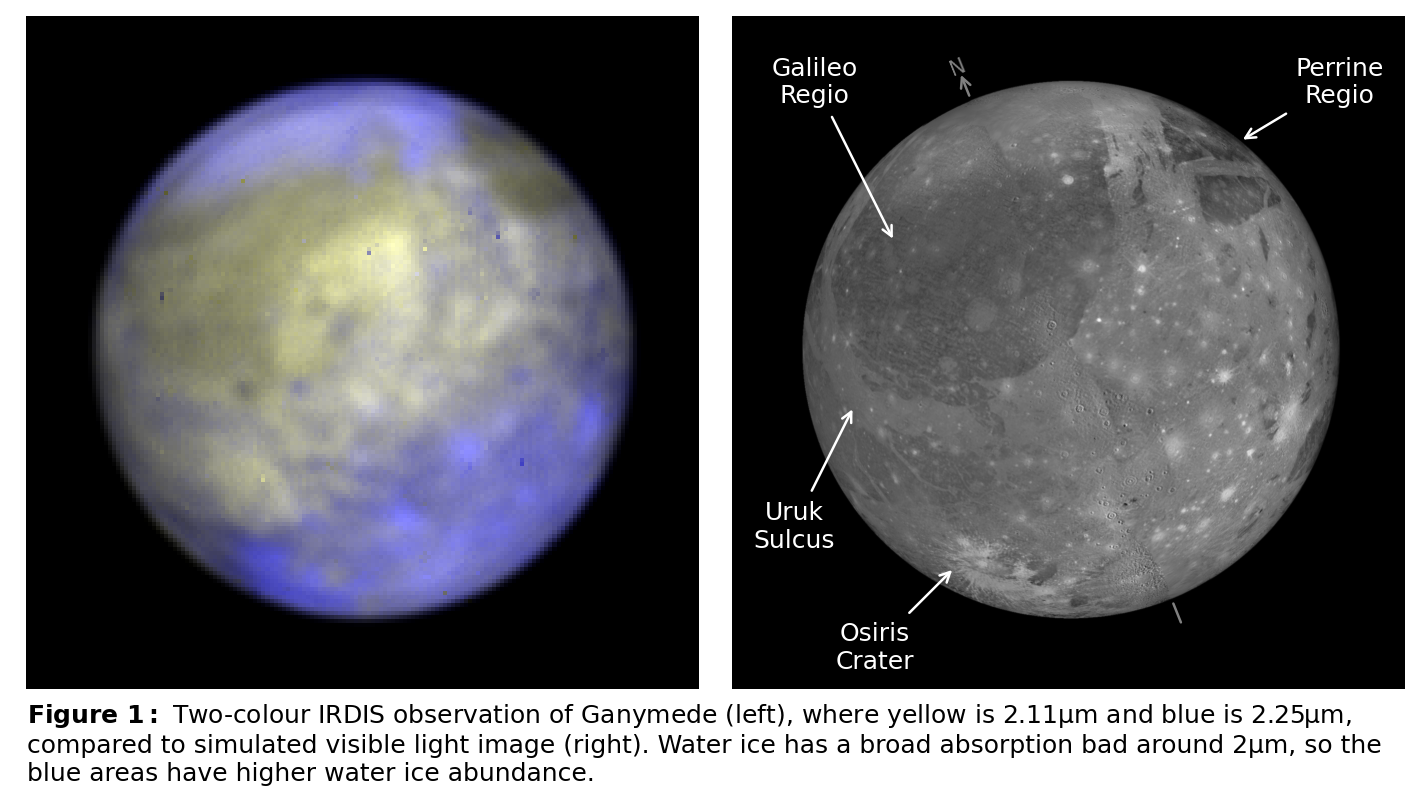
Datasets: Near-IR observations of Ganymede were taken during VLT/SPHERE [1] science verification in 2014 and 2015, observing Ganymede’s leading/anti-jovian hemisphere (sub-observer longitude of 116°W). Data were taken in IRDIFS_EXT mode, allowing simultaneous imaging with the Integral Field Spectrograph (IFS) and Infrared Differential Imaging Spectrometer (IRDIS) sub-systems of the SPHERE instrument. IFS [5,13] produces image cubes with spectra from 0.95 to 1.65 μm (R∼30). It has a high spatial resolution, with a pixel size of 7.46 mas/px, corresponding to ∼25 km/px at Jupiter. Accounting for diffraction, this allows features ∼150 km across to be resolved. IRDIS produced simultaneous imaging through two filters, with transmissions centred on 2.11 and 2.25 μm that enables measurement of the strength of water ice absorption around 2 µm (Figure 1). We have also analysed a series of Galileo/NIMS observations with similar spectral and spatial coverage to our SPHERE data. The NIMS detector covering the 0.99 to 1.26 µm wavelength range failed early in the Galileo mission at Jupiter, meaning the NIMS coverage of the SPHERE spectral range is limited.
The dataset has been reduced and cleaned to produce mapped spectral cubes of Ganymede’s observed hemisphere. Images are photometrically corrected to remove the variation in brightness towards the edge of the observed disc caused by varying viewing angles and illumination levels of the surface. Our photometric correction uses the Oren-Nayar model, which generalizes the Lambertian model to more accurately represent rough surfaces [15]. This enables regions at large emission angles to be mapped accurately, providing significant improvements over the Lambertian model that overcorrects the brightness towards the edge of the disc. The Oren-Nayar correction allows our mapping to reach emission angles of ∼70°, higher than previous studies that extend to 50° to 60° [2,7,10].
Spectral modelling: We analyse the mapped cubes by fitting to laboratory spectra from reference cryogenic libraries. These reference spectra include water ice, sulfuric acid, and hydrated salts [3,8,12]. We have developed an implementation of the Hapke bidirectional reflectance model [9], which we use to model a range of ice grain sizes. We also include ‘synthetic’ black and white spectra which are used to model spectrally-flat (e.g., silicate) material.
Our fitting routine is run for each observed location to produce compositional maps of Ganymede’s observed hemisphere. We treat each observed spectrum as a linear combination of discrete endmembers Ei(λ) with respective abundances ai, where the modelled spectrum is calculated as M(λ)=ΣiaiEi(λ). Our routine uses Markov Chain Monte Carlo techniques [6] to model an observed spectrum, producing a posterior distribution of fitted abundance values for each endmember, and combinations of different endmembers (Figure 2).
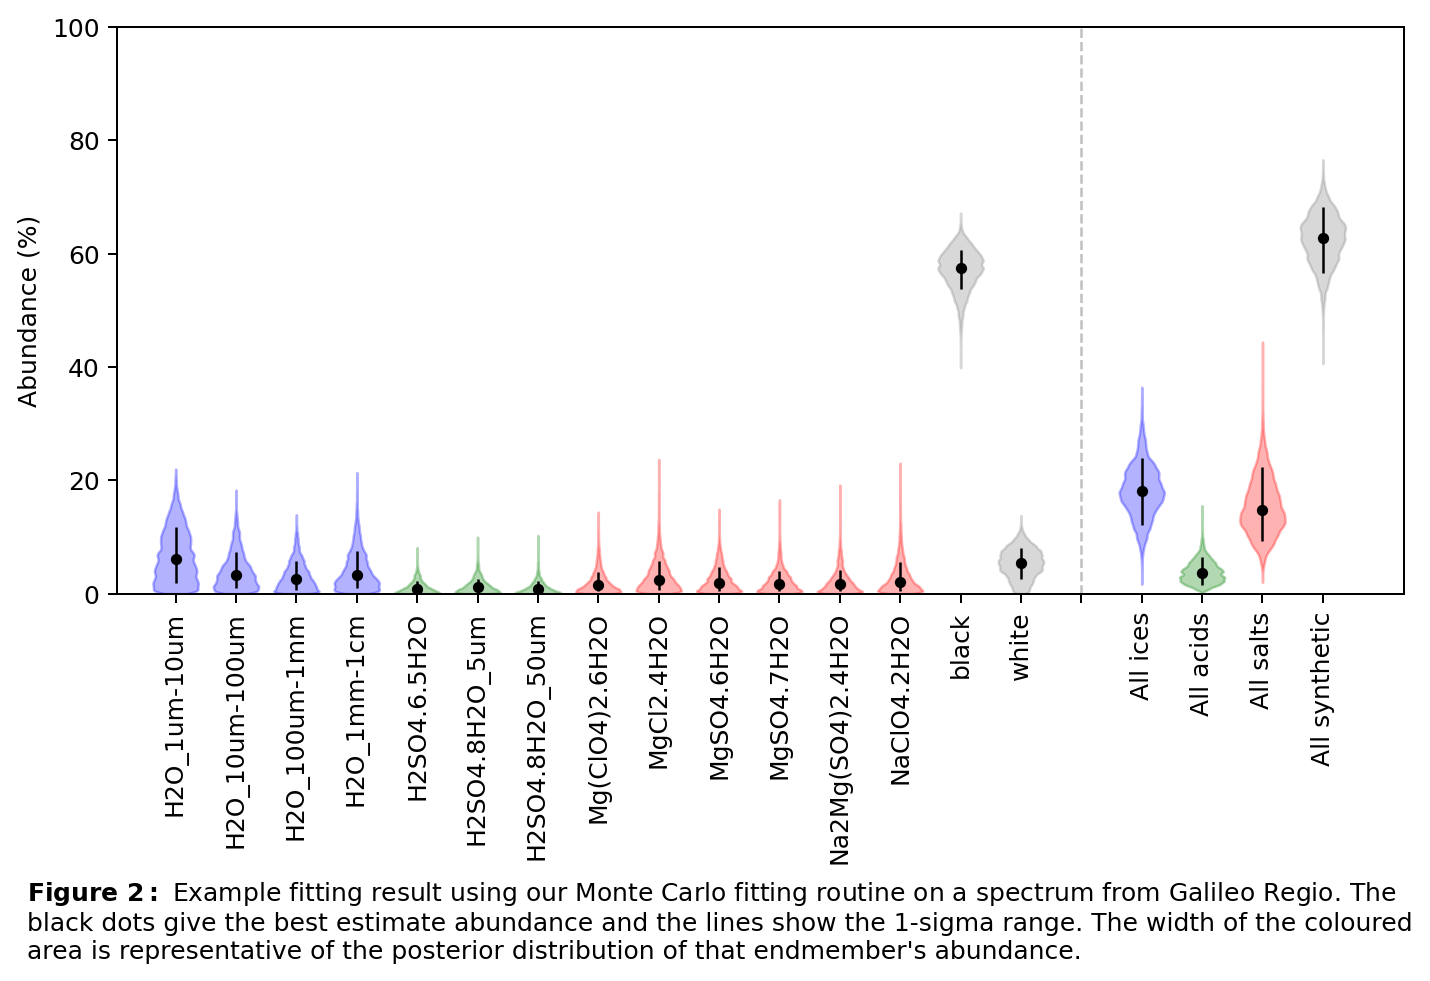
The median of each distribution is used as the best estimate abundance for each endmember, and the width of the distribution is used to estimate the uncertainty on that central value. The posterior distributions of combinations of endmembers can likewise be calculated, accounting for correlations in the uncertainties of the summed endmembers. Whilst the uncertainty on a specific endmember’s abundance may be large (e.g., a specific ice grain size), the uncertainty of the abundance of a combination of endmembers is often much smaller (e.g., the total abundance of all ice endmembers). The use of Monte Carlo techniques allows better exploration of the endmember parameter space than a simple linear fit, and the uncertainty estimates allow more detailed understanding of potential detections.
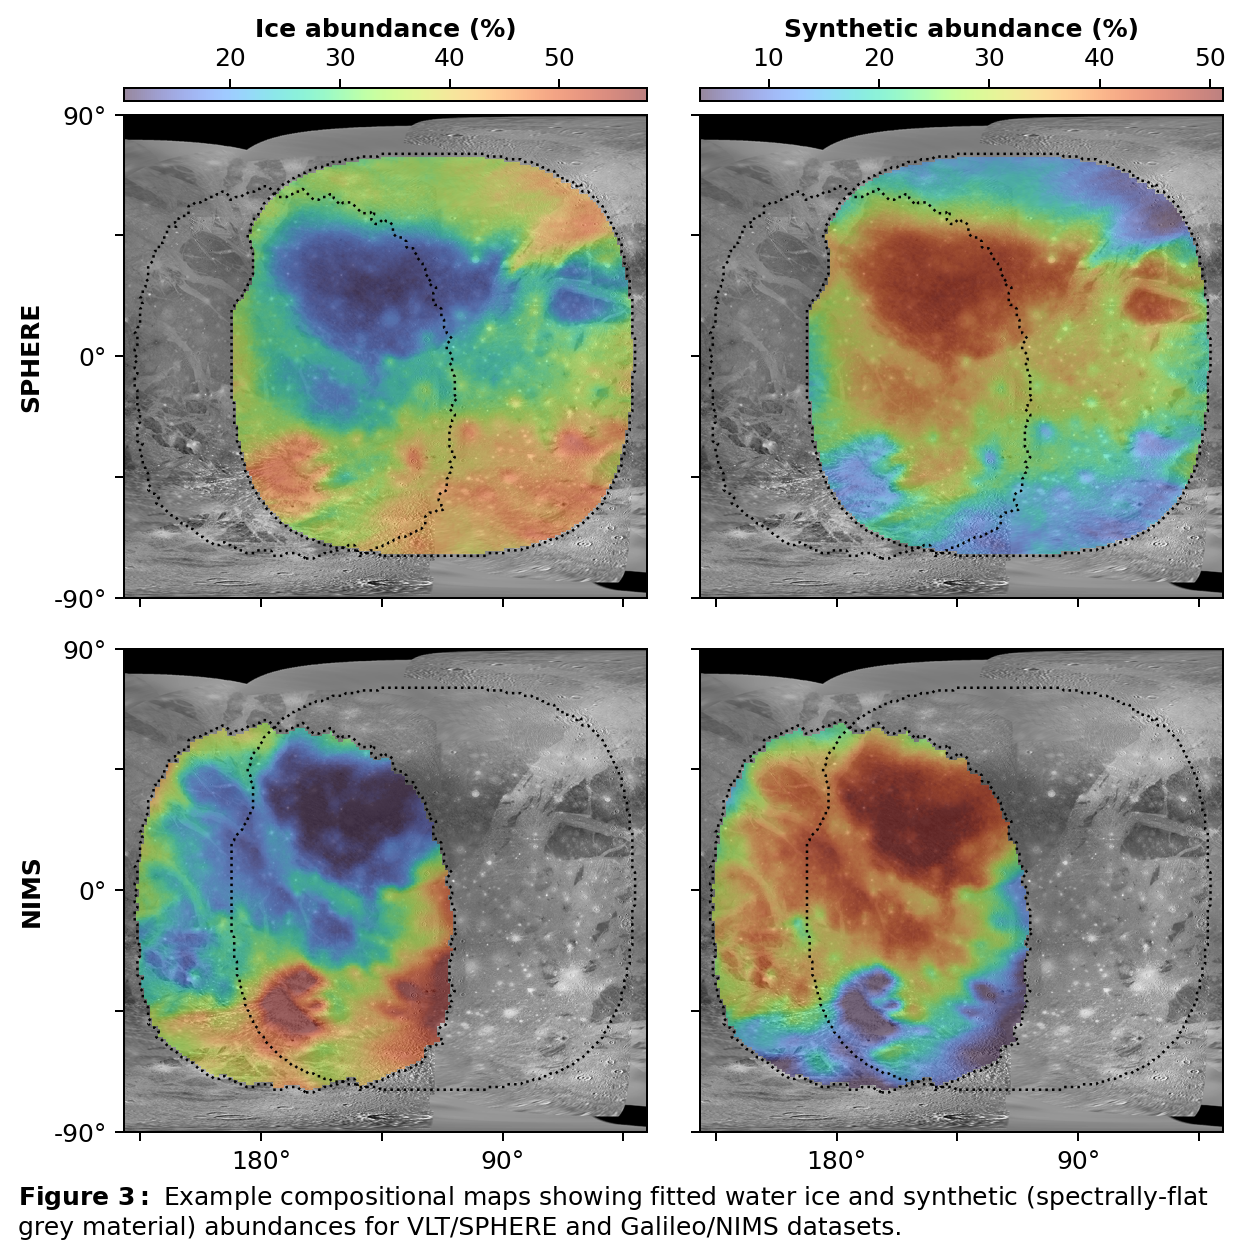
Modelling results from the SPHERE and NIMS datasets show strong similarities and are consistent with previously observed compositional features (Figure 3). These include Ganymede’s younger brighter terrain having higher water ice abundances and the older terrain has a high abundance of spectrally-flat (i.e., grey) material. This spectrally-flat material has a uniformly low albedo and is consistent with higher silicate abundance in Ganymede’s old dark terrain.
Additional SPHERE observations were planned to achieve full longitude coverage of Ganymede in 2020, however this observing campaign has been delayed due to the COVID-19 pandemic. This full observing campaign will allow ~95% of Ganymede’s surface areas to be mapped using SPHERE.
Acknowledgments: We would like to thank the Royal Society for supporting this work.
References: [1] Beuzit et al., 2019, arXiv:1902.04080. [2] Brown & Hand, 2013, AJ. [3] Carlson, Johnson, & Anderson, 1999, Science. [4] Carlson et al., 1992, Galileo Mission. [5] Claudi et al., 2008, SPIE. [6] Foreman-Mackey et al., 2013, Astronomical Society of the Pacific. [7] Grundy et al., 2007, Science. [8] Hanley et al., 2014, JGR-Planets. [9] Hapke, 1993, Theory of reflectance and emittance spectroscopy. [10] Ligier et al., 2016, AJ. [11] Ligier et al., 2019, Icarus. [12] McCord et al., 1999, JGR-Planets. [13] Mesa et al., 2015, A&A [15] Oren & Nayar, 1994. [16] Pappalardo et al., 2004, Jupiter: The Planet, Satellites and Magnetosphere.
How to cite: King, O. and Fletcher, L.: Compositional Mapping of Ganymede with VLT/SPHERE and Galileo/NIMS using Markov Chain Monte Carlo Spectral Analysis, Europlanet Science Congress 2021, online, 13–24 Sep 2021, EPSC2021-279, https://doi.org/10.5194/epsc2021-279, 2021.