
Comparison of the Seasonal Pressure Variations Recorded by InSight and Viking 1 and Recalibration of InSight Data
 1,1,4,5,6,
- 1Laboratoire de Météorologie Dynamique / Institut Pierre-Simon Laplace, Sorbonne Université, Centre National de la Recherche Scientifique (CNRS), Ecole Polytechnique, Ecole Normale Supérieure (ENS), Paris, France
- 2Institut Universitaire de France, Paris, France
- 3Cornell Center for Astrophysics and Planetary Science, Cornell University, Ithaca, NY, USA
- 4Aeolis Research, Unit 5, Chandler, AZ, USA
- 5Centro de Astrobiología (CSIC-INTA), Torrejón de Ardoz, Spain
- 6Southwest Research Institute, Boulder, CO, USA
Abstract
The surface pressure measurements recorded by InSight seem to be the best in terms of precision and stability for comparison with Viking data and to rule on a possible secular climate change. However, the comparison of the measurements between the two consecutive mission years reveals an offset imposed by the sensor temperature. We propose here a correction of this effect by exploiting the MSL REMS data acquired at the same time. The corrected data then follow perfectly the pressure models based on the pressure recorded by MSL during MY 34 and 35 interpolated with the help of the LMD GCM. Further investigations studying the possible difference between Viking 1 and InSight seasonal variations will be presented during the conference.
Introduction
Remote observations of interannual variations in polar cap coverage suggest that the south polar residual cap (SPRC) might be eroding [1,2,3]. Such a change in the SPRC would raise the surface pressure every year. Previous comparisons of surface pressures recorded by Viking 1 with Phoenix data [4] or MSL REMS measurements [5] report a possible increase of pressure at the surface of Mars within 30 years. However, the conclusions were unsure due to the uncertainty of the data for Phoenix, and the sensitivity of the hydrostatic adjustment imposed by the climbing of MSL on the complex Gale crater topography.
In 2018, the InSight lander brought an accurate pressure sensor at Elysium Planitia. The uncertainty due to the long-term instrumental drift and the accuracy of the sensor is negligible compared to the requirement of accuracy to detect this secular climate change [4]. We thus propose to detect any change of CO2 mass in the atmosphere or a change in the seasonality of the polar cap with an accurate comparison between the seasonal pressure variations recorded by Viking 1 and InSight.
Thermal Sensitivity of the Pressure Sensor
A direct comparison between pressure measurements made during the first and second years of the InSight mission shows a strong difference, thus questioning the reliability of the measurements (Figure 1). Considering the large difference between the measured pressure over the two years, and the correlation of some pressure decreases with some drops of the sensor temperature, we believe that the measurements are affected by a possible thermal offset due to a gradient of temperature within the sensor.
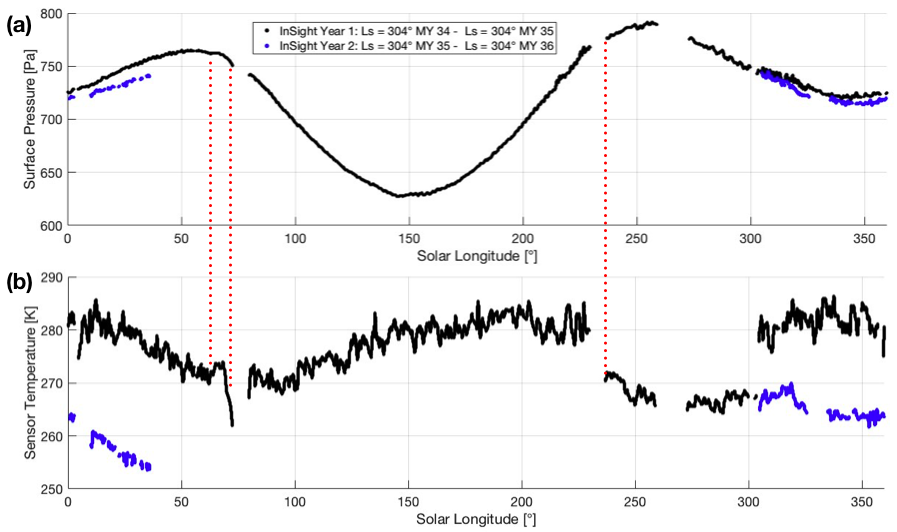
Figure 1. (a) Uncorrected diurnal-averaged surface pressure recorded by InSight during the first and second years of the mission. (b) Diurnal-averaged pressure sensor temperature. Red dashed lines indicate the correlation between drops in the pressure measurements and drops in the sensor temperature records.
Recalibration of the Pressure data
We propose here an empirical calibration to correct this sensor thermal effect. To remove any meteorological effects (thermal tides, baroclinic waves), the measured pressure P is averaged over 10-sols to give < P >10sols. As reported in [6] who used MSL data, it seems that the pressure recorded at the beginning of the mission (Ls < 70°, MY = 35) could be slightly lower than the pressure recorded at the end of the mission (Ls < 70°, MY = 36), possibly as a result of the MY34 global dust storm. To quantify this difference, we interpolated the MSL REMS data available on the PDS with careful altitude corrections. Neglecting the difference of scale height between MY35 and MY36, one may have:

Where: ![]()
with E the thermal-induced offset on pressure data described previously. Assuming that E can be written as a polynomial function of the sensor temperature, and introducing (2) and (1) yield to a minimization problem that needs to be constrained to avoid any non-physical solution. Figure 1 presents an unexpected increase of uncorrected pressure at Ls~63°, and then a drop, both certainly resulting from a rise of temperature at T = 270K, followed by a decrease of temperature at T = 275K. Based on this observation, we simply assumed that: E(T = 0°C) = 0.
With this constraint, the optimization problem can be solved and a first temporary correction is:
![]()
Applying this correction to InSight measurements following Eq. (2) leads to the results presented in Figure 2.
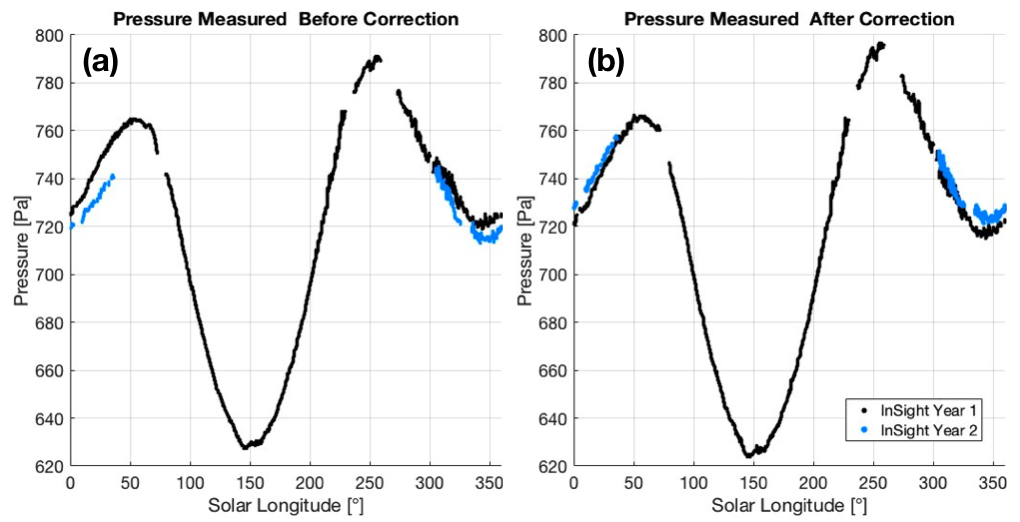
Figure 2. (a) Uncorrected diurnal-averaged surface pressure recorded by InSight during the first and second years of the mission. (b) Diurnal averaged pressure after sensor temperature correction following Eq. (2).
Comparison of the Corrected Pressure and MSL Measurements
To assess the quality of this correction, we interpolate the MSL Measurements from MY35 et MY34 (assuming that MY34 behaves like MY36 for Ls < 70°) to predict the surface pressure at the InSight landing site. MSL measurements are interpolated to the InSight landing site using the hydrostatic correction presented in [7]. Dynamical effects from MSL to InSight landing site are corrected using GCM runs with MY34 and MY35 as input dust scenarios. The comparison is presented in Figure 3 and reveals a good match between the model and the result obtained after correction.
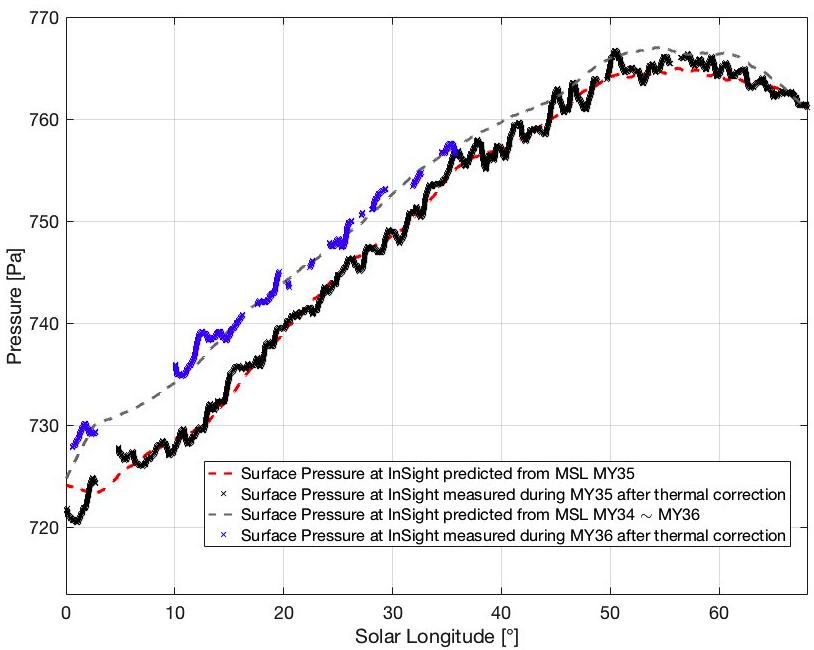
Figure 3. Surface pressure as predicted from the interpolation of MSL REMS measurements, after hydrostatic and dynamic correction (dashed curves) and observations from InSight after thermal correction (crosses). Observations are diurnally-averaged whereas predictions are 10-sols averaged.
Comparison of InSight and Viking 1 Surface Pressure
The comparison between Viking 1 and InSight data after hydrostatic, dynamical, and temperature-induced offset will be presented during the talk. Interpretations and conclusions on a possible secular climate change will be drawn.
References
[1] Malin et al., 2001, Science294(5549), 2146–2148
[2] Thomas et al., 2009, Icarus203, 352–375
[3] Blackburn et al., 2010, Space Sci.58, 780–791
[4] Haberle and Kahre, 2010, Mars Int. J. Mars Sci. Explor5., 68–75
[5] Haberle et al., 2014, J. Geophys. Res., Planets119,440–453
[6] de la Torre Juarez et al., 2019, AGU fall meeting abstracts, Vol. 2019, p. P51C-02
[7] Forget et al., 2007, Planets112(E11), 8
How to cite: Lange, L., Forget, F., Spiga, A., Banfield, D., Millour, E., Newman, C., Pla-García, J., and Viúdez-Moreiras, D.: Comparison of the Seasonal Pressure Variations Recorded by InSight and Viking 1 and Recalibration of InSight Data, European Planetary Science Congress 2021, online, 13–24 Sep 2021, EPSC2021-286, https://doi.org/10.5194/epsc2021-286, 2021.