TP16
Session assets
Please decide on your access
Please use the buttons below to download the presentation materials or to visit the external website where the presentation is linked. Regarding the external link, please note that Copernicus Meetings cannot accept any liability for the content and the website you will visit.
Forward to presentation link
You are going to open an external link to the presentation as indicated by the authors. Copernicus Meetings cannot accept any liability for the content and the website you will visit.
We are sorry, but presentations are only available for users who registered for the conference. Thank you.
Oral and Poster presentations and abstracts
After 17 years in orbit Mars Express remains one of ESA’s most scientifically productive Solar System missions which publication record exceeds 1350 papers. Characterization of the surface geology on a local-to-regional scale by HRSC, OMEGA and partner experiments on NASA spacecraft has allowed constraining land-forming processes in space and time. Recent studies characterized the geology of Jezero crater in great detail and provided Digital Elevation Model (DEM) of several equatorial regions at 50 m/px resolution. New maps and catalogues of surface minerals with 200 m/px resolution were released. MARSIS radar published new observations and analysis of the multiple subglacial water bodies underneath the Southern polar cap. Modelling suggested that the “ponds” can be composed of hypersaline perchlorate brines.
Spectrometers and imagers SPICAM, PFS, OMEGA, HRSC and VMC continued amending the longest record of atmospheric parameters such as temperature, dust content, water vapor and ozone abundance, water ice and CO2 clouds distribution and observing transient phenomena. More than 27,000 ozone profiles derived from SPICAM UV spectra obtained in MY#26 through MY#28 were assimilated in the OpenMARS database. Observed anti-correlation of ozone and water vapor abundance revealed a strong chemical coupling between these two species. A new “scan” mode of the spacecraft was designed and implemented to investigate diurnal variations of the atmospheric parameters. Observations of the atmospheric parameters and their local time variations above Tharsis region and Hellas basin contribute to mesoscale meteorology. Imaging revealed the properties of the elongated orographic cloud at Arsia Mons and other topography highs.
ASPERA measurements together with MAVEN “deep dip” data enabled assessment of the conditions that lead to the formation of the dayside ionopause in the regions with and without strong crustal magnetic fields suggesting that the ionopause occurs where the total ionospheric pressure (magnetic + thermal) equals the upstream solar wind dynamic pressure. First results of active sounding of the local plasma by ASPERA detecting ions accelerated by the MARSIS radar pulses appears promising in the study of plasma composition.
In 2020-2021 Mars Express successfully performed two types of novel observations. In egress-only radio-occultations a two-way radio link was locked at a tangent altitude of about 50 km. This is well below the ionospheric peak and in future would allow perfect sounding of the entire ionosphere thus doubling the number of ionospheric soundings. MEX and TGO performed several UHF radio-occultation tests in preparation for the dual-spacecraft radio-occultation sounding.
Mars Express is extended till the end of 2022. A science case for the mission extension in 2023-2025 will be submitted by the end of 2021. The talk will give the Mars Express status, review the recent science highlights, and outline future plans including synergistic science with TGO.
How to cite: Titov, D., Bibring, J.-P., Cardesin, A., Carter, J., Duxbury, T., Forget, F., Giuranna, M., González-Galindo, F., Holmström, M., Jaumann, R., Määttänen, A., Martin, P., Montmessin, F., Orosei, R., Pätzold, M., Plaut, J., and Sgs Team, M.: Mars Express science highlights and future plans, Europlanet Science Congress 2021, online, 13–24 Sep 2021, EPSC2021-158, https://doi.org/10.5194/epsc2021-158, 2021.
Planetary radar sounders (RS) are spaceborne nadir-pointing instruments operating in High Frequency (HF) or Very High (VHF) frequency bands. Radar signals in these bands can propagate through planetary subsurfaces up to several kilometers. The subsurface structure can be inferred by analyzing the radar echoes recorded by these types of instruments. Planetary RS data have been a valuable information source for analyzing the subsurface of the Moon [1] and Mars [2]. For mechanical reasons, the deployed RS antennas are typically dipoles. Dipoles illuminate a large area of the overlying surface. Hence, the recorded RS data are typically contaminated by unwanted off-nadir surface reflections, considered clutter. However, these unwanted reflections carry valuable information regarding the nature of the probed surface and the shallow subsurface. Recent research has exploited off-nadir reflections for effectively imaging target planetary surfaces. This is achieved by combining the acquired RS data with a suitable digital elevation model (DEM) of the surface and by exploiting multiple orbital passes over the same region. Kobayashi et al. [3] generated images of the Moon surface by exploiting radargrams acquired by the Lunar Radar Sounder (LRS), which operates at 5 MHz central frequency. Carrer et al. [4] exploited SHAllow RADar (SHARAD) data for generating HF roughness images of the surface of Mars. SHARAD operates at 20 MHz central frequency. Both approaches are effective not only in generating higher resolution HF images of the surface with respect to previous work [5] but also in detecting shallow buried features (that are not easily detectable by standard data analysis) [4]. However, both works are focused on the analysis of small regions. The generation of large area images faces challenges that are not usually present when generating smaller images. These challenges are resulting from large variations in (i) the sensor viewing geometry, (ii) the radiometric properties of the surface, and (iii) the non-uniform data availability. Here, we propose an approach to generate large scale radar HF roughness images of Mars starting from the methodology described in [4]. Global surface roughness images can provide additional insights into surface processes and in detecting additional buried geological structures. We extend the original image generation methodology by proposing approaches for reducing the radiometric artifacts and improving the quality of the large-scale image while preserving the fidelity of the contained scientific information. The radiometric artifacts appear as vertical stripes crossing the image due to the orbital variations of the spacecraft among different acquisitions. This typically results in a variation of the spacecraft’s altitude causing a received echo power fluctuation. Therefore, we apply inter-calibration to compensate the losses caused by the actual spacecraft’s altitude and normalize the echo power with a reference altitude. Radiometric compensation is challenging as the recorded echo power from a given surface point exhibits large variations that are function of the radiation incidence angle. This effect is particularly pronounced in RS data as scattering can be both coherent and incoherent. To compensate for this, we fit the recorded echo power as function of incidence angle with a suitable back-scattering model (i.e., Hagfors [5]). The incidence angle power correction is performed iteratively on smaller portions of the image where we can assume that the surface statistical properties belong to the same distribution. Finally, coherent scattering data originating from the first Fresnel zone are discarded as they generate reflections that are difficult to compensate in the large-scale image. Here, we apply the proposed approach to generate Mars global roughness images by using Mars Advanced Radar for Subsurface and Ionosphere Sounding (MARSIS) data in combination with the Mars Orbiter Laser Altimeter (MOLA) digital elevation model. MARSIS operates at a central frequency between 1.8 and 5 MHz. This implies the possibility of generating images at different frequency bands that could provide different information regarding the surface and the shallow subsurface. As MARSIS operates at lower frequencies than SHARAD, we expect that also in this case the generated images contain shallow subsurface information [4]. Fig. 1 shows an example of Mars HF roughness image at 4 MHz obtained by the proposed methodology over Arabia Terra and Syrtis Major quadrangles. The pixel resolution is 463 m x 463 m. Large intensity pixels correspond to higher surface roughness with respect to the small intensity ones. The results confirm the effectiveness of the approach, where the presence of the radiometric artifacts is minimized while preserving the scientific information integrity. The image contains several detailed surface features such as the area of Mamers Valles shown in Fig. 2. The system of fretted channels appears with an unusual very low roughness in the image with respect to the surroundings. Investigations are in progress to fully understand the origin of this radar response. Roughness images can also be used for better outlining geological units and could help in identifying shallow buried geological formations on a global scale.
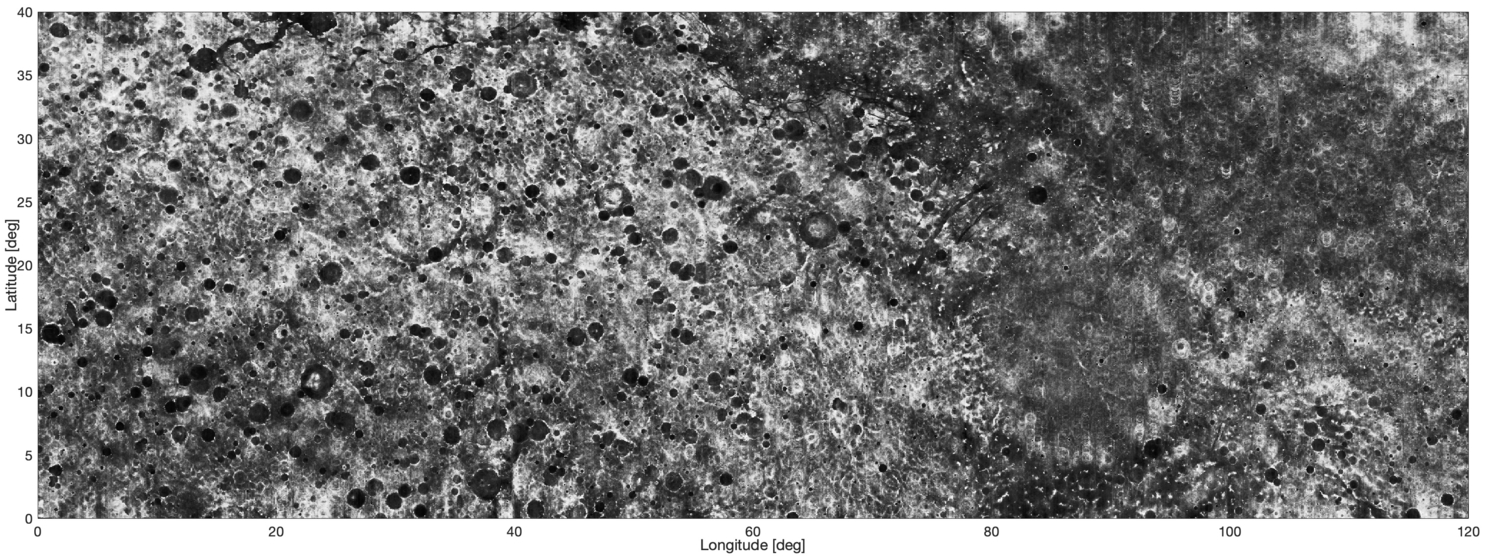
Figure 1. Mars HF Surface roughness image of Arabia Terra and Syrtis Major quadrangles obtained with the proposed method by exploiting MARSIS data at 4 MHz.
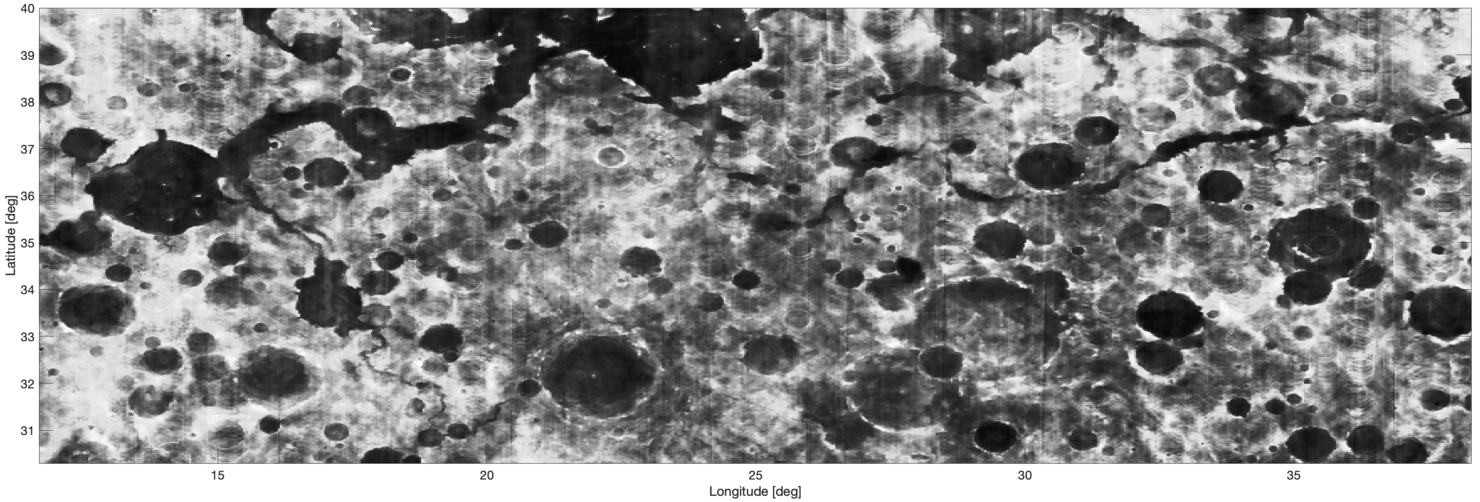
Figure 2. Detailed Mars HF Surface roughness image of Mamers Valles obtained with the proposed method by exploiting MARSIS data at 4 MHz.
REFERENCES
- [1] Ono, et al., “Lunar radar sounder observations of subsurface layers under the nearside maria of the moon,” Science 323(5916), 909–912 (2009).
- [2] Picardi, et al., “The mars advanced radar for subsurface and ionosphere sounding (MARSIS): concept and performance,” in IEEE 1999 International Geoscience and Remote Sensing Symposium. IGARSS’99 (Cat. No. 99CH36293), 5, 2674–2677, IEEE (1999).
- [3] Kobayashi, et al., “Hf (5 MHz) imaging of the moon by Kaguya lunar radar sounder off nadir echo data,” IEEE Transactions on Geoscience and Remote Sensing 56(7), 3709–3714 (2018).
- [4] Carrer, L., et al., “Mars surface imaging by exploiting off-nadir radar sounding data,” IEEE Transactions on Geoscience and Remote Sensing (2020).
- [5] Campbell, et al., “Roughness and near-surface density of mars from SHARAD radar echoes,” Journal of Geophysical Research: Planets 118(3), 436–450 (2013).
How to cite: Hoyo García, M., Carrer, L., Bruzzone, L., and Bovolo, F.: Generation of Global Surface and Shallow Subsurface Images of Mars by Radar Sounders Data, Europlanet Science Congress 2021, online, 13–24 Sep 2021, EPSC2021-319, https://doi.org/10.5194/epsc2021-319, 2021.
Introduction: Dust has different impacts on the physics operating on Mars. On the surface, dust, which is a high albedo material, can settles in inhomogeneous and unstable layers. If an area gets covered by dust, local albedo increases which changes the surface heat balance. Possible thermic contrasts between areas with two different albedos may then initiate wind and turbulence, which can send dust back into the atmosphere where it also impacts heat balance and circulations. Dust movements on Mars involve different spatial scales, from planet-scale atmospheric circulation during global dust storm to small-scale phenomena such as RSL, where changing albedo contrast may be both a consequence (dust removal) and a cause (wind initiation) of dust activity. In this work, we derive seasonal maps of atmospheric dust content over 3 Martian years using the OMEGA dataset. We then study the possible correlations between atmospheric dust activity and surface movements of dust at recurring slope lineae (RSL).
Data and Method: For this study, we use OMEGA [1] which is an imaging spectrometer onboard MarsExpress orbiter. More precisely, we focus on the near-infrared channel of the instrument. This dataset is well-suited for the study of dust dynamics as it combines a near-global spatial coverage of Mars, with a typical sampling of 1 km, to an observation period covering 3 Martian Years (2004-2010), including a global dust storm and surrounding years.
To study atmospheric dust dynamics at regional and global scale, we have developed a new method based on the 2 µm carbon dioxide (CO2) absorption band reduction. CO2 is the most abundant element on the Martian atmosphere (approx. 96%), so this band is fairly deep. Thus, when aerosols (e.g. dust) are in the atmosphere, the light travel is reduced, and the absorption band is less deep [2]. To notice a reduction of this band, we had to develop a physical model (described in [2]), to predict the 2 µm absorption band depth, that has been calibrated with OMEGA observations selected to have low dust load of the atmosphere.
As a result, we automatically compute the CO2 optical depth (from the 2 µm absorption band) predicted value (τprediction) and the observed value (τ). This allows us to work on the entire OMEGA dataset (about 8,300 observations) and make a global monitoring of the dust impact on the CO2 optical depth. For that, we defined an atmospheric dust index (Δτ/τ), which is the ratio of difference between τprediction and τ by τ.
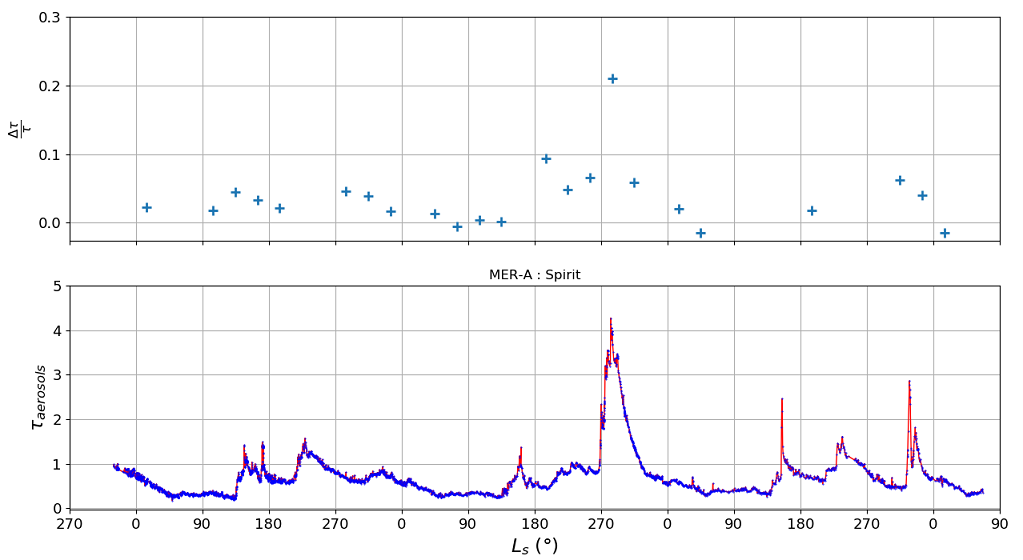
Figure 1: The time evolution of the difference between observed and predicted CO2 optical depth by the observed value (top graph), and the aerosol optical depth recorded by the MER-A (Spirit) rover. The first Ls=0° mark the beginning of the MY27.
Results and Discussion: We have first compared our dust index to ground truth concomitant measurements by the Mars Exploration Rover (MER). The aerosols optical depth temporal profile of the MER-A rover (Spirit) [3] is represented on the bottom of figure 1 and the Δτ/τ profile (of the MER area) on the top. We can notice a good temporal correlation with our dust index, notably during the global dust storm (Ls∼240° in MY28) or the clear atmosphere season (Ls=0-140°). This method allows the recovery of the seasonal variations in atmospheric dust.
Figure 2: A global map of our atmospheric dust index (Δτ/τ) constructed from observations with an Ls range between 300° and 360° of all the OMEGA Martian years of observation except MY28 (global dust storm).
We have then constructed global seasonal maps of atmospheric dust index, one of which is in figure 2 and covers a solar longitude range between 300° and 360°. This Ls range frames “C storms” as defined by [4], which could be correlated to some RSL activity at Hale crater [2]. We identify higher values of Δτ/τ located in the southern hemisphere, and also in and around Hellas. Another area of high atmospheric dust index is observed from 300°E to 350°E and 0°N to 60°N (Chryse and Acidalia Planitia), which corresponds to the main RSL area of the northern hemisphere (“CAP” area, see [5]). At this location RSL lengthening rates are maximum over that Ls range according to [5]. This suggests a spatial and time correlation between the amount of atmospheric dust and northern RSL.
Conclusion: We have developed a new method to characterize the atmospheric dust, based on the 2 µm CO2 absorption band. The application of this method to the entire OMEGA dataset allows to reproduced the well-known dust seasonal variability by comparing to the MER data (ground measurements). A seasonal map of our atmospheric dust index allows to find regions of dust storms, and reveal spatial and temporal correlation with some RSL sites.
Acknowledgments: The OMEGA/MEx data are freely available on the ESA PSA at https://archives.esac.esa.int/psa/#!Table%20View/OMEGA=instrument.
References: [1] Bibring J-P. et al. (2004) ESA Publication Division, 1240, 37-49. [2] Leseigneur Y. et al. (2021) 52nd LPSC, No. 2548, id. 1471. [3] Lemmon M. T. et al. (2015) Icarus, 251, 96-111. [4] Kass D. M. et al. (2016) Geophys Res. Lett., 43, 6111-6118. [5] Stillman D. E. et al. (2016) Icarus, 265, 125-138.
How to cite: Leseigneur, Y., Vincendon, M., and Stcherbinine, A.: Global monitoring of atmospheric dust with OMEGA/MarsExpress over 2004-2010., Europlanet Science Congress 2021, online, 13–24 Sep 2021, EPSC2021-568, https://doi.org/10.5194/epsc2021-568, 2021.
Abstract
We present a new type of observations (scan mode) to study of atmospheric parameters varying with LT over volcanoes in the Tharsis region. Atmospheric parameters include vertical temperature profiles, total dust, water ice opacities and surface temperatures.
- Introduction
Atmospheric thermal fields can be used to study the planetary boundary layer and local circulation around volcanoes. The depth of the planetary boundary layer can be estimated from a behavior of atmospheric temperatures. It turns out that the depths of the planetary boundary layer are larger over the Tharsis than over the other regions [1]. Here, we report the LT variations of dust and water ice opacities along with atmospheric and surface temperatures. In the future we will investigate the behavior of the planetary boundary layer with LT and thus the local circulation around volcanoes by means of atmospheric temperatures obtained from PFS observations.
- Results
Figure 1 presents a thermal field from the surface to around 60 km of altitude around Olympus Mons for measurements from orbit 21202. Atmospheric temperatures are plotted as a function of LT, pressures and altitudes. The track of this orbit is given in Figure 2 with variations of surface temperatures along the orbit. Figure 1 illustrates a hot structure along the west slope and less over the south side of Olympus Mons. We observe a cold structure over the highest sounded point, close to the top of the volcano, above 10 km of altitude. Dust opacities along the orbit are around 0.2. The dust opacity varies a little with LT close to the volcano. A water ice opacity around 0.06 is observed over the highest sounded altitude. The surface temperatures increase with LT. It only decreases along slopes to reach 260 K instead of 270 K in the west valley. A region of the south-eastward of the volcano has the maximum of surface temperatures.
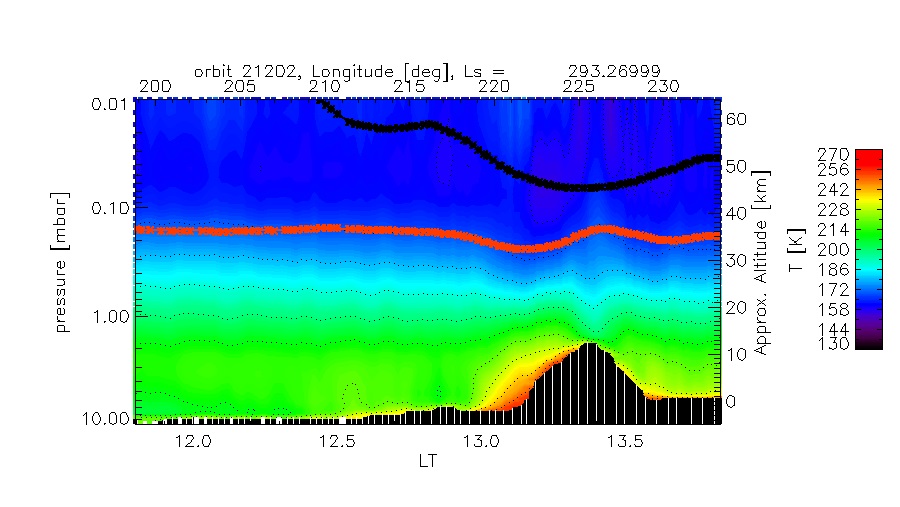
Figure 1: Thermal structures over Olympus Mons (orbit 21202) with dust and water ice opacities plotted as lines with asterisks (red – dust, black – water ice). Y axis is also dedicated to the range of opacities.
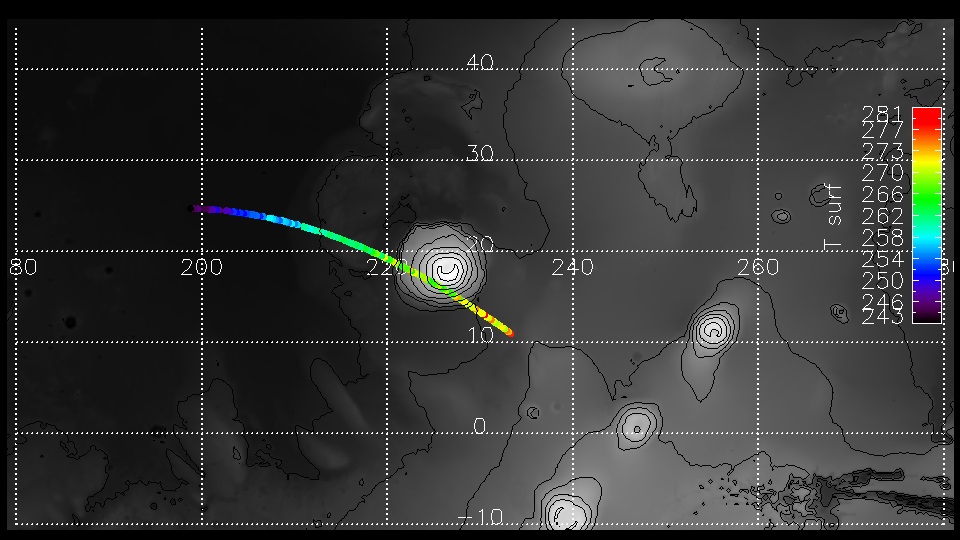
Figure 2: The track of orbit 21202 with surface temperature variations along this orbit.
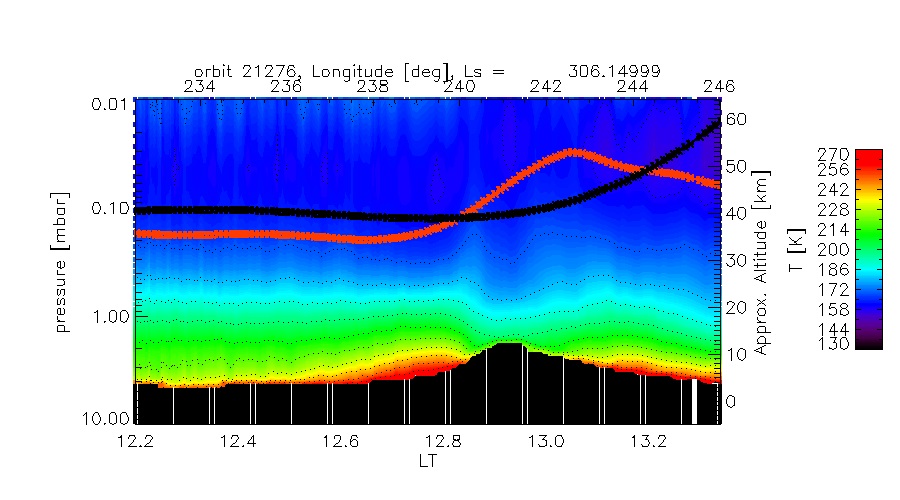
Figure 3: Thermal structures over Arsia Mons and Pavonis Mons (orbit 21276) with dust and water ice opacities plotted as red and black lines, respectively. Y axis is also dedicated to the range of opacities.
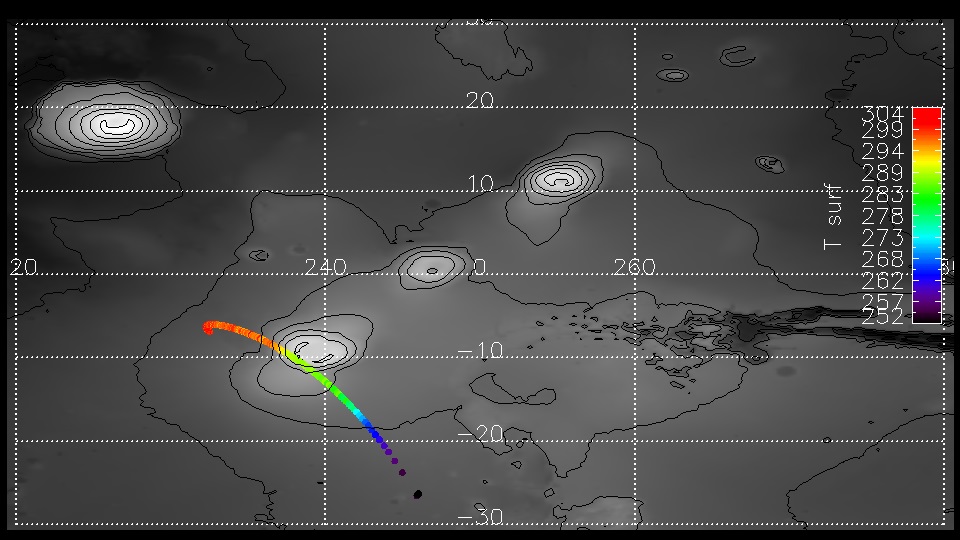
Figure 4: The track of orbit 21276 with surface temperature variations along this orbit.
Figure 3 presents thermal structures but over Arsia Mons. Again we observe the hot structure over the valleys and slopes. And on the contrary to the slopes we observe the cold atmosphere over 10 km of altitude, close to the top of the volcano. Dust opacities are around 0.2 on the west side of the volcano. They decrease with increasing LTs southward of the volcano. The similar behavior is observed for water ice opacities. The track of the orbit 21276 is given in Figure 4 along with variations of surface temperatures. However, the surface temperatures decrease with the increasing LTs. It is due to the emission angles larger than 70°.
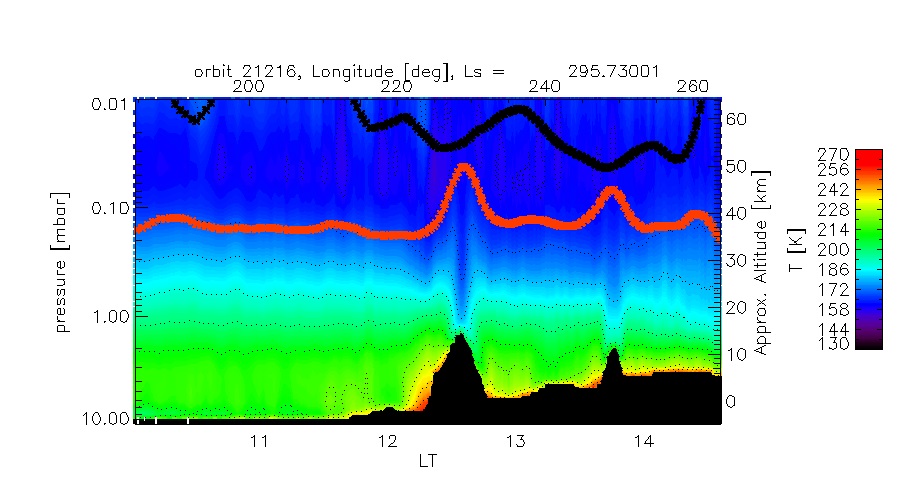
Figure 5: Thermal structures over Olympus Mons and Pavonis Mons (orbit 21216) with dust and water ice opacities plotted as red and black lines, respectively. Y axis is also dedicated to the range of opacities.
Figure 5 also presents thermal structures over Olympus and Pavonis Mons. The atmospheric temperatures are large close to the valleys and slopes with respect to the cold structure close to the top of volcanoes. Dust opacities are around 0.15 but they show minima over the top of the volcanoes. This means that the most dust is suspended in atmospheric layers in valleys. The summits are rid of the dust. The largest value of water ice opacity is around 0.04 and is within the retrieval error.
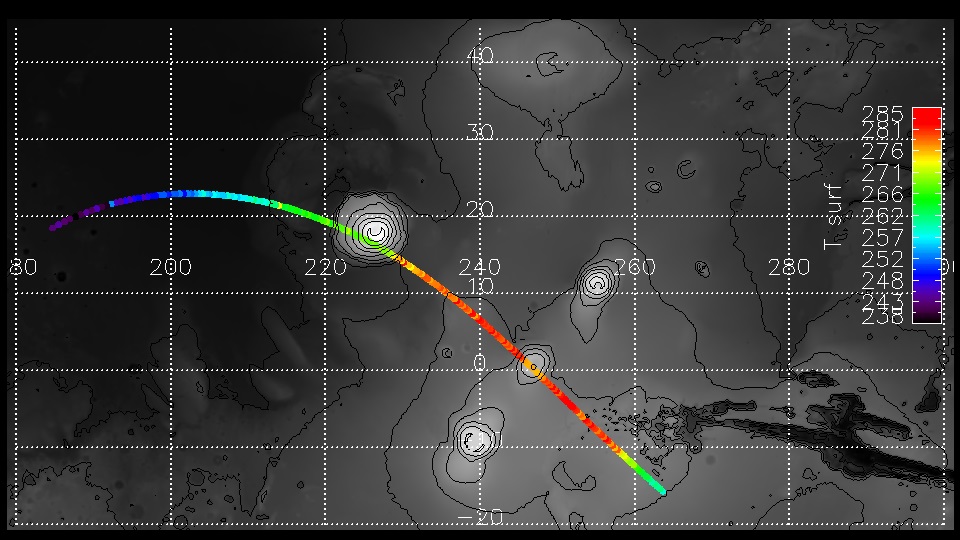
Figure 6: The track of orbit 21216 with surface temperature variations along this orbit.
Figure 6 shows the track of orbit 21216. A variation of surface temperatures is shown along this orbit in Figure 6. The surface temperatures increase with increasing LTs. Only, at the end of orbit, at around 260°E surface temperatures decrease because of the emission angles larger than 70°. A drop of surface temperatures by 10 K is also found over the Pavonis Mons summit.
- Summary and Conclusions
We exploit the new type of observations to study the LT variations of atmospheric parameters. We investigate atmospheric thermal fields along with variations of dust and water ice opacities over volcanoes. We find the cold atmosphere over the tops of the volcanoes and the hot structures over the slopes and in valleys during early afternoon hours. In orbit 21216 we observe dust minima over the summits of the volcanoes. The water ice opacity is around 0.1 on the west side of Arsia Mons.
Acknowledgements
Authors would like to thank to all SGS team especially Alejandro Cardesin Moinelo, Julia Marin-Yaseli de la Parra and Donald Merritt for the implementation of new type of observations.
References
[1] Hinson D.P. et al., The martian daytime convective boundary layer: Results from radio occultation measurements and a mesoscale model, Icarus, 326, (2019), 105 – 122.
How to cite: Wolkenberg, P. and Giuranna, M.: Study of atmospheric parameters varying with LT around volcanoes from PFS observations, Europlanet Science Congress 2021, online, 13–24 Sep 2021, EPSC2021-805, https://doi.org/10.5194/epsc2021-805, 2021.
In this contribution we provide an update of the observations performed simultaneously (or quasi-simultaneously) by the two European satellites around Mars: Mars Express (MEX) and ExoMars 2016 Trace Gas Orbiter (TGO).
The scientific objectives of both MEX and TGO missions are very complementary and there is a lot of synergy between the science teams, especially for the study of the atmosphere. Since the start of the TGO science operations in April 2018 we have executed hundreds of coordinated observations of the Martian atmosphere, first reported in [1] and now extended here. The science data obtained during these coordinated observations, both in sun occultation and nadir geometry, provide useful input for cross-calibration of the instruments, comparison of atmospheric vertical profiles and potential for the study of the temperature, composition, meteorology and climate of Mars.
These observations are routinely coordinated by the instrument teams, in particular the spectrometers NOMAD and ACS onboard TGO [3,4] and SPICAM, OMEGA and PFS onboard MEX [5,6,7] and the Science Operations Centers (SOCs) of both missions [1, 2]:
- MEX-TGO Sun Occultations (within 15min and distance <1000km)
- MEX-TGO Nadir crossings (simultaneous, within <5deg seen from Mars center)
- MEX Nadir over TGO Sun Occultation point (simultaneous within distance <500km)
- MEX-TGO Radio Occultation points (preliminary testing during 2021)
Vertical profiles of the atmosphere are observed during solar occultations by the spectrometers SPICAM (MEX) and ACS-NOMAD (TGO) for both ingress and egress points (i.e. dusk and/or dawn terminator). We report here the quasi-simultaneous observations (<15minutes difference) in the same region of the planet (<1000km distance). In nadir geometry, we observe regularly with all spectrometers and have so far performed hundreds of simultaneous observations of the crossing points (where both spacecraft are <5deg as seen from Mars) and quasi-simultaneous observations of the same location within a few minutes difference, at various distances and illumination conditions. With Mars Express we have also observed directly in nadir geometry the solar occultation point seen by Trace Gas orbiter (Fig.1), allowing to retrieve nadir temperature measurements at the same time of the solar occultation vertical profile. Finally, we have also started the preliminary testing for spacecraft-to-spacecraft radio occultations, that may in the future provide useful information of the ionosphere.
Figure 1. MEX Nadir over TGO Sun Occultation point
The authors acknowledge the contributions of the European Space Agency, Roscomos, all National Agencies, research institutions and teams involved in the success of the Mars Express and ExoMars 2016 missions. ExoMars is a space mission of the European Space Agency (ESA) and Roscosmos (Russia).
References:
[1] Cardesin Moinelo, A. et al: First year of coordinated science observations by Mars Express and ExoMars 2016 Trace Gas Orbiter, ICARUS 353, 2021
[2] Geiger, B et al: Long Term Planning for the ExoMars Trace Gas Orbiter Mission: Opportunity Analysis and Observation Scheduling, Proceedings of SpaceOps Conference, 2018
[3] Vandaele, A. C. et al: NOMAD, an Integrated Suite of Three Spectrometers for the ExoMars Trace Gas Mission: Technical Description, Science Objectives and Expected Performance, Space Sci Rev 214: 80. 2018
[4] Korablev, O. et al: The Atmospheric Chemistry Suite (ACS) of Three Spectrometers for the ExoMars 2016 Trace Gas Orbiter Space Sci Rev 214: 7. 2018
[5] Montmessin et al, SPICAM on Mars Express: A 10 year in-depth survey of the Martian atmosphere. Icarus, Volume 297, p. 195-216. 2017
[6] Bibring, J.-P., et al., OMEGA: Observatoire pour la Minéralogie, l’Eau, les Glaces et l’Activité, ESA SP-1240, pp. 3–16. 2004
[7] Formisano V. et al: The Planetary Fourier Spectrometer (PFS) onboard the European Mars Express mission, Planetary and Space Science, Volume 53, Issue 10, p. 963-974. 2005
How to cite: Cardesin-Moinelo, A., Geiger, B., Lacombe, G., Ristic, B., Wolkenberg, P., Gondet, B., Svedhem, H., Titov, D., Martin, P., Marin-Yaseli de la Parra, J., and Merritt, D. and the Mars Express and ExoMars Trace Gas Orbiter Science Operations Centres: Atmospheric observations performed simultaneously in 2020-2021 by ESA’s Mars Express and Trace Gas Orbiter, Europlanet Science Congress 2021, online, 13–24 Sep 2021, EPSC2021-128, https://doi.org/10.5194/epsc2021-128, 2021.
Conventional Radio Occultation measurements take place between a spacecraft in orbit around a planet (or during an occasional fly-by), and a receiving ground station on the Earth. When the straight line between the sender and receiver crosses the ionosphere and the atmosphere of the planet the signal is affected by the electrons in the ionosphere and the molecules in the neutral atmosphere. This signal change is observed as a slight frequency shift in the received radio signal with respect to the transmitted signal. The shift is very small compared to the Doppler shift in the frequency due to the differential relative velocity of the spacecraft and the Earth, but can for a stable system be isolated, and profiles of electron density in the ionosphere and profiles of atmospheric density in the neutral atmosphere can be derived.
Here we are attempting to do occultation measurements between two spacecraft at Mars, Mars Express and ExoMars Trace Gas Orbiter, using the UHF link normally used for communicating between the orbiters and the landers on the surface of Mars, rather than using the X- or S-band transmitter used for the communication between a spacecraft and the Earth. This was first exercised between NASA’s Odyssey and MRO at three occasions in 2007 (Ao, et al., Radio Sci., 2015), but has not been repeated since then.
Such a Mutual Occultation technique has several significant advantages over the traditional spacecraft to Earth occultation measurements. In particular, it allows a much more even distribution of the samples over the surface of the planet and in time, and the observations are independent of Earth occultation seasons. Due to the short period of the orbit of TGO many occultations take place every day. The distance between the two spacecraft is much smaller than the distance to the Earth and therefore a much higher signal to noise ratio can be achieved, resulting in very low statistical errors. The Mutual Occultation s/c to s/c link also avoids that the signal passes through the Earth’s ionosphere and atmosphere. The compensation for the Earth atmosphere and ionosphere is far from perfect and results in major contributions to the systematic errors. An additional positive effect is that the interplanetary plasma disturbance to the signal is a minimum due to the short distance between the two s/c and the large distance from the Sun.
The first experiment was carried out on the 2nd of November 2020 and demonstrated the feasibility of the technique. Several more experiments took place during November-December. These initial test used a lander (Beagle2) hail signal from Mars Express/Melacom, consisting of a series of 20 seconds of modulated and unmodulated transmissions interspersed with 2 seconds without transmission. In March 2021 a software update was applied to Melacom, which allowed it to generate an uninterrupted, unmodulated carrier-only signal, since. This has improved the performance and the quality of the measurements significantly. To date four passes with this improved performance have been executed. These data are presently being analysed. This presentation will summarise recent simulations and show the latest results from these new experimental measurements.
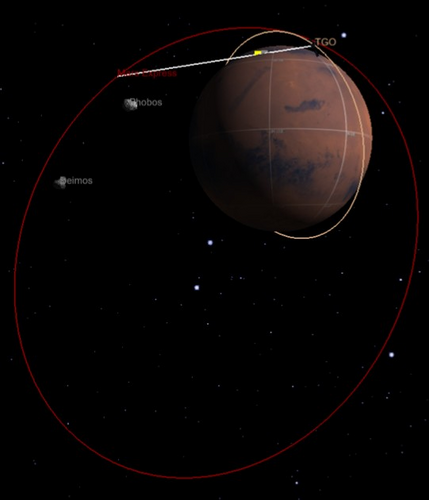
Example of Occultation Geometry: The orbits of TGO and MEX are indicated by tan respective red lines and the direct path of the radio signal is indicated by a white line. The part of the propagation through the atmosphere is indicated by a yellow box.
How to cite: Svedhem, H., Parrott, J., Witasse, O., Titov, D., Cardesin, A., Geiger, B., Martin, P., Denis, M., Godfrey, J., Schmitz, P., Wood, S., Reboud, O., and Nava, B.: First results from the MEX – TGO Mutual Radio Occultation Experiment, Europlanet Science Congress 2021, online, 13–24 Sep 2021, EPSC2021-719, https://doi.org/10.5194/epsc2021-719, 2021.
The NOMAD (“Nadir and Occultation for MArs Discovery”) spectrometer suite on board the ExoMars Trace Gas Orbiter has been designed to investigate the composition of Mars' atmosphere, with a particular focus on trace gases, clouds and dust. The instrument probes the ultraviolet and infrared regions covering large parts of the 0.2-4.3 µm spectral range [1,2], with 3 spectral channels: a solar occultation channel (SO – Solar Occultation; 2.3–4.3 μm), a second infrared channel capable of nadir, solar occultation, and limb sounding (LNO – Limb Nadir and solar Occultation; 2.3–3.8 μm), and an ultraviolet/visible channel (UVIS – Ultraviolet and Visible Spectrometer, 200–650 nm). Since its arrival at Mars in April 2018, NOMAD performed solar occultation, nadir and limb observations dedicated to the determination of the composition and structure of the atmosphere.
NOMAD has been accumulating data about the Martian atmosphere and its surface since its insertion. We will present some results covering the atmosphere composition including clouds and dust, climatologies of water, carbon monoxide and ozone. We also report on the different discoveries highlighted by the instrument by pointing to a series of contributions to this conference that will present in detail several specific studies, like recent progress in the instrument calibration, the latest CO2 and temperature vertical profiles, studies of aerosol nature and distribution, water vapor profiles and variability, carbon monoxide vertical distribution, dayglow observations; detection of HCl, its vertical profiles and in general advances in the analysis of the spectra recorded by the three channels of NOMAD.
References
[1] Vandaele, A.C., et al., 2015. Planet. Space Sci. 119, 233-249.
[2] Vandaele et al., 2018. Space Sci. Rev., 214:80, doi.org/10.1007/s11214-11018-10517-11212.
How to cite: Vandaele, A. C., Daerden, F., Thomas, I. R., Aoki, S., Depiesse, C., Erwin, J., Neary, L., Piccialli, A., Ristic, B., Robert, S., Trompet, L., Viscardy, S., Willame, Y., Gérard, J.-C., Villanueva, G., Mason, J., Patel, M., Bellucci, G., Lopez-Valverde, M., and Lopez-Moreno, J.-J.: The Martian environment observed by NOMAD on ExoMars Trace Gas Orbiter, Europlanet Science Congress 2021, online, 13–24 Sep 2021, EPSC2021-510, https://doi.org/10.5194/epsc2021-510, 2021.
Introduction
NOMAD is a three-channel spectrometer on the ExoMars 2016 Trace Gas Orbiter. The NOMAD solar occultation (SO) channel has been operating around Mars since April 2018 [1]. In the past three years of science operations, we have performed many calibrations and have taken millions of spectra. This huge dataset allows us to continue to refine the calibration, through additional characterisation of the optical elements, detector performance and temperature-induced effects.
SO channel
By using an Acousto-Optic Tunable Filter (AOTF) in combination with an echelle grating spectrometer, the SO channel is able to operate at unprecedented spectral resolution – typically 0.15 to 0.25 cm-1 [2] – and is therefore able to measure trace gases and set stringent upper limits on the presence (or non-presence) of organic molecules in the Martian atmosphere [3].
In solar occultation mode, the Sun is used as the illumination source, meaning that very high Signal-to-Noise Ratios (SNRs) can be achieved, typically up to 2,000 for a single spectrum at the top of the atmosphere. The SO channel records 24 spectra per second in solar occultation mode, with a typical vertical sampling resolution (i.e. altitude difference between consecutive spectra) of around 50-150m [4]. Therefore, by binning multiple spectra together, the SNR can be increased significantly whilst still keeping a high vertical sampling resolution.
Calibration
However the AOTF-grating combination also presents additional challenges, as the optical properties of both elements must be independently characterised in order to correctly retrieve atmospheric gas concentrations. Analysis of the AOTF shape and sidelobes, and the Instrument Line Shape (ILS), are ongoing in several of the groups within the NOMAD team. Additional systematic effects have also been identified in the spectra e.g. [5] which hamper efforts to further increase SNR and thus reduce detection limits via binning. Whilst much calibration work on this has already been performed [2, 4], the calibration can still be improved and work is ongoing to understand these effects and how to remove them from the data.
Applications
Since the beginning of the mission, a particular emphasis has been placed on making observations of CH4 around Gale Crater, in both nadir and solar occultation modes. HCl detections observations are now also made regularly, following the discovery of HCl in the atmosphere [7, 8] and its isotopologue [5], which are close to the detection limit of the channel. Calibration improvements will allow us to further constrain the CH4 upper detection limit, observe lower concentrations of HCl, and further constrain the isotopic ratio.
References
[1] Vandaele, A. C. et al (2015) Planet. Space Sci., 119 ; [2] Liuzzi, G. et al. (2019) Icarus, 321 ; [3] Knutsen, E. W. et al. (2021), Icarus, 357 ; [4] Thomas, I. R. et al. (submitted 2021) “Calibration of NOMAD on ExoMars Trace Gas Orbiter: Part 1 – the SO channel”; [5] Liuzzi G. et al (2021) GRL 48(9); [6] Korablev, O. et al. (2021) Science Advances, 7(7); [8] Aoki, S. et al. (accepted 2021) “Annual appearance of hydrogen chloride on Mars and a striking similarity with the water vapor vertical distribution observed by TGO/NOMAD”, GRL.
How to cite: Thomas, I., Aoki, S., Trompet, L., Erwin, J., Villanueva, G., Liuzzi, G., Lopez-Valverde, M., Brines, A., Funke, B., Vandaele, A. C., Robert, S., Daerden, F., Ristic, B., Lopez-Moreno, J. J., Bellucci, G., and Patel, M.: Calibration of the Nomad SO Channel on ExoMars Trace Gas Orbiter, Europlanet Science Congress 2021, online, 13–24 Sep 2021, EPSC2021-504, https://doi.org/10.5194/epsc2021-504, 2021.
Calibration of the NOMAD-LNO channel onboard ExoMars 2016 Trace Gas Orbiter using solar spectra
Cruz Mermy (1), F. Schmidt (1), I. R. Thomas (2), F. Daerden (2), B. Ristic (2), M. R. Patel (3,4), J.-J. Lopez-Moreno (5), G. Bellucci (6), A. C. Vandaele (2) and the NOMAD Team
Introduction
The LNO channel is a compact high-resolution echelle grating spectrometer with an acousto-optic tunable filter (AOTF) working in the infrared domain from 2.3 μ m to 3.8 μ m (4250-2630 cm -1 ) with a resolving power ( λ / Δ λ ) of around 10000, specially designed for nadir observation. With such high resolving power combined with the near-circular orbit of TGO that allow completion of 12 orbits in one sol, promoting a global coverage of the planet, the NOMAD-LNO instrument fits in with the science objective of the ExoMars program [Vandaele2015, Vandaele2018] and is perfectly suited to study the martian surface and atmosphere. The main objective here is to propose an original calibration procedure, adaptable for the full dataset of NOMAD-LNO. This calibration is complementary to the one proposed by [I.R.Thomas2021] in the sense that we will not assume the temporal stability of the instrument here. Our approach is thus able to test the temporal stability of the instrument in front of degradation by energetic particles. This approach will be based on an empirical continuum removal to take into account the departure between actual blaze function and theoretical one.
Dataset
The NOMAD-LNO fullscans is a solar observation made for calibration purposes. The instrument, normally in nadir position, is pointing toward the sun. The choice of using solar fullscans was made for two reasons: first, there are not enough miniscans to cover all diffraction orders with a significant amount of data while fullscans always cover the whole spectral range which allows testing the time dependence of the calibration. Second, it is important to estimate the instrumental sensitivity over the whole diffraction order range. As of June 2020, six solar calibrations have been performed. Typical fullscan observation is shown in figure 1 the x-axis is the spectel number, the y-axis is the diffraction order (i.e. the AOTF frequency) and the z-axis shows the sensitivity of the detector (in ADU for Analog to Digital Units).
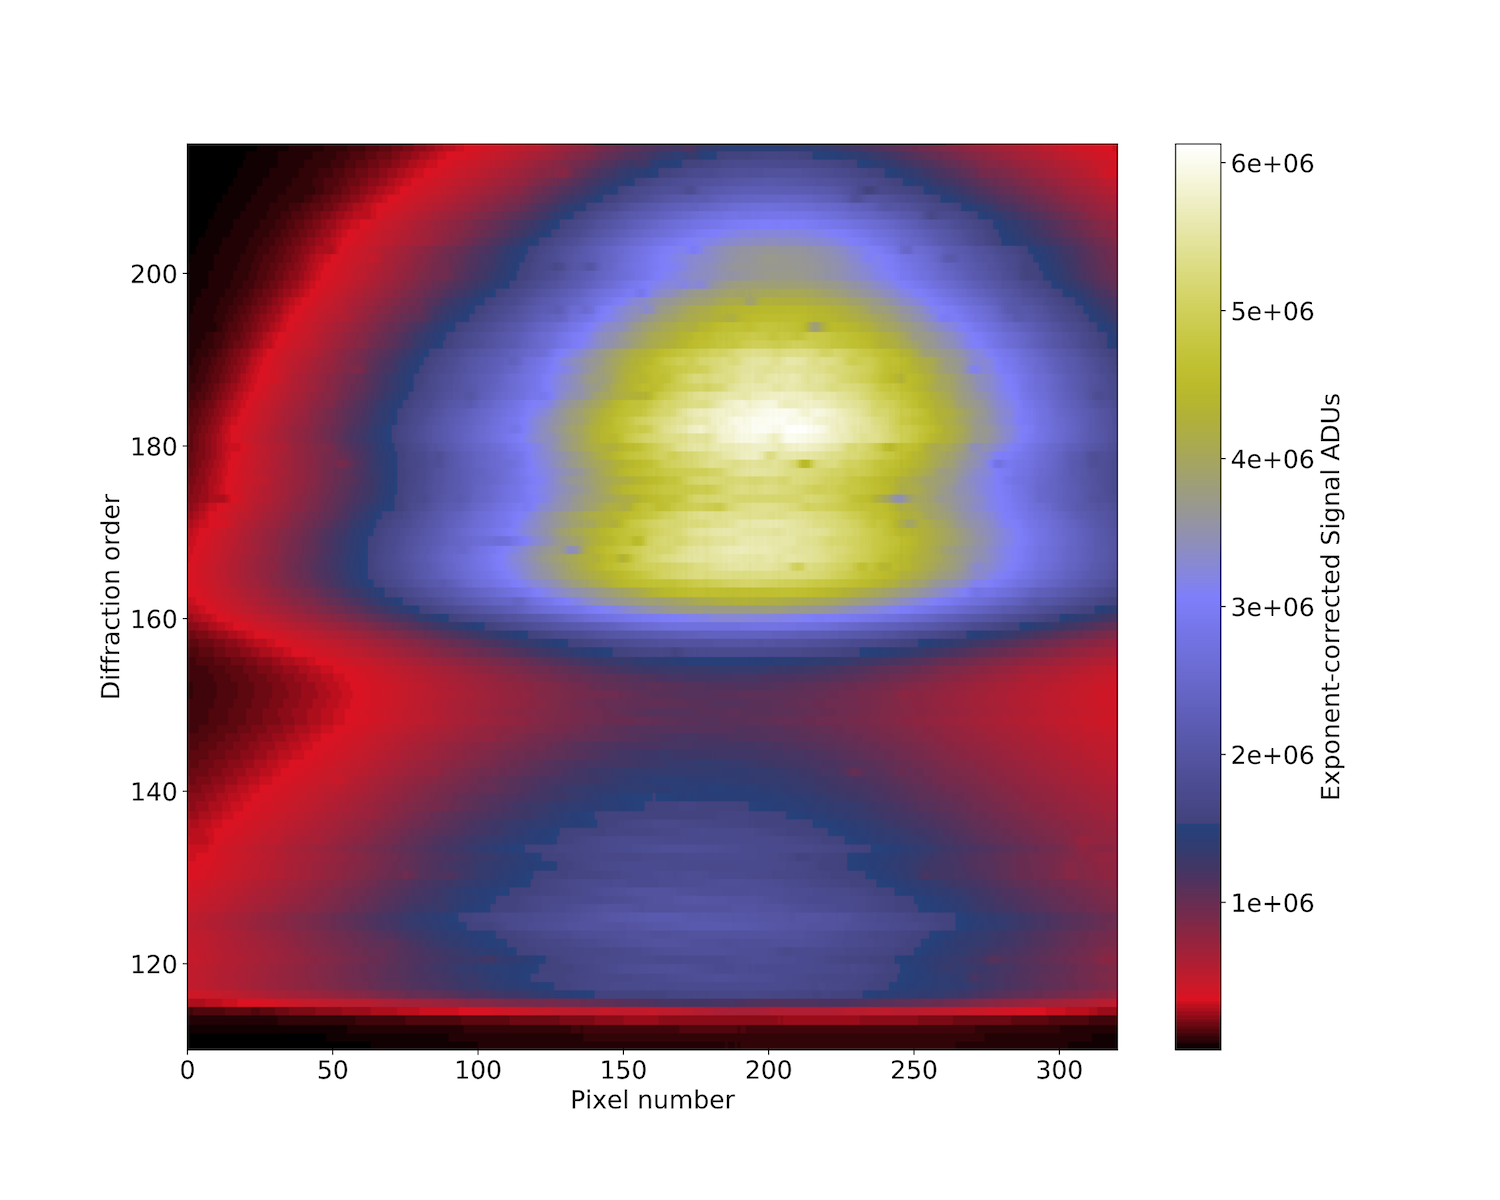
Figure 1- Example of a typical NOMAD-LNO solar fullscan (observation of 2019-03-14).
Method
The calibration aims to build a model to estimate the spectral conversion (wavenumbers in cm -1 for each spectels of the detector) and the photometric sensitivity (conversion factor from ADU to spectral radiance). The model must be versatile enough to face the uncertainties of some instrumental functions, such as the AOTF transfer function and the grating blaze function. The method used here is based on the usual comparison between a real solar observation and a simulated solar spectrum. The observation is LNO solar fullscans and we aim to simulate the same observation by accounting for the AOTF and grating effects using the synthetic solar spectrum. The comparison is done after spectra continuum correction to work out the baseline uncertainties. This approach is of particular importance for correct calibration of nadir data, for which there is no observation free of atmospheric absorption [Liuzzi2019]. The calibration steps we perform are the following :
- First-order spectral calibration: conversion of detector spectel number and diffraction order to wavenumber
- Calibration inversion, by minimizing the residue between observation and simulation, following these steps:
- Application of the grating blaze function and AOTF transfer function shape
- Simulation of the Instrument Line Shape (ILS)
- Integration of a residual wavenumber shift
- Continuum removal to remove the shape imposed by the instrumental functions
- Normalization and estimation of the sensitivity
- Computation of the residue
- By construction, the result of the minimization leads to the estimation of the instrumental sensitivity
Results
The main objective of the model is to establish the conversion factor from the measured ADU by the detector to spectral radiance. This step is done on all spectra of all fullscan so that we can look at the potential variations of this factor during the mission. Figure 2 shows the sensitivity curves of the LNO channel estimated estimate for each fullscans. These differences between fullscans can be explained in many ways and one of the advantages of this calibration method is to be able to test the dependence of the sensitivity such as a function of time, of the Mars-Sun distance, or the temperature. Here we demonstrate that temperature dependence is the dominant one. Looking at all sequences together, we found a linear relationship for each diffraction order that can be used to correct the temperature when calibrating any nadir observations.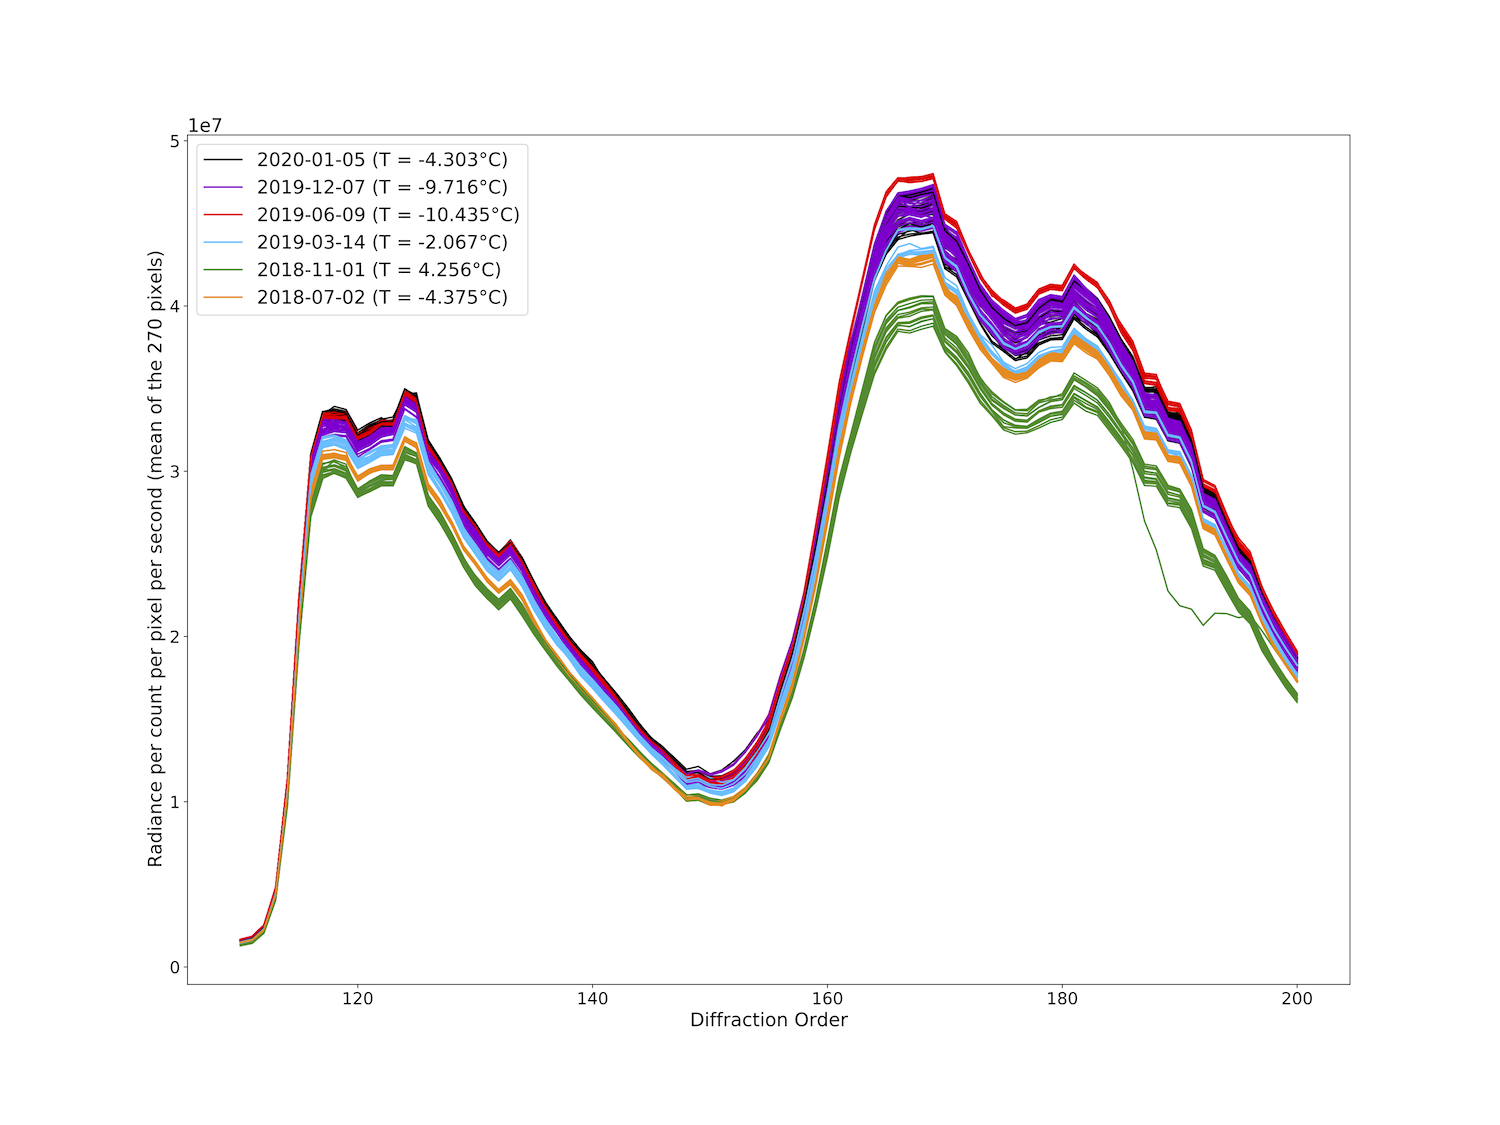
Figure 2 - Radiance to counts conversion for diffraction orders 110 to 200 retrieved from the calibration.
Conclusion
We propose an alternative calibration method for the LNO data using reference solar spectra with the advantage to estimate temporal and temperature dependence. The method is based on the adjustment of a synthetic spectrum to the solar data acquired with NOMAD-LNO fullscan operation mode, which allows a calibration over the whole spectral range of the instrument (different orders), using an analytical model that simulate the instrumental effects. To realize this calibration, we propose to focus on the level and the fine solar bands shape and remove the continuum. This strategy allows to correct of unknowns in the instrumental AOTF/blaze functions but could possibly remove the large spectral feature of the order. However, by performing the same continuum removal to the synthetic data, it is possible to compare synthetic and observation data without bias [Villanueva2021, Knutsen2021]. In addition, this method makes it possible to test the correlations between sensitivity and instrumental parameters (AOTF shape, ILS, wavenumber shift), such as temperature and time. By doing this, we show that there is at first degree a linear relationship between the temperature and the sensitivity. By removing this effect, we demonstrated that there is no sign of temporal change in the sensitivity, which validates the calibration method proposed by Thomas et al, 2021. If any temporal variations of the detector occur in the future, our method should be able to capture them.
How to cite: Cruz Mermy, G.: Calibration of the NOMAD-LNO channel onboard ExoMars 2016 Trace Gas Orbiter using solar spectra, Europlanet Science Congress 2021, online, 13–24 Sep 2021, EPSC2021-708, https://doi.org/10.5194/epsc2021-708, 2021.
*Corresponding author: ashim@iaa.es
Abstract
NOMAD (Nadir and Occultation for Mars Discovery instrument), is a spectrometer suite onboard Exo Mars Trace Gas Orbiter having within its main scientific objectives the observations of the trace gases in the Martian atmosphere [1]. Here we focus on the retrieval of carbon monoxide (CO) vertical profiles with high vertical resolution. CO is an important trace species which acts as both photochemical and dynamical tracers. We retrieve CO from the solar occultation (SO) observation of the NOMAD orders (186 – 191) using a state-of-the-art retrieval method [2]. The observational dataset covers a wide range of latitudes and seasons. This permits us to study the impact of different conditions such as dust-storm seasons (local and global), southern summer and winter on the CO vertical profiles over different regions.
Introduction
CO is originated in the upper Martian atmosphere by the photolysis of CO2 and destroyed by the hydroxyl (OH) radicals in the lower atmosphere. Hydroxyl radicals thus recycle CO into CO2 [3]. The study of the CO vertical distribution is important to understand the photo-chemical stability of the atmosphere. CO not only links the chemistry of the carbon and odd hydrogen chemical families but is a long-lived species which also serves as a dynamical tracer. By far the current knowledge of CO vertical profiles is largely unconstrained due to lack of systematic measurements. Though the column density of CO has been measured by instruments like CRISM [4] (Compact Reconnaissance Imaging Spectrometer for Mars) for a wide range of latitudes and seasons for multiple Martian years, the lack of its regular mapping in the vertical, limits a full understanding of its distribution and variability. Very recently, CO density profiles were reported from ACS (Atmospheric Chemistry Suite) observations [5] which found a significant depletion in CO mixing ratio during the 2018 global dust storm. NOMAD is performing routine solar occultation measurements since April 2018. Our aim here is to retrieve CO vertical profiles from these measurements with the best achievable precision and resolution and to investigate its distribution and variability through the different seasons and latitudes.
Retrieval of CO from NOMAD SO orders 186 – 190
We present vertical profiles of CO retrieved from a subset of NOMAD solar occultations. The SO channel of NOMAD operates in the 2.3 – 4.3 μm [3] where strong absorption lines for CO lie. In particular, the diffraction orders 186 (4180.32 cm-1 - 4213.88 cm-1) - 191 (4292.69 cm-1 - 4327.16 cm-1) allow for a good quality CO retrieval from 10 to about 100 km tangent altitudes. However, the recorded spectra suffer from calibration issues [6] such as bending and spectral shifts, in addition to variable systematic and random noise components. At IAA we have developed a cleaning procedure which correct the spectra for possible bending and spectral shift and makes it usable for a precise inversion of CO densities. We use the line-by-line radiative transfer model KOPRA (Karlsruhe Optimized and Precise Radiative transfer Algorithm) [2] as forward model, which was adapted to Mars and to the NOMAD instrument characteristics, in conjunction with an interactive solver (RCP) to retrieve CO from the cleaned spectra. Here we present a summary of this on-going work, which builds on a chain of retrievals of atmospheric aerosols, temperatures and density profiles derived from the same NOMAD scan but different diffraction orders, to obtain vertical profiles of CO in a consistent manner. We will also present first comparisons with Mars GCM results.
Acknowledgement
The IAA/CSIC team acknowledges financial support from the State Agency for Research of the Spanish MCIU through the ‘Center of Excellence Severo Ochoa’ award for the Instituto de Astrofísica de Andalucía (SEV-2017-0709). MALV was funded by grant PGC2018-101836-B-100 (MCIU/AEI/FEDER, EU). ExoMars is a space mission of the European Space Agency (ESA) and Roscosmos. The NOMAD experiment is led by the Royal Belgian Institute for Space Aeronomy (IASB-BIRA), assisted by Co-PI teams from Spain (IAA-CSIC), Italy (INAF-IAPS), and the United Kingdom (Open University). US investigators were supported by the National Aeronautics and Space Administration.
References
[1] Neefs, Eddy, et al. "NOMAD spectrometer on the ExoMars trace gas orbiter mission: part 1—design, manufacturing and testing of the infrared channels."Applied optics 54.28 (2015): 8494-8520.
[2] Jurado Navarro, Ángel Aythami. "Retrieval of CO2 and collisional parameters from the MIPAS spectra in the earth atmosphere." (2016).
[3] McElroy, Michael B., and Thomas M. Donahue. "Stability of the Martian atmosphere."Science 177.4053 (1972): 986-988.
[4] Smith, Michael D., et al. "The climatology of carbon monoxide and water vapor on Mars as observed by CRISM and modeled by the GEM-Mars general circulation model."Icarus 301 (2018): 117-131.
[5] Olsen, K. S., et al. "The vertical structure of CO in the Martian atmosphere from the ExoMars Trace Gas Orbiter."Nature Geoscience14.2 (2021): 67-71.
[6] Liuzzi, Giuliano, et al. "Methane on Mars: new insights into the sensitivity of CH4 with the NOMAD/ExoMars spectrometer through its first in-flight calibration." Icarus 321 (2019): 671-690.
How to cite: Modak, A., Lopez-Valverde, M. A., Funke, B., Hill, B., Brines, A., Stolzenbach, A., Gonzalez-Galindo, F., Lopez Moreno, J. J., Erwin, J., Trompet, L., Thomas, I., Daerden, F., Vandaele, A. C., Ristic, B., Villanueva, G., Liuzzi, G., Bellucci, G., and Patel, M.: Retrieval of Martian CO vertical profiles from NOMAD solar occultation measurements, Europlanet Science Congress 2021, online, 13–24 Sep 2021, EPSC2021-598, https://doi.org/10.5194/epsc2021-598, 2021.
CO is produced by the photodissociation of CO2 and recycled to CO2 by the catalytic cycle involving HOx in the Martian atmosphere [e.g., McElroy & Donahue, 1972]. In the mesosphere and lower thermosphere (MLT) region of Mars, the number density of CO is determined by photodissociation, diffusion, and atmospheric circulation. The increase of the CO mixing ratio in the MLT region and further enhancement in the polar region due to the transport of CO-enriched air via meridional circulation are predicted in the 3D models [Daerden et al., 2018; Holmes et al., 2019]. On the other hand, the decrease in the CO mixing ratio in the MLT region during a global dust storm is detected by TGO/ACS, which suggests that the increase in the hygropause altitude leads to the increase in the vertical range over which OH becomes available to convert into CO2 [Olsen et al., 2021]. Additionally, a substantial variation of the homopause altitude has been investigated [Slipski et al., 2018; Jakosky et al., 2017; Yoshida et al., 2020], which suggests that the order of magnitude changes in the eddy diffusion coefficient at the homopause [Slipski et al., 2018], and then variations in the profile of CO mixing ratio in the MLT region. However, the effects of change in the eddy diffusion coefficient on the profile of CO mixing ratio have not been investigated. The variability of the CO mixing ratio profiles can be a clue for understanding the dynamical coupling between the lower and the upper atmospheres.
To clarify the contributions of photochemistry, diffusion, and atmospheric circulation to the CO/CO2 profiles in the MLT region, we use the Nadir and Occultation for MArs Discovery (NOMAD) instrument aboard Trace Gas Orbiter (TGO). NOMAD solar occultation is designed as the combination of the Acousto Optical Turnable Filter and echelle grating [Neefs et al., 2015; Thomas et al., 2016]. NOMAD solar occultation operates in the wavelength range of 2.2 - 4.3 μm (2320 to 4350 cm-1) with a high spectral resolution (λ/dλ = 20000) [Vandaele et al., 2018]. It provides us CO and CO2 spectra below 100 km and 180 km altitudes, respectively.
In this study, we applied the equivalent width technique [Chamberlain and Hunten, 1987; Krasnopolsky, 1986] to derive a new set of CO and CO2 column densities, respectively, with the observed atmospheric transmittance spectra by NOMAD solar occultation. The absorption lines centered at 4285.0, 4288.2, and 4291.5 cm-1 for CO (2-0) band and 3358.7, 3364.9, and 3366.4 cm-1 for CO2 (21102-00001) band are carefully selected for retrievals due to the contribution of nearby and central orders [cf. Liuzzi et al., 2019]. It is noted that the line strengths of the selected CO2 have high sensitivity to the background temperature. In this study, we applied the vertical profiles of temperature simulated in the GEM-Mars model [Neary et al., 2018; Daerden et al., 2019]. We retrieve the CO and CO2 slant column densities between 60 and ~100 km altitudes because those slant opacities are saturated below 60 km altitude. The CO and CO2 spectra observed from April 2018 to September 2020, corresponding to from MY 34 Ls ~ 150 to MY 35 Ls ~ 280, are investigated.
We found that the retrieved CO/CO2 ratio between 60 and ~100 km increases with altitude. A behavior of the decrease in the CO/CO2 ratio during the global dust storm corresponds to the previous observations [Olsen et al., 2021]. However, the CO/CO2 profiles also vary with season and latitude. For interpretation, the 1D photochemical model will be compared with newly obtained CO/CO2 profiles, especially in order to discuss the contributions from the variations in eddy diffusion coefficient and photochemistry in the MLT region on Mars.
How to cite: Yoshida, N., Nakagawa, H., Aoki, S., Erwin, J., Vandaele, A. C., Murata, I., Thomas, I., Daerden, F., Neary, L., Koyama, S., Terada, N., Yasumasa, K., Ristic, B., Patel, M., Bellucci, G., and López Moreno, J. J.: Variation of CO/CO2 profiles in the Marian mesosphere and lower thermosphere retrieved from TGO/NOMAD, Europlanet Science Congress 2021, online, 13–24 Sep 2021, EPSC2021-479, https://doi.org/10.5194/epsc2021-479, 2021.
- The SO channel of the NOMAD instrument
The NOMAD-SO channel [1] is an infrared spectrometer working in the 2.2 to 4.3 µm spectral range (2200-4500 cm-1) and started to perform solar occultation measurement on April 21, 2018. The instrument is composed of an echelle grating coupled to an Acousto-Optical Tunable Filter for the diffraction order selection. As TGO is on a quasi-circular orbit at around 400 km of altitude, it performs one orbit every two hours. During a solar occultation measurement, SO scans six diffraction orders each second. These diffraction orders are recorded on four bins leading to a vertical sampling lower than one km. The calibration of the SO channel is described in [2] and is still being fine-tuned.
- CO2 density and temperature profiles retrievals
Several diffraction orders probe different altitude ranges as they contain CO2 lines with different intensities that appear and saturate at different altitudes. Correct temperature profiles are necessary for the retrieval of several species and the profiles have to be carefully retrieved as their inversion is very sensitive to noise. We use the following retrieval scheme:
For each solar occultation measurement, we derive a slant column profile of CO2 using ASIMUT-ALVL [3]. ASIMUT is a radiative transfer program developed at BIRA-IASB and uses the Optimal Estimation Method for regularization [4]. The GEM-Mars GCM provides the a priori profiles of CO2 local density, pressure and temperature. We then apply an iterated Tikhonov regularization to derive a regularized local density profile using an improved version of the algorithm described in [5]. This method requires the selection of a regularization parameter to reduce as much as possible the presence of noise in the profile while keeping the real variations. This retrieval scheme allows a fine-tuning of the reguralization parameter. We finally apply the hydrostatic equilibrium equation to derive the temperature profiles [6]. We derived the NOMAD-SO CO2 and temperature profiles for MY34 and 35.
How to cite: Trompet, L., Vandaele, A. C., Aoki, S., Erwin, J., Thomas, I., Piccialli, A., Daerden, F., Neary, L., Villanueva, G., Liuzzi, G., Crismani, M., Lopez-Valverde, M. A., Ristic, B., Lopez-Moreno, J. J., Bellucci, G., and Patel, M. and the NOMAD team: Update on CO2 and temperature profiles retrievals from NOMAD-SO on board ExoMars TGO, Europlanet Science Congress 2021, online, 13–24 Sep 2021, EPSC2021-216, https://doi.org/10.5194/epsc2021-216, 2021.
Introduction
Vertical profiles of CO2 and temperature with good vertical resolution are key measurements to characterize the Martian atmosphere, although difficult to obtain from remote observations [1]. For the first time these vertical profiles can be routinely obtained with a solar occultation technique by the instruments NOMAD and ACS on board the Exomars Trace Gas Orbiter [2,3]. A state-of-the-art retrieval scheme designed to derive atmospheric profiles of CO2 and temperature from the bottom to the top of the Martian atmosphere [4] is adapted to solar occulation and applied to exploit the operational sounding of these two instruments. The final goal of this on-going work is to characterize the Martian thermal structure from the troposphere up to the thermosphere with unprecedented vertical resolution and also to cross-validate both TGO instruments as best as possible, with a single retrieval code and entirely consistent data analysis approaches.
Retrieval approach
This work is focussed on the solar occultation channels NOMAD-SO and ACS-MIR, in routine operations since April 2018. To exploit these unique datasets, it is of paramount importance to examine the performance of the two instruments and to cross-validate their retrieval results as accurately as possible. For this purpose we apply a flexible and well tested Earth atmosphere retrieval scheme [5,6,7], to both of them, after adaptation to Mars atmospheric conditions [4] and the necessary accomodation of these channels characteristics [8]. The retrievals use calibrated transmittance spectra to tackle three targets, CO2 density, temperature, and dust loading, in a simultaneous global-fit inversion, with updated hydrostatic equilibrium in every iteration, including contaminant species like H2O, and after a pre-processing/data cleaning analysis which is also similar in both instruments. A first error analysis is performed for both instruments with the help of synthetic retrievals and a series of sensitivity tests performed with the same inversion scheme and similar treatment of the key error terms (measurement noise and systematics).
Comparison of results
We will present data obtained in the 2.7 µm region, dominated by a well known ro-vibrational band of CO2, and sampled by NOMAD-SO in a mixture of diffraction orders that are used routinely in the operational sounding in the vertical. Similarly, we used 3 consecutive orders in one of the ACS-MIR difraction positions, which contain a sufficient number of CO2 lines in the same 2.7 µm band with the capability to sample the whole atmosphere, up to about 180 km, in a single vertical scan. For both instruments the sounding of the lowest troposphere is limited by the amount of atmospheric dust, which is also retrieved simultaneously with CO2 and temperature. We will compare the vertical profiles obtained in a small sample of profiles from each instrument which span different seasons, latitudes and atmopheric dust loadings, during the first year of TGO operations. The comparisons take into account that the two instruments' individual solar occulation scans are non-coincident in time and space. Comparions are also peformed with results from similar efforts by other groups in the NOMAD and ACS teams [9]. Two important applications of the obtained retrievals are : (i) to supply the most appropriate inputs to the retrieval of other atmospheric species from the same instruments and the same scans, without the need to assume a prior or first guesses from global circulation models (GCM), see companion contributions to this conference [10,11], and (ii) to validate predictions from these GCMs, and therefore, to help to improve them, particularly at high altitudes and at the terminator, where these datasets are particularly valuable [1].
Acknowledgements
The IAA/CSIC team acknowledges financial support from the State Agency for Research of the Spanish MCIU through the ‘Center of Excellence Severo Ochoa’ award for the Instituto de Astrofísica de Andalucía (SEV-2017-0709) and funding by grant PGC2018-101836-B-100 (MCIU/AEI/FEDER, EU). ExoMars is a space mission of the European Space Agency (ESA) and Roscosmos. The NOMAD experiment is led by the Royal Belgian Institute for Space Aeronomy (IASB-BIRA), assisted by Co-PI teams from Spain (IAA-CSIC), Italy (INAF-IAPS), and the United Kingdom (Open University). US investigators were supported by the National Aeronautics and Space Administration. Thanks are extensive to all members of the NOMAD Science Team and the ACS Science Team.
References
[1] Lopez-Valverde et al., Space Sci Rev, 214, 29 (2018)
[2] Vandaele et al., Space Science Reviews 214, 5, 2018
[3] Korablev et al., Space. Sci. Rev. 214, 7 (2018).
[5] Funke, B., et al. , Atmos. Chem. Phys., 9(7), 2387–2411 (2009).
[4] Jimenez-Monferrer et al., Icarus, 353, 113830 (2020), doi.org/10.1016/j.icarus.2020.113830.
[6] Stiller et al., JQSRT, 72, 249–280 (2002)
[7] von Clarmann et al., J. Geophys. Res. 108, 4746 (2003)
[8] Lopez-Valverde et al., EPSC Abstracts, Vol. 14, EPSC2020-924 (2020), doi.org/10.5194/epsc2020-924
[9] Trompet et al., "Update on CO2 and temperature profiles retrievals from NOMAD-SO on board ExoMars TGO", contribution to this conference, EPSC 2021.
[10] Brines et al., "Martian water vapor vertical profiles with data from solar occultation measurements by NOMAD onboard TGO/ExoMars", contribution to this conference, EPSC 2021.
[11] Modak et al., "Retrieval of Martian CO vertical profiles from NOMAD solar occultation measurements", contribution to this conference, EPSC 2021.
How to cite: Lopez-Valverde, M. A., Hill, B., Funke, B., González-Galindo, F., Brines, A., Stolzenbach, A., Modak, A., López-Moreno, J. J., Trompet, L., Aoki, S., Thomas, I., Vandaele, A. C., Villanueva, G., Belyaev, D., Trokhimovskiy, A., Korablev, O., Olsen, K., Montmessin, F., Bellucci, G., and Patel, M.: CO2 and Temperature vertical profiles in the Martian atmosphere from solar occultation measurements at 2.7 micron by instruments NOMAD and ACS on board the Exomars Trace Gas Orbiter, Europlanet Science Congress 2021, online, 13–24 Sep 2021, EPSC2021-109, https://doi.org/10.5194/epsc2021-109, 2021.
Thermal tides in Martian atmosphere from ACS/TIRVIM
Siteng Fan1 (sfan@lmd.ipsl.fr), Sandrine Guerlet1, Francois Forget1, Antoine Bierjon1, Ehouarn Millour1, Nikolay Ignatiev2, Alexey Shakun2, Alexey Grigoriev2, Alexander Trokhimovskiy2, Franck Montmessin3, Oleg Korablev2
1: LMD/IPSL, Sorbonne Université, PSL Research University, École Normale Supérieure, École Polytechnique, CNRS, Paris, France
2: Space Research Institute (IKI), Moscow, Russia
3: LATMOS/IPSL, Guyancourt, France
Abstract
Atmospheric thermal tides are planetary-scale temperature oscillations driven by diurnal solar forcing. On Mars, they dominate the temperature variations and winds throughout the thin atmosphere due to its low heat capacity. Given the short timescales of tide modes, which are typically equal or shorter than a Martian day, analyses of these tides require observations with large spatial coverage and high local time resolution. Observations from the TIRVIM Fourier-spectrometer, part of the Atmospheric Chemistry Suite (ACS) onboard ExoMars Trace Gas Orbiter (TGO), provide data meeting such requirement. Here we report the spatial- and temporal-dependent temperature profiles of Martian atmosphere retrieved from TIRVIM nadir data. Amplitudes and phases of thermal tide modes are obtained, and their influence on the thermal structure of Martian atmosphere is estimated using numerical simulations, The LMD Mars Global Circulation Model (GCM).
Introduction
Diurnal thermal forcing by solar radiation excites temperature oscillations in Martian atmosphere through direct sunlight absorption and heat exchange with Mars surface (Gierasch & Goody 1968). Influenced by surface topography, the varying solar forcing produces harmonic responses in the Martian atmosphere, thermal tides (Zurek 1976). Some modes of the tides can vertically propagate to upper altitudes with amplitudes growing exponentially with decreasing air density, which therefore influences the atmospheric circulation. The existence of such temperature and the related pressure variations has been observed by many Mars landers and orbiters (e.g., Hess et al., 1977, Banfield et al. 2000, Lee et al. 2009, Kleinböhl et al. 2013, Forbes et al. 2020), but observations are still lacking for comprehensive studies as large spatial coverage and high temporal resolution are required to study such planetary-scale diurnal/sub-diurnal variations.
Methodology and Results
We analyze the thermal tides using temperature structures retrieved from TIRVIM nadir data. TIRVIM is a thermal infrared Fourier-spectrometer, as part of the ACS instrument onboard the ESA-Roscosmos mission ExoMars TGO (Korablev et al., 2018, Svedhem et al. 2020). TGO is on a non-solar-synchronous orbit with a period of 2 hours, so observations obtained at nadir viewing geometry could cover a wide range of local time due to the short orbital period and orbit drifting (Capderou & Forget, 2004, Figure 1). A full diurnal cycle can be sampled between 74°N and 74°S within ~55 solar days (sols), which is equivalent to ~30° in solar longitude (Ls). Binning data within this range results in data covering most local time in a specific Martian month with little seasonal variations. TIRVIM operated from April 2018 to December 2019, nearly one Martian year (MY) from MY34 Ls134° to MY35 Ls 115°, and provides ~1.5 million thermal infrared nadir-viewing spectra with decent data quality. Despite some degeneracy, we retrieved temperature profiles together with dust and water ice from these spectra (Guerlet et al. 2018). Each profile covers a vertical range from ~2-3km above Mars surface to ~50-55km (~1-2Pa) with a vertical resolution of ~1 scale height (10km). Full coverage of local time is obtained for the first time on sub-seasonal scales (Figure 1), which makes it possible to evaluate thermal tides in Martian atmosphere with details and resolve the harmonic aliasing introduced by solar-synchronous observations, e.g., observations at 3am and 3pm local time by the Mars Climate Sounder (MCS, Lee et al. 2009).
A preliminary result of the thermal structure on the Martian southern hemisphere near MY35 spring equinox (Ls=90°) is shown in Figure 2a. We binned the data between Ls 75° to 105° so that most of the local time is covered. No dust storms are identified during this period. The selected bin size of latitude is 3° and that of the local time is 1 hour. Temperature profiles are also zonal averages, so only migrating tides are shown. The diurnal temperature difference structure shows diurnal and semi-diurnal cycles at lower and middle atmosphere, respectively, with “apparent” amplitudes of ~7K. Due to the degeneracy introduced by vertically distributed sensitivity response functions of TIRVIM thermal infrared spectra, the retrieved temperature profiles are vertically smoothed (Guerlet et al. 2018). Suggested by the LMD Mars GCM (Forget et al. 1999), amplitudes of these tides are 2-3 times larger (Figure 2b), as smoothing them with the same response functions gives similar diurnal temperature difference structure (Figure 2c). A priori in the temperature profile retrieval makes a difference in extracting the diurnal temperature anomaly at low pressure level due to small weights in the convolution kernels (Figure 2b and 2c), which requires further investigation with GCMs.
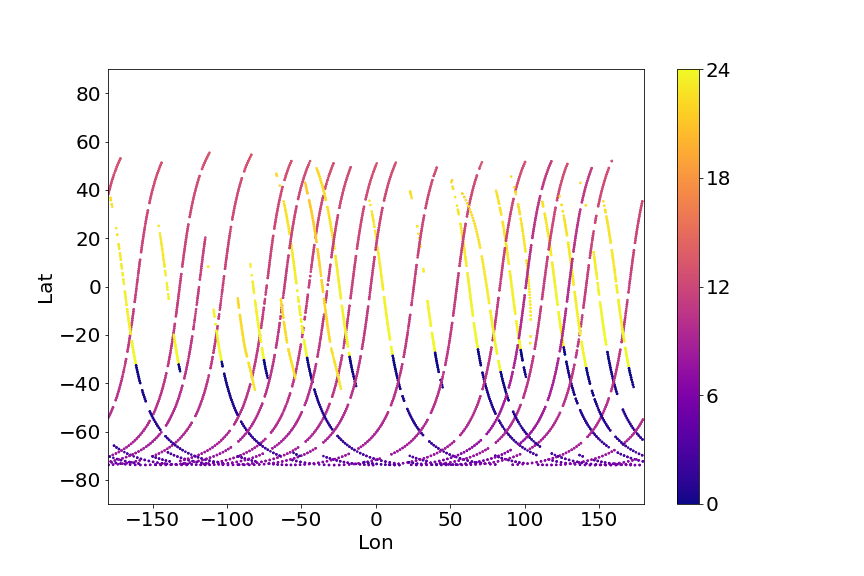
Figure 1. Spatial-temporal coverage of ACS/TIRVIM observations. Data from 20 orbits are shown for the purpose of illustration, with colors denoting the local time.
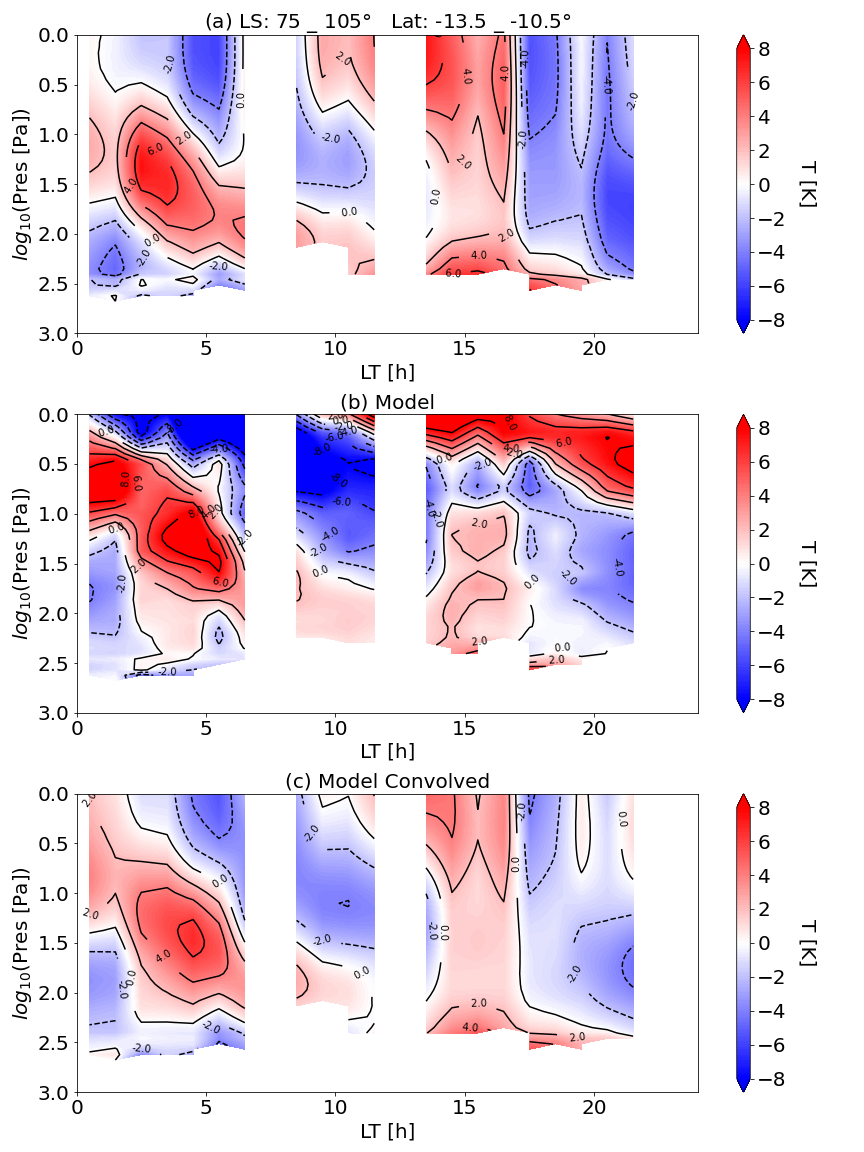
Figure 2. (a) Diurnal temperature anomaly derived using ACS/TIRVIM observations. The data is binned between MY35 Ls 75° and 105°, and between 10.5°S and 13.5°S in latitude. (b) Result of the LMD Mars GCM. The model result has the same spatial-temporal sampling weight as observations. (c) Same as (b), but vertically convolved with the averaging kernels of TIRVIM.
References
Banfield, D., Conrath, B., Pearl, J. C., et al. (2000). JGR, 105, 9521.
Capderou, M., & Forget, F. (2004). P&SS, 52, 789.
Forbes, J. M., Zhang, X., Forget, F., et al. (2020). JGR: Space Physics, 125, e28140.
Forget, F., Hourdin, F., Fournier, R., et al. (1999). JGR, 104, 24155.
Gierasch, P., & Goody, R. (1968). P&SS, 16, 615.
Guerlet, S., Ignatiev, N., Fouchet, T., et al. (2018). EPSC, 2018-223.
Hess, S. L., Henry, R. M., Leovy, C. B., et al. (1977). JGR, 82, 4559.
KleinböHl, A., John Wilson, R., Kass, D., et al. (2013). GRL, 40, 1952.
Korablev, O., Montmessin, F., Trokhimovskiy, A., et al. (2018). SSW, 214, 7.
Lee, C., Lawson, W. G., Richardson, M. I., et al. (2009). JGR: Planets, 114, E03005.
Svedhem, H., Korablev, O., Mitrofanov, I., et al. (2020). EPSC, 2020-802.
Zurek, R. W. (1976). JAS, 33, 321.
How to cite: Fan, S., Guerlet, S., Forget, F., Bierjon, A., Millour, E., Ignatiev, N., Shakun, A., Grigoriev, A., Trokhimovskiy, A., Montmessin, F., and Korablev, O.: Thermal tides in Martian atmosphere from ACS/TIRVIM, Europlanet Science Congress 2021, online, 13–24 Sep 2021, EPSC2021-183, https://doi.org/10.5194/epsc2021-183, 2021.
Abstract
Martian dust particles play an important part in radiative processes in Martian atmosphere, being involved in dust, H2O and CO2 cycles on Mars [1]. The most significant manifestations of such cycles are dust storms which last several weeks and strongly affect the thermal structure of Martian atmosphere [2]. In addition to regular storms, global dust storms (hereinafter GDS) occur irregularly once in several Martian Years (hereinafter MY) and cover the entire planet for months. GDS still remain unpredictable despite numerous studies [3]. The latest global dust storm occurred in MY 34 and has been simultaneously monitored by several spacecrafts including ExoMars Trace Gas Orbiter (TGO) [4].
In this paper we present results of analysis of thermal emission spectra of Mars measured with a Fourier-transform spectrometer ACS TIRVIM onboard TGO [5]. The main scientific goal of TIRVIM is long-term monitoring of temperatures and aerosols (dust and water ice) distribution in Martian atmosphere in nadir mode of observations in the 5–16 μm spectral range [6]. Here we consider two datasets obtained in MY 34: the first one covered the first month of the GDS in a period from 26th of May 2018 till 15th of July 2018 (Martian season Ls = 182.2°–211.7°), the second one lasted from 22nd of December 2018 till 18th of March 2019 (Ls = 310.9°–357.3°) and fully covered the regional dust storm (C-storm).
Retrieval of temperatures, dust and ice content from the thermal emission of Martian atmosphere in 15 μm CO2 band has been done in a number of previous similar experiments [7, 8, 9]. We use iterative retrieval algorithm based on optimum estimation approach [10]. With TIRVIM spectral resolution Δν = 1.17 cm-1, temperature profiles may be retrieved from the surface to 55–60 km of altitude with the vertical resolution in the order of few kilometers in the lower atmosphere. Spectral range from 780 to 1300 cm-1 is free from CO2 absorption lines and is suitable for retrieving the temperature of Martian surface and column abundances of aerosols. Dust and water ice contents are defined as optical depths at wavelengths of local maxima of their spectral extinction cross sections [11].
We have obtained the thermal structures of Martian atmosphere at various local times during the first month of the global dust storm and during the whole regional storm. We have compared temperature fields in the nighttime and daytime at the peaks of the two observed storms with structure of the pure from dust atmosphere. Asymmetric heating with dust particles ejected into the atmosphere is clearly seen in Fig. 1. Diurnal contrasts of temperature between nighttime and daytime are represented in Fig. 2. We notice an excellent agreement with co-located MCS/MRO measurements [12], with the account for a worse vertical resolution of nadir sounding with TIRVIM.
Along with the temperature field we also consider the variability of dust distribution during the two storms in MY 34. Spatial distributions of dust in terms of column optical depth at 1075 cm-1 at the peaks of the global dust storm and the regional dust storm are shown in Fig. 3. Due to unavoidable degeneracy of the dust and ice retrieval problems at some temperature conditions, these maps contain also unreliable high and zero values of optical depth, which are to be filtered out.
Acknowledgements
Science support in IKI is funded by the RSF grant #20-42-09035.
References
[1] Kahre M.A. et al. The Mars dust cycle. The atmosphere and climate of Mars. // MA: Cambridge Univ. Press, Cambridge, 2017
[2] Smith M.D. et al. Thermal Emission Spectrometer results: Mars atmospheric thermal structure and aerosol distribution. // Journal of Geophysical Research. – 2001. – Vol. 106(E10). – P. 23929–23945
[3] Zurek R.W., Martin L.J. Interannual variability of planet-encircling dust storms on Mars. // Journal of Geophysical Research. – 1993. – Vol. 98(E2). – P. 3247–3259
[4] Vago J. et al. ESA ExoMars program: The next step in exploring Mars. // Solar System Research. – 2015. – Vol. 49. – P. 518–528
[5] Korablev O. et al. The Atmospheric Chemistry Suite (ACS) of Three Spectrometers for the ExoMars 2016 Trace Gas Orbiter // Space Science Reviews. 2018. Vol. 214.
[6] Shakun A. et al. (2018). ACS/TIRVIM: Calibration and first results. // Proceedings SPIE 10765, Infrared Remote Sensing and Instrumentation XXVI, 107650E. – 2018
[7] Zasova L. et al. The Martian Atmosphere in the Region of the Great Volcanoes: Mariner 9 IRIS Data Revisited. // Planetary and Space Science. – 2001. – Vol. 49. – P. 977–992
[8] Smith M.D. et al. Separation of atmospheric and surface spectral features in Mars Global Surveyor Thermal Emission Spectrometer (TES) spectra. // Journal of Geophysical Research. – 2000. – Vol. 105(E4). – P. 9589–9607
[9] Grassi D. et al. The Martian atmosphere above great volcanoes: Early planetary Fourier spectrometer observations. // Planetary and Space Science. – 2005. – Vol. 53. – P. 1053–1064
[10] Conrath B.J. et al. Mars Global Surveyor Thermal Emission Spectrometer (TES) observations: Atmospheric temperatures during aerobraking and science phasing // Journal of Geophysical Research. – 2000. – Vol. 105. – P. 9509–9519
[11] Clancy R.T., Wolff M.J. et al. Mars aerosol studies with the MGS TES emission phase function observations: Optical depths, particle sizes, and ice cloud types versus latitude and solar longitude. // Journal of Geophysical Research. – 2003. – Vol. 108(E8).
[12] Kleinböhl A. et al. Diurnal Variations of Dust During the 2018 Global Dust Storm Observed by the Mars Climate Sounder. // Journal of Geophysical Research: Planets. – 2020. – Vol. 125.

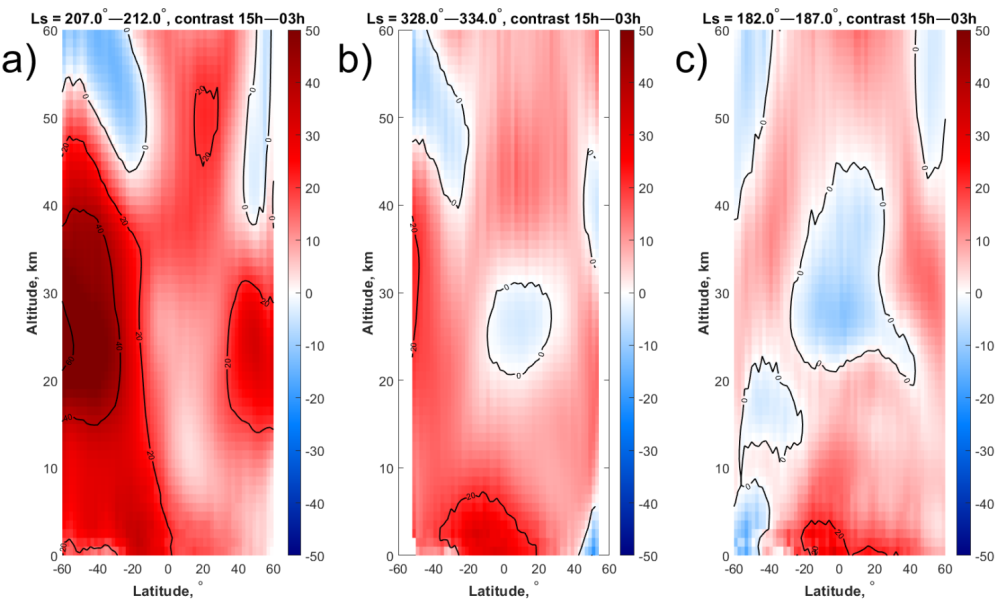
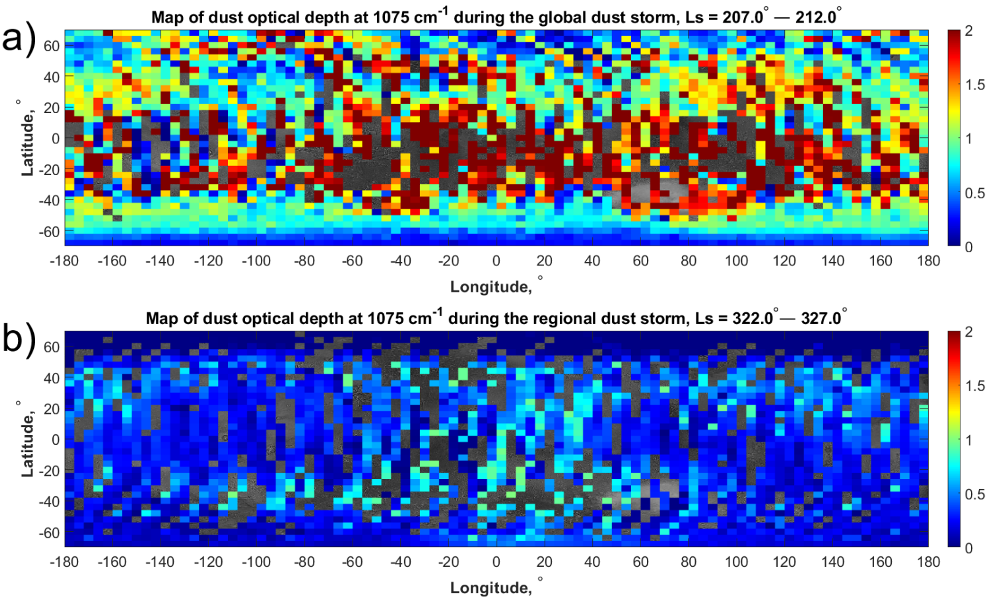
How to cite: Vlasov, P., Ignatiev, N., Guerlet, S., Grassi, D., Grigoriev, А., Shakun, A., Patsaev, D., Maslov, I., Luginin, M., Millour, E., Forget, F., Arnold, G., Trokhimovskiy, А., Korablev, O., and Montmessin, F.: Martian atmospheric thermal structures and dust distributions during the global dust storm and the regional dust storm of MY 34 from ACS TIRVIM observations onboard ExoMars TGO, Europlanet Science Congress 2021, online, 13–24 Sep 2021, EPSC2021-405, https://doi.org/10.5194/epsc2021-405, 2021.
Abstract
In this work we analyze ExoMars/TGO NOMAD spectrometer [1] nadir data. We exploit both the ultraviolet-visible UVIS channel and the infrared LNO channel to obtain information about Martian dust densities and grains sizes. For the analysis we apply the MITRA radiative transfer tool [2,3,4] to all the spatially and temporally coincident UVIS and LNO 2018 data, also covering a global dust storm. We investigate possible correlations between the results and the local time of the observations.
Introduction
Studies focused on Mars 2018 global-scale dust event, as observed by the instruments on board the TGO spacecraft, demonstrate that Martian trace gases abundance and distribution is strongly affected by the presence of dust [5,6,15]. Airborne dust drives Mars’ thermal structure and climate [7] by heating and cooling the lower atmosphere through absorption at VIS-NIR wavelengths [8] and emission in the IR range respectively [9,10,8,11]. These mechanisms affect, for example, the water-ice clouds formation and can drive convection, leading to variations of water vapor abundances [6,16]. In general, the understanding of dust properties is mandatory for the investigation of Martian trace gases vertical distribution.
Instrument and Observations
The NOMAD spectrometer has three channels covering the ultraviolet/visible (UVIS channel) and the infrared (LNO and SO channels) spectral ranges. While the instrument main focus is the study of trace gases, it can also be exploited to study atmospheric particulate. In this work, we take advantage of the combined UVIS and LNO channels data, acquired in nadir geometry, to study Martian dust microphysical properties. We analyze the whole 2018 dataset taking into account all observations that are spatially and temporally coincident among the two NOMAD channels, in order to build a dataset spanning from the ultraviolet/visible to the infrared spectral range.
Method
We use the MITRA radiative transfer model and inversion algorithm to retrieve dust microphysical properties from the selected dataset. The use of the combined ultraviolet/visible and infrared ranges, covered by UVIS and LNO NOMAD channels together, is required in order to separate the information related to the dust density from that of the grains sizes. However, if no coincident LNO observations are available for a certain UVIS orbit, we still apply the MITRA tool to the UVIS spectral range alone to obtain the dust integrated optical depth. We use only LNO orders covering the wavelength range 2.20-2.65 μm, since they are mostly affected by narrow and isolated gaseous absorption lines and, hence, they can be exploited to study the intensity of the spectral continuum. We take the temperature-pressure profiles from the Mars Climate Database (MCD, [12]) and use the dust optical constants from [13,14]. Surface albedo spectra are derived using an approach based on the SAS method [15] applied to the MEx/OMEGA dataset. The results of the retrieval are investigated for the identification of eventual trends of density and grains sizes with local time or other observing parameters.
Summary
The presented method allows to study Martian dust microphysical properties taking advantage of the combined UVIS and LNO NOMAD channels datasets. Given the reduced spatial coverage of the coincident data, we focus our analysis on the investigation of possible trends in the results with the observations local time. Once validated on 2018 data, the method is planned to be extended to the whole NOMAD dataset.
Acknowledgements
ExoMars is a space mission of the European Space Agency (ESA) and Roscosmos. The NOMAD experiment is led by the Royal Belgian Institute for Space Aeronomy (IASB-BIRA), assisted by Co-PI teams from Spain (IAA-CSIC), Italy (INAF-IAPS), and the United Kingdom (Open University). This project acknowledges funding by the Belgian Science Policy Office (BELSPO), with the financial and contractual coordination by the ESA Prodex Office (PEA 4000103401, 4000121493), by Spanish Ministry of Science and Innovation (MCIU) and by European funds under grants PGC2018-101836-BI00 and ESP2017-87143-R (MINECO/FEDER), as well as by UK Space Agency through grants ST/R005761/1, ST/P001262/1, ST/R001405/1 and ST/R001405/1 and Italian Space Agency through grant 2018-2-HH.0. This work was supported by the Belgian Fonds de la Recherche Scientifique – FNRS under grant number 30442502 (ET_HOME). The IAA/CSIC team acknowledges financial support from the State Agency for Research of the Spanish MCIU through the ‘Center of Excellence Severo Ochoa’ award for the Instituto de Astrofísica de Andalucía (SEV-2017-0709). US investigators were supported by the National Aeronautics and Space Administration. Canadian investigators were supported by the Canadian Space Agency.
References:
[1]Neefs, E., et al, 2015. Appl. Opt. 54, 28, 8494-8520.[2]Oliva, F., et al, 2016. Icarus 278, 215-237.[3]Sindoni, G., et al, 2013. EPSC2013.[4]Oliva, F., et al, 2018. Icarus 300, 1-11.[5]Daerden, F., et al, 2019. Icarus 326, 197-224.[6]Vandaele, A.C., et al, 2019. Nature 568, 521-525.[7]Kahre, M.A., et al, 2008. Icarus 195, 576-597.[8]Korablev, O. ,et al, 2005. Adv. Space Res. 35, 21–30.[9]Gierasch, P.G., Goody, R.M., 1972. J. Atmos. Sci. 29, 400–402.[10]Pollack, J.,et al, 1979. J. Geophys. Res. 84, 2929–2945.[11]Määttänen, A., et al, 2009. Icarus 201, 504-516.[12]Millour, E., et al, 2018. From Mars to Exomars, 2018.[13]Wolff, M.J., et al, 2009. J. Geophys. Res., 114, E9. [14]Wolff, M.J., et al, 2010. Icarus, 208.[15]Geminale, A., et al, 2015. Icarus 253, 51-65.[16]Aoki, S., et al. 2019. J. Geophys. Res.: Planets,124, 3482-3497.
How to cite: Oliva, F., D'Aversa, E., Bellucci, G., Carrozzo, F. G., Karatekin, O., Ruiz Lozano, L., Altieri, F., Daerden, F., Thomas, I. R., Ristic, B., Mason, J., Willame, Y., Depiesse, C., Patel, M. R., Lopez-Moreno, J. J., Vandaele, A. C., and Amoroso, M.: Mars dust microphysical properties retrieval through TGO/NOMAD UVIS and LNO channels combined nadir datasets analysis, Europlanet Science Congress 2021, online, 13–24 Sep 2021, EPSC2021-501, https://doi.org/10.5194/epsc2021-501, 2021.
1. The NOMAD-SO database and retrieval procedure
The NOMAD-SO channel [1] is an infrared spectrometer onboard ExoMars TGO working in the 2.2 to 4.3 µm spectral range (2200-4500 cm-1). During a solar occultation measurement, NOMAD-SO scans six diffraction orders each second. These diffraction orders are recorded on four bins leading to a vertical sampling lower than one km. We use vertical profiles of calibrated transmittance and evaluated noise from level 1 data provided by the PI team. These level 1 scans are pre-processed by an in-house algorithm set up to clean the data of possible spectral shifts and/or bending. In order to retrieve the extinction vertical profile due to aerosol we use the model a state-of-the-art line by line radiative transfer forward model code called KOPRA, in conjunction with the iterative non-linear inversion scheme RCP, conceived and developed at the Institute of Meteorology and Climate Research (IMK) of Karlsruhe Institude for Technology and previously used in [2]. A priori and first guess profiles of the atmospheric thermal structure and composition, required by RCP, are taken from specific runs of the LMD Mars-GCM available through the MCD [3]. To minimize vertical error propagation we adopted a global fit inversion instead of a classical onion-peeling method. A first order Tikhonov regularization matrix is used for the aerosol extinction retrieval. For stability, RCP uses Levenberg-Marquardt damping method. Pre-processing and regularization parameters required fine-tuning, a task performed using a sample of orbits. We confirmed that these parameters are valid for all other scans.
2. Aerosols characterization and vertical profiles
Aerosols in Martian atmosphere play a major role in several chemical and radative processes, affecting local to global dynamics and energy budget (see [4] for an exhaustive review of this subject). One crucial parameter is the aerosol composition and distribution, i.e the dust, water ice or CO2 ice content and its variation with with altitude, with a better vertical resolution than previous instruments. TGO offers an excellent opportunity to study it in detail for the first time because of its high vertical resolution. Using the vertical profile of aerosol extinction obtained from NOMAD-SO measurements as described above, we then apply a model/data fitting strategy of the aerosol extinction, as described in [5] in order to evaluate key parameters of the aerosol’s content in the martian atmosphere. We compare the retrieved aerosol extinction to a precomputed look-up table in the same spectral range from a Lorenz-Mie code to compute the scattering properties of an ensemble of polydisperse spherical particles [6] and using refractive indexes for martian dust, water ice and CO2 ice. This procedure allow us to evaluate two other key parameters besides the composition of aerosol present in the martian atmosphere, namely, the effective radius (reff) and the effective variance (νeff). These characteristic parameters of the aerosol’s distribution are of great interest constraining microphysics and dynamics. We will detail this procedure and compare the early results with available data for several chosen scans of NOMAD-SO observation during the first year of TGO operations, which include the GDS 34 [7].
Acknowledgements
The IAA/CSIC team acknowledges financial support from the State Agency for Research of the Spanish MCIU through the "Center of Excellence Severo Ochoa" award for the Instituto de Astrofísica de Andalucía (SEV-2017-0709) and funding by grant PGC2018-101836-B-100 (MCIU/AEI/FEDER, EU). ExoMars is a space mission of the European Space Agency (ESA) and Roscosmos. The NOMAD experiment is led by the Royal Belgian Institute for Space Aeronomy (IASB-BIRA), assisted by Co-PI teams from Spain (IAA-CSIC), Italy (INAF-IAPS), and the United Kingdom (Open University). US investigators were supported by the National Aeronautics and Space Administration.
References
[1] Vandaele, A.C., et al.: “Science objectives and performances of NOMAD, a spectrometer suite for the ExoMars TGO mission, Planet”. Space Sci., Vol. 119, pp 233-249, 2015.
[2] A. A. Jurado-Navarro. “Retrieval of CO2 and collisional parameters from the MIPAS spectra in the Earth atmosphere”. PhD thesis, Universidad de Granada, 2015.
[3] E. Millour, F. Forget, A. Spiga, M. Vals, V. Zakharov, L. Montabone, F. Lefèvre,F. Montmessin, J.-Y. Chaufray3 M. A. López-Valverde, F. González-Galindo, S. R.Lewis, P. L. Read, M.-C. Desjean, F. Cipriani and the MCD development team. “Mars climate database.” From Mars Express to ExoMars, 2018.
[4] Kahre, M. A., Murphy, J. R., Newman, C. E., Wilson, R. J., Cantor, B. A., Lemmon, M. T., & Wolff, M. J. (2017). “The Mars dust cycle.” In R.M. Haberle (Ed.), The atmosphere and climate of Mars (pp. 229– 294). Cambridge: Cambridge University Press
[5] Luginin, M., A. Fedorova, D. Belyaev, F. Montmessin, V. Wilquet, O. Korablev, J. -L. Bertaux, and A. C. Vandaele. “Aerosol Properties in the Upper Haze of Venus from SPICAV IR Data.” Icarus, 277. 2016.
[6] Mishchenko, Michael I., Larry D. Travis, and Andrew A. Lacis. Scattering, absorption, and emission of light by small particles. Cambridge university press, 2002.
[7] Liuzzi, G., Villanueva, G. L., Crismani, M. M. J., Smith, M. D., Mumma, M. J., Daerden, F., et al. . Strong variability of Martian water ice clouds during dust storms revealed from ExoMars Trace Gas Orbiter/NOMAD. Journal of Geophysical Research: Planets, 125, 2020.
How to cite: stolzenbach, A., López-Valverde, M.-A., Funke, B., González-Galindo, F., Brines, A., Modak, A., Lopez Moreno, J. J., Hill, B., Thomas, I., Vandaele, A.-C., Luginin, M., Oleg, K., Aoki, S., Villanueva, G., Liuzzi, G., Wolff, M., Bellucci, G., and Patel, M. and the NOMAD Team: Vertical profiles of Martian aerosols distribution parameters and composition retrievals from NOMAD-SO, Europlanet Science Congress 2021, online, 13–24 Sep 2021, EPSC2021-635, https://doi.org/10.5194/epsc2021-635, 2021.
Introduction: Suspended atmospheric aerosols are key components of the martian atmosphere, and their vertical distribution has long been a subject of investigation with orbital observations and modelling. The aerosols found in Mars' atmosphere are mineral dust, water ice, and CO2 ice, and each have distinct spatiotemporal distributions and radiative effects.
Of particular interest for this study is the vertical distribution of atmospheric aerosols. In recent years, dust has been observed to have a more complex vertical distribution structure than previously thought, with the detection of detached dust layers [1] and large plume-like structures during Global Dust Storms (GDS) [2].
Water ice distribution is tied to the seasonal behaviour of its associated cloud formations, with seasonally recurring features including the aphelion cloud belt (ACB) [3] and polar hood clouds [4] at tropospheric altitudes, as well as higher altitude mesospheric (>40 km) clouds during Mars’ perihelion season [5] as well as during GDS [6,7].
Mars’ low atmospheric temperatures also enable the formation of CO2 ice clouds, which have been detected at mesospheric altitudes over the tropics/subtropics and generally during the colder aphelion season [5,8]. These are thought to be more ephemeral than their water ice counterparts, with lifetimes as low as minutes [9]. More persistent and optically thicker CO2 ice clouds have been detected at tropospheric altitudes in the polar night [10].
The Ultraviolet and Visible (UVIS) Spectrometer [11], part of the Nadir and Occultation for MArs Discovery (NOMAD) spectrometer suite aboard the ExoMars Trace Gas Orbiter (TGO) [12], has now observed the martian atmospheric limb via solar occultations for over 1.5 martian years. This period covers the 2018/Mars Year (MY) 34 GDS and regional dust storm, as well as the entirety of the more typical MY 35. As such, UVIS solar occultation data provides a great opportunity to examine Mars’ vertical aerosol structure.
Results: We present a new UVIS occultation opacity profile dataset, openly available for use by the community. We also discuss particular features of interest in the dataset, and interpret these features by reference to previous published work and by comparison with the MGCM. In particular, we focus on notable mesospheric water ice cloud phenomena observed in both MY 34 and MY 35. We describe the spatiotemporal distribution of these features, and the link between specific water ice features and strong atmospheric dust activity from global and regional storms. The MGCM temperature and aerosol opacity fields provide valuable points of comparison with the UVIS dataset, for the purposes of both explanation and validation of the MGCM’s existing parametrizations. The UVIS dataset offers opportunities for further research into the vertical aerosol structure of the martian atmosphere, and improvement of how this is represented in numerical models.
References: [1] Heavens, N. G. et al (2011) JGR (Planets), 116(E4), E04003. [2] Heavens, N. G. et al (2019) GRL, 124(11), 2863-2892. [3] Smith M. D. (2008) Annu. Rev. Earth Planet Sci, 26, 191-219. [4] Wang, H. & Ingersoll, A. P. (2002) JGR (Planets), 107(E10), 8-1-8-16. [5] Clancy, R. T. et al (2019) Icarus, 328, 246-273. [6] Liuzzi G. et al (2020) JGR (Planets), 125(4). [7] Stcherbinine, A. et al (2020) JGR (Planets), 125(3). [8] Aoki, S. et al (2018) Icarus, 302, 175-190. [9] Listowski, C. et al (2014) Icarus, 237, 239-261. [10] Hayne, P. O. et al (2012) JGR (Planets), 117(E8). [11] Patel, M. R. et al (2017) Appl. Opt., 56(10), 2771-2782. [12] Vandaele, A. C. et al (2015) Planet. Space Sci., 119, 233-249.
How to cite: Streeter, P., Sellers, G., Wolff, M., Mason, J., Patel, M., Lewis, S., Holmes, J., Daerden, F., Thomas, I., Ristic, B., Willame, Y., Depiesse, C., Vandaele, A. C., Bellucci, G., and López-Moreno, J. J.: Mesospheric water ice clouds in Mars Year 34-35 as identified in ExoMars UVIS occultation opacities, Europlanet Science Congress 2021, online, 13–24 Sep 2021, EPSC2021-725, https://doi.org/10.5194/epsc2021-725, 2021.
The NOMAD (“Nadir and Occultation for MArs Discovery”) spectrometer suite on board the ExoMars Trace Gas Orbiter (TGO) has been designed to investigate the composition of Mars' atmosphere using a suite of three spectrometers operating in the UV-visible and infrared. NOMAD is a spectrometer operating in ultraviolet (UV), visible and infrared (IR) wavelengths covering large parts of the 0.2-4.3 µm spectral range [1].
The UV-visible “UVIS” instrument covers the spectral range from 200 to 650 nm and can perform solar occultation, nadir and limb observations [2]. The main purpose of UVIS is dedicated to the analysis and monitoring of ozone and aerosols such as dust and ice clouds. In the present work we will present preliminary results of the aerosol retrieval in the UV recorded in nadir geometry: spatial and seasonal distribution of ice clouds and dust.
References
[1] Vandaele et al. 2018. Space Sci. Rev.
[2] Patel et al., 2017. Applied Optics.
How to cite: Willame, Y., Mason, J., Vandaele, A. C., Erwin, J., Piccialli, A., Depiesse, C., Wolff, M. J., Daerden, F., Thomas, I. R., Ristic, B., Patel, M. R., Bellucci, G., and Lopez-Moreno, J.-J.: Nadir retrieval of ice clouds and dust from NOMAD/UVIS on board Exomars TGO, Europlanet Science Congress 2021, online, 13–24 Sep 2021, EPSC2021-715, https://doi.org/10.5194/epsc2021-715, 2021.
NOMAD [1] (Nadir and Occultation for MArs Discovery) is a multi-channel spectrometer onboard the ExoMars 2016 Trace Gas Orbiter (TGO), which began its observations in April 2018. The Solar Occultation (SO) channel has a spectral range coverage from 2.3 to 4.3 μm (2320 to 4350 cm-1). An Acousto-Optical Tunable Filter (AOTF) is used to select different spectral windows (with a width that varies from 20 to 35 cm-1) corresponding to the desired diffraction orders to be used during the atmospheric scan. The SO channel has a sample rate of ∼1 s, that allows a vertical sampling of ∼1 km. In order to obtain as much information as possible from the Martian atmosphere, for this study we have analyzed data from diffraction orders 134 (3011-3035 cm-1) and 168 (3775-3805 cm-1), taken simultaneously during different solar occultation scans within the first year of measurements. This combination of diffraction orders allowed us to explore the distribution of the water vapor at atmospheric tangent altitudes from ∼10 km up to about ∼100 km and in different atmospheric conditions, but also to study its spatial and seasonal variability.
Here we present the water vapor vertical profiles of a subset of the solar occultations observed during the first year of TGO/ExoMars, including data taken during the 2018 Global Dust Storm (GDS) and during the 2019 local dust storm. Similar studies have been done by [2] and [3], showing that dust storms allow water vapor to reach higher altitudes in the atmosphere. Also, thanks to this phenomenon, escape of atomic hydrogen has a relevant role in the planetary evolution, as [4] shows. The data presented here have been analyzed with pre-processing and cleaning tools developed entirely at the IAA, and then, have been inverted using a state-of-the-art retrieval scheme [5]. Our method allows us to use consistent temperature profiles during the inversion i.e., obtained from inversion of other diffraction orders’ measurements of the same scan (see companion contributions to this conference [6], [7], [8]). This impose the limitation to use a dataset where CO2 orders and H2O orders have been observed simultaneously. Also, synthetic spectra have been generated mimicking the NOMAD SO behavior as a first step of a comprehensive error analysis. Preliminary results will also be presented, showing water vapor vertical profiles and estimations of hydrogen escape. Comparisons with results of other groups in the NOMAD team will be shown [9], [10].
Acknowledgments
The IAA/CSIC team acknowledges financial support from the State Agency for Research of the Spanish MCIU through the ‘Center of Excellence Severo Ochoa’ award for the Instituto de Astrofísica de Andalucía (SEV- 2017-0709) and funding by grant PGC2018-101836-B-100 (MCIU/AEI/FEDER, EU). ExoMars is a space mission of the European Space Agency (ESA) and Roscosmos. The NOMAD experiment is led by the Royal Belgian Institute for Space Aeronomy (IASB-BIRA), assisted by Co-PI teams from Spain (IAA-CSIC), Italy (INAF-IAPS), and the United Kingdom (Open University). US investigators were supported by the National Aeronautics and Space Administration.
References
[1] Vandaele, A. C. et al. NOMAD, an integrated suite of three spectrometers for the ExoMars Trace Gas mission: technical description, science objectives and expected performance. Space Science Reviews 214, 1-47 (2018).
[2] Aoki, S. et al. Water vapor vertical profiles on Mars in dust storms observed by TGO/NOMAD. Journal of Geophysical Research: Planets (2019).
[3] Fedorova, A. A. et al. Stormy water on Mars: The distribution and saturation of atmospheric water during the dusty season. Science 367, 297{300 (2020).
[4] Chaffin, M., Deighan, J., Schneider, N. & Stewart, A. Elevated atmospheric escape of atomic hydrogen from Mars induced by high-altitude water. Nature geoscience 10, 174-178 (2017).
[5] Jurado Navarro, A. A. et al. Retrieval of CO2 and collisional parameters from the MIPAS spectra in the earth atmosphere (2016).
[6] López-Valverde, M. A. et al. CO2 and Temperature vertical profiles in the Martian atmosphere from solar occultation measurements at 2.7 μm by instruments NOMAD and ACS on board the Exomars Trace Gas Orbiter. EPSC (2021).
[7] Modak, A. et al. Retrieval of Martian CO vertical profiles from NOMAD solar occultation measurements. EPSC (2021).
[8] Stolzenbach, A. et al. Vertical profiles of Martian aerosols nature and distribution parameters retrievals from NOMAD-SO. EPSC (2021).
[9] Aoki, S. et al. Water vapor vertical distributions on Mars: Results from three years of TGO/NOMAD science operations (EPSC2021-153). EPSC (2021).
[10] Villanueva, G. L. et al. Water heavily fractionated as it ascends on Mars as revealed by ExoMars/NOMAD. Science Advances 7, eabc8843 (2021).
How to cite: Brines, A., Lopez-Valverde, M. A., Stolzenbach, A., Modak, A., Hill, B., Funke, B., González-Galindo, F., Lopez Moreno, J. J., Aoki, S., Vandaele, A. C., Daerden, F., Thomas, I., Erwin, J., Trompet, L., Ristic, B., Villanueva, G., Liuzzi, G., Patel, M., and Bellucci, G.: Martian water vapor vertical profiles from solar occultation measurements by NOMAD onboard TGO/ExoMars: H2O-Temperature retrievals with the IAA-KOPRA forward model, Europlanet Science Congress 2021, online, 13–24 Sep 2021, EPSC2021-579, https://doi.org/10.5194/epsc2021-579, 2021.
Nadir and Occultation for Mars Discovery (NOMAD) onboard ExoMars Trace Gas Orbiter (TGO) started science measurements on 21 April, 2018. Here, we present results on the retrievals of water vapor vertical distributions in the Martian atmosphere from three years of TGO/NOMAD science operations.
NOMAD is a spectrometer operating in the spectral ranges between 0.2 and 4.3 μm onboard ExoMars TGO. NOMAD has 3 spectral channels: a solar occultation channel (SO – Solar Occultation; 2.3–4.3 μm), a second infrared channel capable of nadir, solar occultation, and limb sounding (LNO – Limb Nadir and solar Occultation; 2.3–3.8 μm), and an ultraviolet/visible channel (UVIS – Ultraviolet and Visible Spectrometer, 200–650 nm). The infrared channels (SO and LNO) have high spectral resolution (λ/dλ~10,000–20,000) provided by an echelle grating used in combination with an Acousto Optic Tunable Filter (AOTF) which selects diffraction orders. The sampling rate for the solar occultation measurement is 1 second, which provides a good vertical sampling step (~1 km) with higher resolution (~2 km) from the surface to 200 km. Thanks to the instantaneous change of the observing diffraction orders achieved by the AOTF, the SO channel is able to measure five or six different diffraction orders per second in solar occultation mode. In this study, we analyze the solar occultation measurements at diffraction order 134 (3011-3035 cm-1), order 136 (3056-3080 cm-1), order 168 (3775-3805 cm-1), and order 169 (3798-3828 cm-1) acquired by the SO channel in order to investigate water vapor vertical distributions.
Knowledge of the water vapor vertical profile is important to understand the water cycle and its escape process. Solar occultation measurements by two new spectrometers onboard TGO - NOMAD and Atmospheric Chemistry Suite (ACS) - allows us to daily monitor the water vapor vertical distributions through the whole Martian Year and obtain a good latitudinal coverage for every ~20° of Ls. In 2018, for the first time after 2007, a global dust storm occurred on Mars. It lasted for more than two months (from June to August). Moreover, following the global dust storm, a regional dust storm occurred in January 2019. The NOMAD and ACS observations therefore fully cover the majority of the global and regional dust storms and offer a unique opportunity to study the trace gases distributions during the dust storms. We analyzed those datasets and found a significant increase of water vapor abundances in the middle atmosphere (40-100 km) during the global dust storm from June to mid-September 2018 and the regional dust storm in January 2019. In particular, water vapor reaches very high altitude, at least 100 km, during the global dust storm (Aoki et al., 2019, Journal of Geophysical Research, Volume124, Issue12, Pages 3482-3497, doi:10.1029/2019JE006109). A GCM simulation explained that dust storm related increases of atmospheric temperatures suppress the hygropause, hence reducing ice cloud formation and so allowing water vapor to extend into the middle atmosphere (Neary et al., 2020, Geophysical Research Letters, accepted, Volume47, Issue7, e2019GL084354, doi: 10.1029/2019GL084354). This study presents the results with the extended dataset, which covers a full Mars year. The extended dataset newly includes aphelion season that involves interesting phenomena such as sublimation of water vapor from the northern polar cap and formation of the equatorial cloud belt, which are known as key periods to understand the large north-south hemispheric asymmetries of Mars water vapor. Yet, only a few papers report the water vapor vertical distributions in the aphelion season. The extended dataset also includes the southern summer season (dusty season) in MY 35, which will allow us to compare the water vapor distributions in the global dust storm year with those in the non-global dust storm year. In the presentation, we will discuss the water vapor vertical profiles as well as the aerosols vertical distributions retrieved from the three-year measurements of the TGO/NOMAD.
How to cite: Aoki, S., Vandaele, A. C., Daerden, F., Villanueva, G., Liuzzi, G., Lopez-Valverde, M. A., Brines, A., Thomas, I., Erwin, J., Trompet, L., Robert, S., Neary, L., Viscardy, S., Piccialli, A., Fedorova, A., Kleinbohl, A., Clancy, T., Patel, M., and Holmes, J. and the NOMAD team: Water vapor vertical distributions on Mars: Results from three years of TGO/NOMAD science operations, Europlanet Science Congress 2021, online, 13–24 Sep 2021, EPSC2021-153, https://doi.org/10.5194/epsc2021-153, 2021.
By the utilisation of a novel synergistic approach, we constrain the vertical distribution of water vapor on Mars with nadir-pointing instruments. Water vapor column abundances were retrieved simultaneously from PFS (sensing the thermal infrared range) and SPICAM (sensing the near-infrared range) on Mars Express, yielding distinct yet complementary sensitivity to different parts of the atmospheric column. This approach offers a way to study the vertical partitioning of water, which has remained out of the scope of nadir observations made by single instruments covering a specific spectral range. Here we present a global dataset covering all seasons and latitudes, with measurements taken over 8 Martian years. Special focus is given to the high-latitude regions in spring and summer during the sublimation of the seasonal polar cap. A significant deviance was discovered between the retrieved vertical distribution water vapor, and the predicted profile from the Mars Climate Database, which is used as prior. We also show that by exploiting a synergistic retrieval approach, we obtain more accurate water vapor column abundances compared to when only one instrument is used. The synergistic retrieval has a tendency to obtain a lower total column abundance compared to the prior, albeit with a stronger vertical partitioning. This indicates a more prominent low-altitude layer, with more water vapor contained close to the surface than predicted by models.
How to cite: Knutsen, E. W., Montmessin, F., Lefèvre, F., Giuranna, M., and Verdier, L.: Constraints on water vapor content in the lower atmosphere of Mars, Europlanet Science Congress 2021, online, 13–24 Sep 2021, EPSC2021-528, https://doi.org/10.5194/epsc2021-528, 2021.
HDO and the D/H ratio are important in order to understand Mars past and present climate, in particular regarding the evolution through ages of the Martian water cycle.
We present simulations of the HDO cycle with the LMD Mars GCM and compare the retrieved cycle with observations provided by the Atmospheric Chemistry Suite (ACS) on board the ESA/Roscosmos Trace Gas Orbiter (TGO).
This work is a companion study of Vals et al. presented in session TP12, which presents the evolutions of the model since Rossi et al, (2021), and explores the behaviour of the D/H ratio cycle when taking into account the microphysics and radiative effect of clouds, as well as the effect of kinetics on fractionation during condensation.
Introduction
Mars is known to have had a significant liquid water reservoir on the surface and the D/H ratio derived from the HDO/H2O abundance ratio is a sensitive tool to constrain the primordial abundance of the water reservoir on Mars and its evolution with time. The current ratio is at least five times that of the Vienna Standard Mean Ocean Water (SMOW) (Owen et al. 1988 , Encrenaz et al. 2018, Krasnopolsky 2015, Villanueva et al. 2015).
H and D atoms in the upper atmosphere come from H2O and HDO, their sole precursor in the lower atmosphere. The lower mass of H over D atoms and the fact that H2O is preferentially photolysed over HDO (Cheng et al. 1999) explain the differential escape of these two elements. Also, the heavier isotope, HDO, has a lower vapor pressure than H2O, which results in an enrichment of the deuterated isotope in the solid phase of water. This effect is known as the Vapor Pressure Isotope Effect (VPIE) and can reduce the D/H ratio above the condensation level to values as low as 10% of the D/H ratio near the surface (Bertaux et al. 2001, Fouchet et al. 2000). Fractionation should affect the amount of HDO depending on latitude, longitude, altitude and season (Montmessin et al. 2005, Rossi et al. 2021).
Modeling HDO
We present here the results from our (re)integration of the HDO cycle into the LMD Mars GCM, taking into account HDO in its vapour and ice phases in the atmosphere, and as surface ice. In Rossi et al. (2021), we presented first results with a dust annual scenario mimicking the dust seasonal and spatial evolution observed during Martian Year 34 (MY34) and including the occurrence of the Global Dust Storm (GDS).
The simulations illustrated the effect of the dust on the temperature field, and therefore on the circulation and the cloud formation. Since clouds are forming at higher altitude (if at all), the deuterium is less constrained vertically and can extend to higher altitudes. A similar effect being observed for water vapour (Fedorova et al., 2020).
In Rossi et al. (2021) we used a simplified cloud formation scheme, without condensation nuclei, and didn't include the radiative effect of clouds.
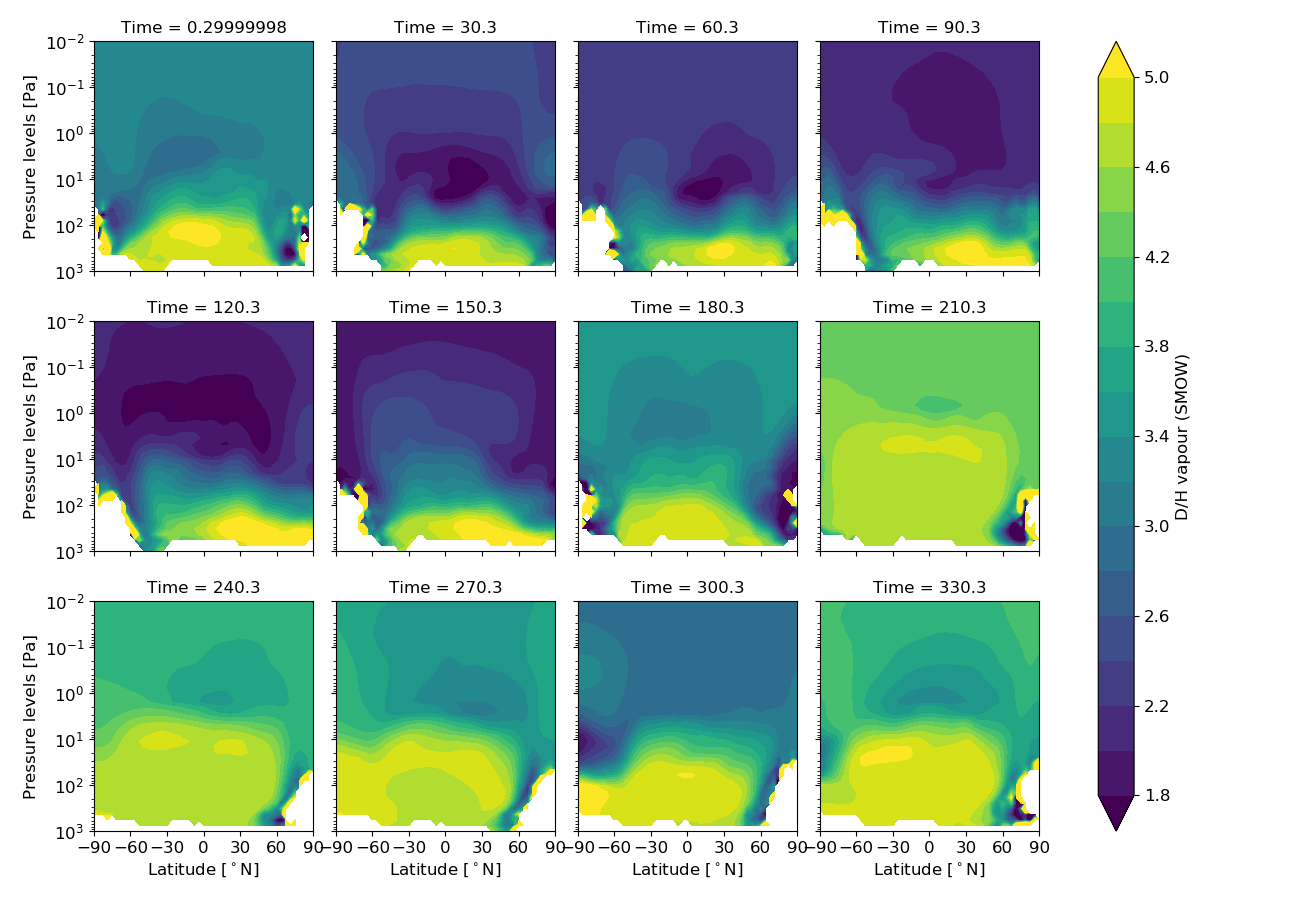
Figure 1: Zonally averaged meridional profiles of the D/H ratio in the vapour phase, as predicted by the updated GCM for MY34. Each subplot shows the beginning of each month.
Here we present results of a new version of the model, this time including the microphysics of cloud formation, the radiative effect of clouds but also the effect of kinetics on the fractionation factor (see companion abstract of Margaux Vals in TP12). As shown in Fig 1, the effect of the dust storm of MY34 is still quite visible, with a D/H ratio relatively constant in higher parts of the atmosphere (up to 1 Pa). With this updated model, we are able to make comparisons with the HDO profiles observed by ACS onboard TGO.
Preliminary results
In order to be comparable with the solar occultations from ACS, the GCM output is interpolated at a solar zenith angle of 90° and at the coordinates (latitude, longitude, local time and solar longitude) of each solar occultation. In particular, we compare the model with ACS observations presented in Alday et al. (2021). Figure 2 presents some early results of such comparison.
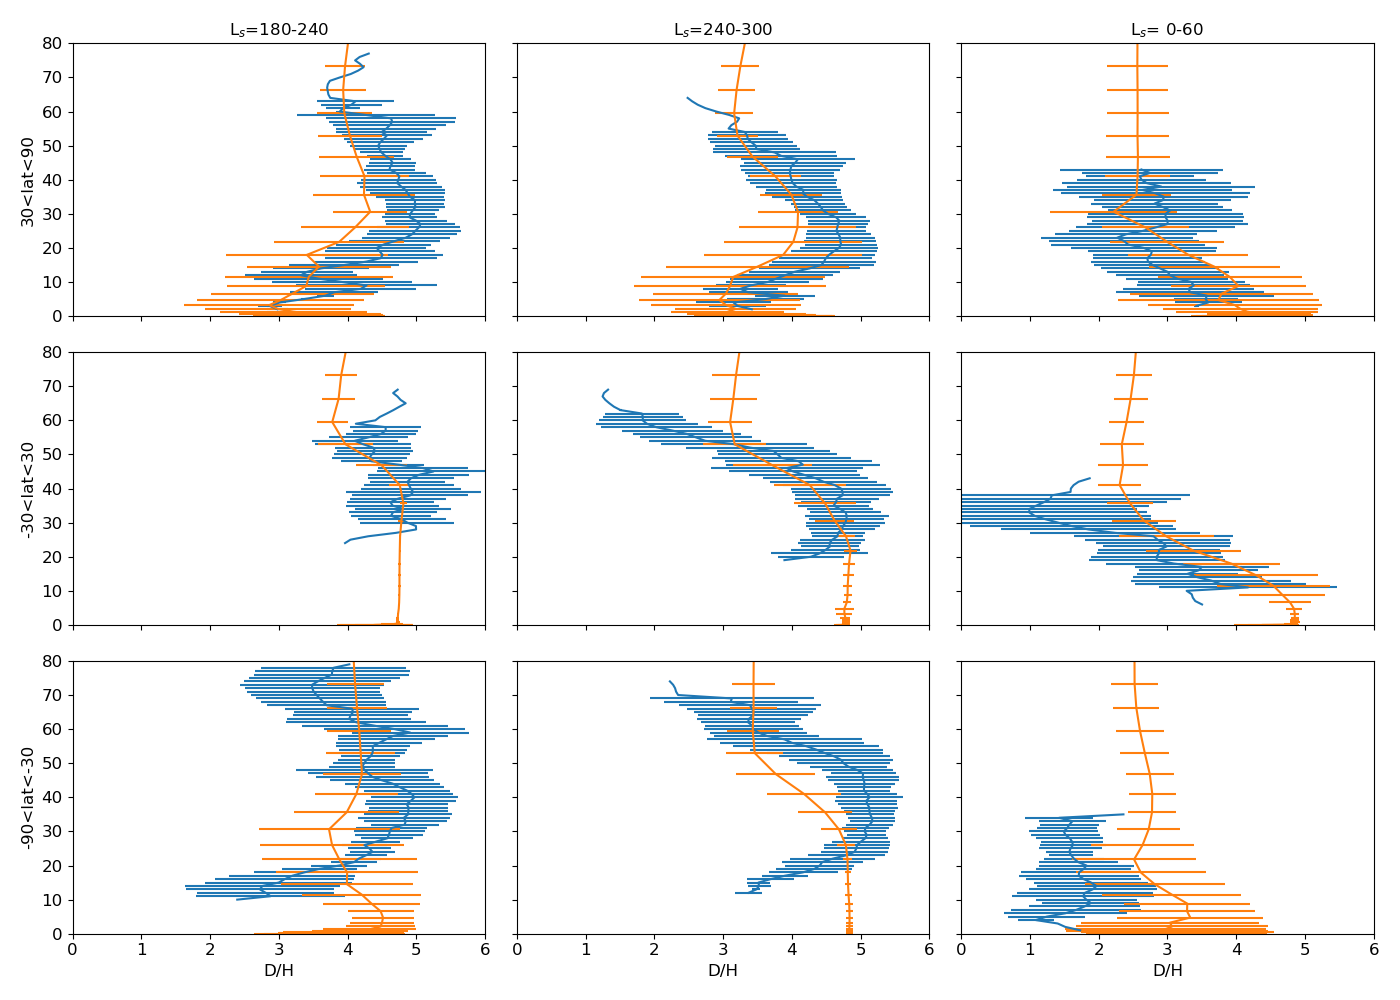 Figure 2: Profiles of the D/H ratio from the GCM (in orange) and from ACS data (in blue). Profiles are averaged over bins of solar longitude (covering the end of MY34 and the beginning of MY35) and latitude. Error bars indicate the standard deviation within the bin. The altitude is given in kilometers above the areoid.
The comparison shows a good agreement between the GCM profiles and the observations for the D/H ratio in several bins in latitude and solar longitude. This indicates that the model is capable of representing the process of isotopic fractionation and its effect on the D/H ratio.
A more detailed comparison between the observations and the GCM, in particular with respect to the distribution of water vapour is ongoing.
Acknowledgements
ExoMars is the space mission of ESA and Roscosmos. The ACS experiment is led by IKI Space Research Institute in Moscow. The project acknowledges funding by Roscosmos and CNES. Science operations of ACS are funded by Roscosmos and ESA. Science support in IKI is funded by Federal agency of science organizations (FANO). L.R. acknowledges support from CNES and from the Excellence Laboratory "Exploration Spatiale des Environnements Planétaires (ESEP)".
How to cite: Rossi, L., Vals, M., Montmessin, F., Alday, J., Braude, A., Forget, F., Millour, E., Olsen, K., Fedorova, A., Trokhimovskiy, A., and Korablev, O.: Comparison of the HDO cycle in the LMD Mars GCM with ACS/TGO observations, Europlanet Science Congress 2021, online, 13–24 Sep 2021, EPSC2021-281, https://doi.org/10.5194/epsc2021-281, 2021.
Introduction
Recently, [1] characterized the relation between ozone and water vapor using SPICAM simultaneous measurements of O3 and H2O column densities covering four Martian years. They found that O3 and H2O columns are clearly anti-correlated at high latitudes while being uncorrelated at low latitudes.
In our study, we take advantage of the NOMAD capability to measure simultaneous vertical profiles of ozone and water vapor to characterize the O3 – H2O relationship at different altitude ranges and latitudes.
1. Ozone and water vapor profile retrievals
NOMAD (Nadir and Occultation for MArs Discovery) is a spectrometer composed of 3 channels: 1) a solar occultation channel (SO) operating in the infrared (2.3-4.3 μm); 2) a second infrared channel LNO (2.3-3.8 μm) capable of doing nadir, as well as solar occultation and limb; and 3) an ultraviolet/visible channel UVIS (200-650 nm) that can work in the three observation modes [2,3].
The UVIS channel has a spectral resolution <1.5 nm. In the solar occultation mode it is mainly devoted to study the climatology of ozone and aerosols content [4]. NOMAD-UVIS spectra are simulated using the line-by-line radiative transfer code ASIMUT-ALVL developed at IASB-BIRA [5] using the Optimal Estimation Method to derive the local density profile in one go (on all transmittances of one occultation observation).
Water vapor was observed by the infrared channel of the NOMAD SO. The results from a first analysis can be found in [6], while an extended dataset is presented in a companion abstract [7]. Water vapor and ozone are measured simultaneously, which allows us to investigate the water-ozone correlation, the key to address the atmospheric chemistry on Mars.
2. Preliminary results
We will present correlation plots of O3 vs. H2O at high latitudes (60° – 90°, both hemispheres), and at the equator (30°S – 30°N). Figure 1 displays a preliminary example in the 60°N – 90°N latitude region. A clear anti-correlation is observed at lower altitudes (10 – 20 km and 20 – 30 km). O3 is roughly inversely proportional to H2O. At altitudes above 30 km, the O3 – H2O curve shows a plateau with a large scattering of the data points. This is visible especially in the altitude range 40 – 50 km.

Figure 1: O3 (cm-3) vs. H2O (cm-3) vertical profiles measured simultaneously by NOMAD-UVIS at high latitudes in the Northern hemisphere (60°N-90°N). (a) 10 – 20 km; (b) 20 – 30 km; (c) 30 – 40 km; (d) 40 – 50 km. Colours indicate the Ls interval. The black line shows the function O3 =H2Ox, with x varying with the altitude range.
References
[1] Lefèvre, F. et al. Relationship between the Ozone and Water Vapor columns on Mars as Observed by SPICAM and Calculated by a Global Climate Model. Journal of Geophysical Research. Planets, Wiley-Blackwell, 2021, e2021JE006838 (in press). 10.1029/2021JE006838.
[2] Vandaele, A.C., et al., Planetary and Space Science, Vol. 119, pp. 233–249, 2015.
[3] Neefs, E., et al., Applied Optics, Vol. 54 (28), pp. 8494-8520, 2015.
[4] M.R. Patel et al., In: Appl. Opt. 56.10 (2017), pp. 2771–2782. DOI: 10.1364/AO.56.002771.
[5] Vandaele, A.C., et al., JGR, 2008. 113 doi:10.1029/2008JE003140.
[6] Aoki et al., 2019, Journal of Geophysical Research, Volume124, Issue12, Pages 3482-3497, doi:10.1029/2019JE006109
[7] Aoki et al., Europlanet Science Congress 2021, ID EPSC2021-153.
How to cite: Piccialli, A., Vandaele, A. C., Aoki, S., Willame, Y., Depiesse, C., Trompet, L., Neary, L., Viscardy, S., Daerden, F., Erwin, J., Thomas, I. R., Ristic, B., Mason, J., Patel, M., Khayat, A., Wolff, M., Bellucci, G., and Lopez Moreno, J. J.: Relationship between the ozone and water vapour vertical profiles on Mars observed by NOMAD-TGO, Europlanet Science Congress 2021, online, 13–24 Sep 2021, EPSC2021-556, https://doi.org/10.5194/epsc2021-556, 2021.
The Ultraviolet and Visible Spectrometer (UVIS) channel [1] of the Nadir and Occultation for Mars Discovery (NOMAD) instrument [2] aboard the ExoMars Trace Gas Orbiter has been making observations of the vertical, latitudinal and seasonal distributions of ozone. Here, we present ~1.5 Mars Years (MY) of vertical profiles of ozone, from LS = 163° in MY34 to LS = 320° in MY35. This period includes the occurrence of the MY34 Global Dust Storm. The relative abundance of both ozone and water (from coincident NOMAD measurements) increases with decreasing altitude below ~40 km at perihelion and at aphelion, localised decreases in ozone abundance exist between 25-35 km coincident with the location of modelled peak water abundances. High latitude (> ± 55°), high altitude (40-55 km) equinoctial ozone enhancements are observed in both hemispheres (LS ~350‑40°). Morning terminator observations show elevated ozone abundances with respect to evening observations, most likely attributed to diurnal photochemical partitioning along the line of sight between ozone and O. The ozone retrievals presented here provide the most complete global description of Mars ozone vertical distributions to date as a function of season and latitude
How to cite: Patel, M. R., Seller, G., Mason, J., Holmes, J., Brown, M., Lewis, S., Rajendran, K., Streeter, P., Marriner, C., Hathi, B., Slade, D., Leese, M., Wolff, M., Khayat, A., Smith, M., Aoki, S., Piccialli, A., Vandaele, A. C., Robert, S., and Daerden, F. and the the NOMAD Team: Seasonal variation of ozone vertical profiles form ExoMars TGO and comparison to water, Europlanet Science Congress 2021, online, 13–24 Sep 2021, EPSC2021-550, https://doi.org/10.5194/epsc2021-550, 2021.
Introduction: The spatial and temporal variation of ozone (O3) is key to understanding ongoing atmospheric processes and transport in the martian atmosphere[1]. As a photochemically active species, O3 has been used to validate the photochemistry of short lived species and, by extension, the water vapour cycle [2,3,4,5] and as a tracer to track the global circulation[6].
The Ultraviolet and Visible Spectrometer (UVIS) instrument[7], a channel of the NOMAD spectrometer suite[8], has been in orbit around Mars for over two years with near continuous nadir observations through the latter half of Mars Year(MY) 34 through to MY36. The UVIS observations provide high resolution spatial and temporal maps of O3 column abundance and provides observations at different local times.
A retrieval procedure was developed, using spectral measurements over the Hartley band to obtain the O3 column abundances. The radiative transfer simulation is performed using the discrete ordinates DISORT package[9] and we employ the ‘front-end’ routines (DISORT_MULTI) developed by Mike Wolff, for studies of the martian atmosphere [1,10,11]
Results: In this work we present the geographic and seasonal distribution of O3 in the martian atmosphere as measured by UVIS between LS = 148 and 360° in Mars Year 34 (April 2018 to March 2019). Seasonally the O3 distribution is consistent, with low O3 abundances in equatorial regions and higher O3 abundances at higher latitudes in the winter season. As the martian atmosphere cools through northern spring between Ls = 350°(MY34) and Ls = 90°(MY35), due to the reduced solar insolation, we observed a steady increase in equatorial O3, coinciding with the onset of the aphelion cloud belt. The equatorial O3 peaks near the northern winter solstice Ls = 90°, associated with the cooler and dryer atmosphere of the martian aphelion season before reducing again as the atmosphere warms and more water vapour enters the atmosphere.
Ozone entrapment[1] is observed in large impact basins, such as the Hellas Basin and to a lesser extent Argyre Planitia. Ozone abundances measured within Hellas can be an order of magnitude higher than the surrounding regions with abundances of 20 µm-atm observed within Hellas compared to 2-5 µm-atm in the surrounding area at aphelion. Ozone entrapment is still observed during the perihelion season, with abundances within Hellas being 5-10 µm-atm.
The UVIS dataset provides comprehensive seasonal coverage between latitudes ~74° N and 74° S and samples multiple local times at a giving location enabling unprecedented detail in the O3 diurnal cycle.
References:[1] Clancy, R. T, et al. Icarus 266 (2016). [2] Lefèvre, F, et al. Nature 454.7207 (2008). [3] Montmessin, F and Lefèvre, F. Nature Geoscience 6.11 (2013). [4] Holmes, J,A. et al. Icarus 302 (2018). [5] Daerden, F., et al. Icarus 326 (2019). [6] Holmes, J,A. et al. Icarus 282 (2017). [7] Patel, M, R., et al. Applied Optics 56.10 (2017). [8] Neefs, Eddy, et al. Applied Optics 54.28 (2015). [9] Stamnes, Knut, et al. Applied Optics 27.12 (1988). [10] Wolff, M, J., et al. Icarus 208.1 (2010). [11] Wolff, M, J., et al. Icarus 332 (2019).
How to cite: Mason, J., Patel, M., Holmes, J., Streeter, P., Brown, M., Sellers, G., Marriner, C., Lewis, S., Wolff, M., Willame, Y., Depiesse, C., Ristic, B., Thomas, I., Daerden, F., Vandaele, A.-C., López Moreno, J. J., and Bellucci, G.: The distribution of ozone on Mars as measured by the NOMAD-UVIS spectrometer in Mars year 34., Europlanet Science Congress 2021, online, 13–24 Sep 2021, EPSC2021-655, https://doi.org/10.5194/epsc2021-655, 2021.
NASA’s InSight lander continues to record high-quality seismic data from the surface of Mars two and a half years after landing [1,7,9]. The data collected by the SEIS seismometer package [8] are routinely monitored by the Marsquake Service (MQS) [4,5], a core mission service that is tasked with curating the Martian seismicity catalogue. To date, more than 500 distant marsquakes have been identified, which can be classified by their frequency content into high- and low- frequency event families [4,7,10]. In addition, the catalogue includes over 800 short-duration events potentially associated with local thermal cracking [6]. The local atmospheric conditions have a strong influence on the seismic noise level, which varies from levels below pre-mission expectation during the evening, to high-noise levels during the day owing to strong winds and atmospheric turbulence. Due to the low signal amplitude of the marsquakes, their detection is mainly restricted to evenings and nights with low to moderate winds. Following the marsquake detection and discrimination from atmospherically-induced energy, MQS identifies crustal and body phase arrivals and proposes a distance based on the travel time differences. Only a handful of low-frequency marsquakes have a clear polarized arrival that allows MQS to determine the backazimuth and hence provide an event location. Deep into the second Martian season of continuous seismic observation, we provide an update on the recent seismicity and the seasonally repeating features of the dataset. This includes an overview of MQS’ procedures of monitoring the seismic dataset and the different marsquake types observed, as well as a review of event location, magnitude [2], moment tensors [3] and possible seismic sources.
References:
[1] Banerdt, W. Bruce, et al. "Initial results from the InSight mission on Mars." Nature Geoscience 13.3 (2020): 183-189.
[2] Böse, Maren, et al. "Magnitude Scales for Marsquakes Calibrated from InSight Data." Bulletin of the Seismological Society of America (2021).
[3] Brinkman, Nienke, et al. "First focal mechanisms of marsquakes." Journal of Geophysical Research: Planets 126.4 (2021): e2020JE006546
[4] Clinton, John, et al. "The Marsquake catalogue from InSight, sols 0–478." Physics of the Earth and Planetary Interiors 310 (2021): 106595.
[5] Clinton, John, et al. "The Marsquake service: Securing daily analysis of SEIS data and building the Martian seismicity catalogue for InSight." Space Science Reviews 214.8 (2018): 1-33.
[6] Dahmen, Nikolaj, et al. "Super high frequency events: a new class of events recorded by the InSight seismometers on Mars." Journal of Geophysical Research: Planets 126.2 (2021): e2020JE006599.
[7] Giardini, Domenico, et al. "The seismicity of Mars." Nature Geoscience 13.3 (2020): 205-212.
[8] Lognonné, Philippe, et al. "SEIS: Insight’s seismic experiment for internal structure of Mars." Space Science Reviews 215.1 (2019).
[9] Lognonné, Philippe, et al. "Constraints on the shallow elastic and anelastic structure of Mars from InSight seismic data." Nature Geoscience 13.3 (2020): 213-220.
[10] van Driel, Martin, et al. "High‐Frequency Seismic Events on Mars Observed by InSight." Journal of Geophysical Research: Planets 126.2 (2021): e2020JE006670.
How to cite: Dahmen, N. and the InSight's Marsquake Service: The seismicity of Mars, as catalogued by InSight’s Marsquake Service, Europlanet Science Congress 2021, online, 13–24 Sep 2021, EPSC2021-493, https://doi.org/10.5194/epsc2021-493, 2021.
InSight has been measuring atmospheric pressure, wind and temperature almost continuously since December 10, 2018 (around Ls=304° of Martian Year 34), 14 sols after its landing. It is located in Elysium Planitia, at 4.50238°N, 135.62345°E in planetocentric coordinates (-2614 m altitude below MOLA areoid). Hence, the geophysical lander is providing the best long-duration meteorological Mars station since Viking. In this presentation we will review the meteorological phenomenons that characterize the pressure and wind measurements at timescales larger than 1000 seconds. A subset of the meteorological observations obtained at the beginning of the mission was previously reporded in Banfied et al. (2020) and Viúdez-Moreiras et al. (2020) .The analysis is helped by comparing the results with prediction from the LMD numerical global climate model (GCM, Forget et al. 1999) as reported before landing by Spiga et al. (2018).
At such timescale, the pressure measurements are characterized by 1) the large seasonal oscillation mostly due to the CO2 condensation and sublimation cycle; 2) baroclinic waves with periods of typically 2.5 and 7 sols and amplitude up to 4 Pa (Figure 1), and 3) thermal tides with amplitude up to 40 Pa and period of 1 or a fraction of a sol (diurnal, semi-diurnal, etc…).
Similarly, the wind direction and velocity can be decomposed into various components. The diurnal mean wind velocity at 1.2 m is remarkably constant around 5 m/s during the first part of the year between Ls=0° and Ls=200° (Figure 2, top). After that date, during northern fall and winter, the wind is stronger and highly variable from day to day (between 4 and 9 m/s on diurnal average), closely following the baroclinic variations of pressure with maximum wind when the pressure is high. This is expected by the model, but it remains quite spectacular to observe how baroclinic waves can create real weather so close to the equator, with an alternation of quiet and windy sols. Throughout the year, the diurnal-mean wind direction slowly evolves between a northward direction (during most of the northern spring and summer) and west-north-westward direction in fall and winter between Ls=210° and 330° (Figure 2, bottom). This is also predicted by the model and correspond to the expected behavior of trade winds at the Insight landing site (Insight is exposed to a “western boundary current” around N. winter solstice). Superimposed on the diurnal mean flow, the wind is subject to large diurnal variations. As expected, the wind velocity is mostly controlled by the evolution of the boundary layer which tends to strongly reduce the wind velocity at night (between 5pm and 9am) when the atmosphere becomes stratified as the surface cools at night. However this diurnal cycle is not very well predicted by the GCM. Every day, during most of the year, the large-scale dominant wind is modulated by a regular diurnal 360° rotation induced by the weak, but non-negligible Northward-Eastward slope that characterizes the Insight landing site at regional scale. During some specific periods, and in particular during the regional dust storms that characterized Martian year 34 and 35 around Ls=320°, it seems that the planetary-scale thermal tide waves can influence the diurnal cycle in addition to the slope winds. This can be analyzed with the help of GCM simulations in which the region around Insight has been flattened.

Figure 1. The signature of baroclinic waves as a function of season illustrated by the detrended diurnal mean pressure. As previously reported by Haberle et al. (2018) using MSL data, Northern hemisphere baroclinic waves can be be significant at the equator.
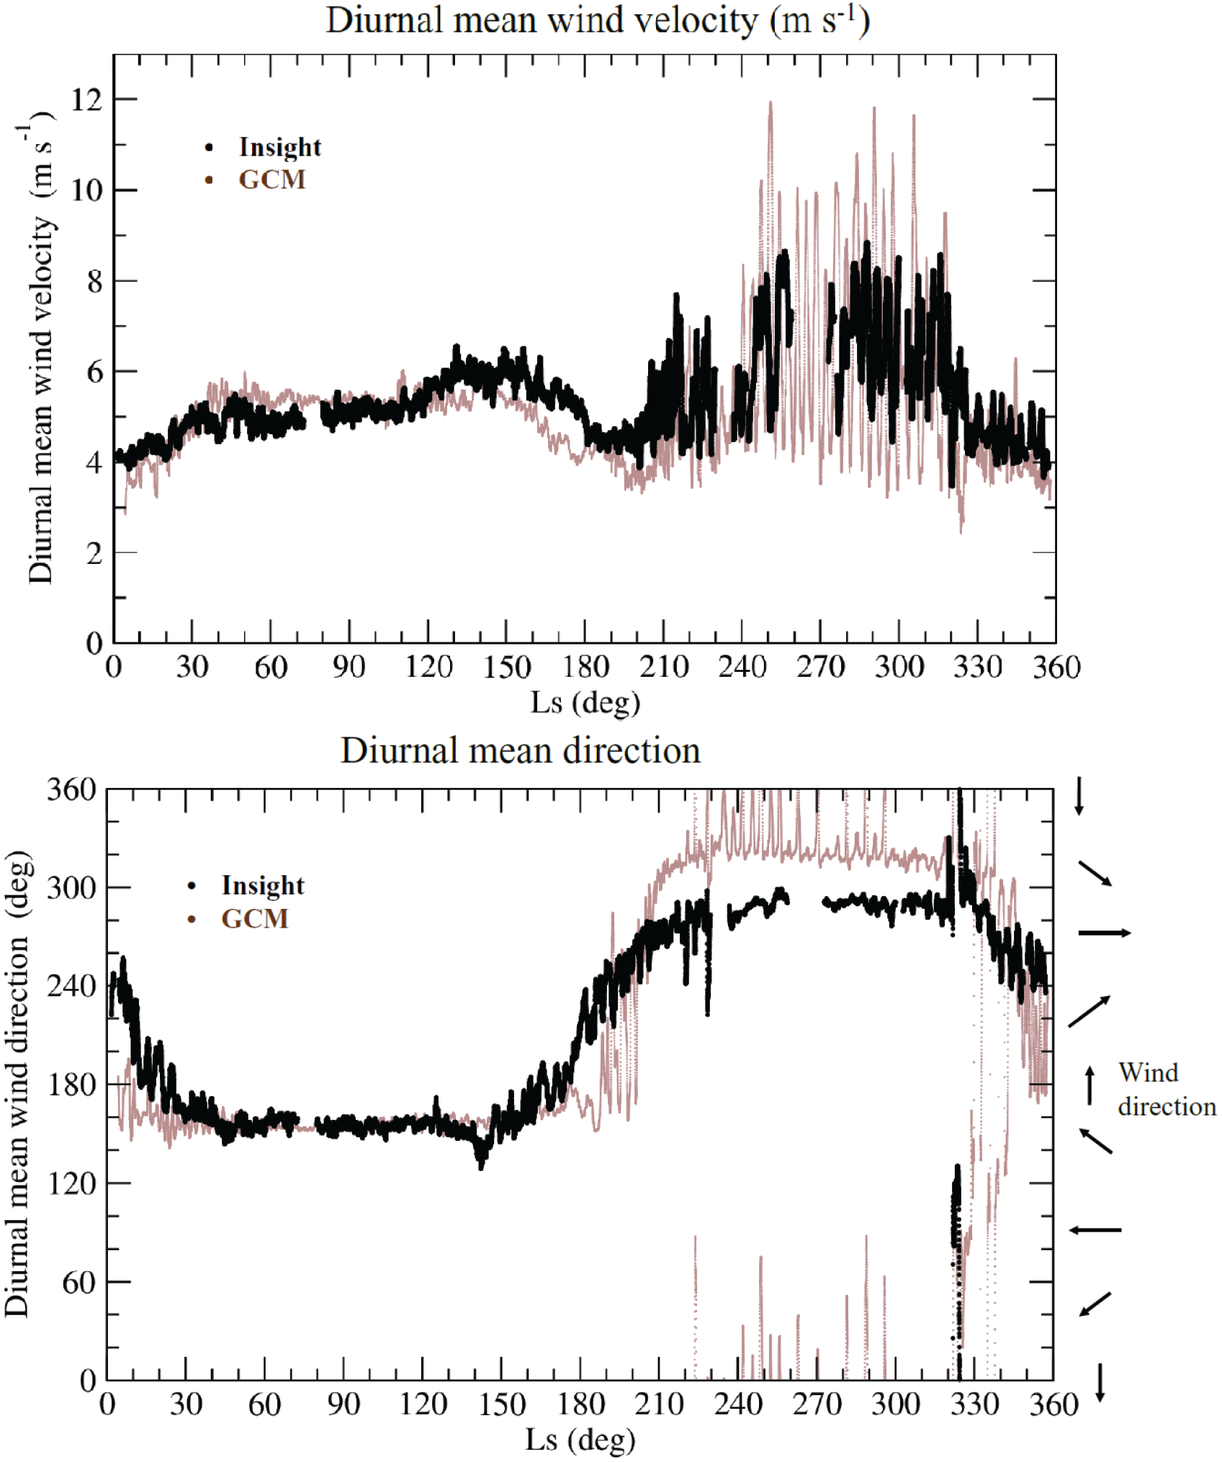
Figure 2: Diurnal mean wind velocity and direction observed by Insight (black), compared to the prediction from the LMD GCM (brown)
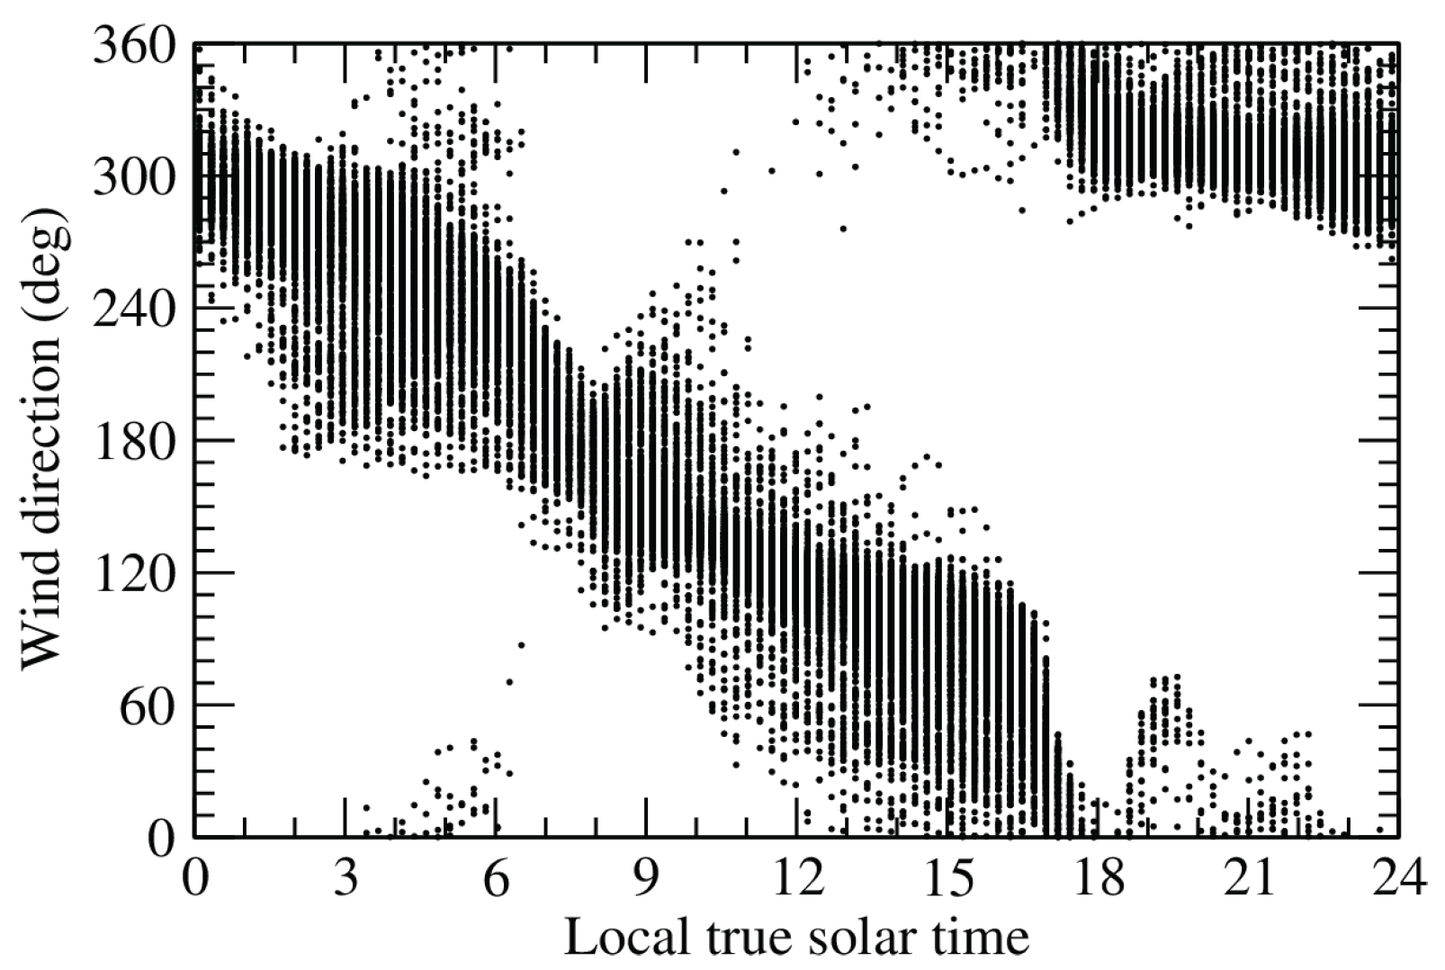
Figure 3: Direction of the wind diurnal anomaly (1000-s averaged wind vector minus diurnal mean vector) as a function of local time during most of the year (period Ls=325°-0°-200°). The direction characterized by the expected diurnal rotation due to slope winds.
How to cite: Forget, F., Banfield, D., Spiga, A., Millour, E., Borella, A., Lange, L., Newman, C., Viúdez Moreiras, D., Pla-Garcia, J., Navarro, S., Mora-Sotomayor, L., Torres-Redondo, J., Rodriguez-Manfredi, J. A., Lewis, S. R., Lorenz, R. D., Lognonne, P., and Banerdt, W. B.: More than one Martian year of meteorology observed by the InSight Lander, Europlanet Science Congress 2021, online, 13–24 Sep 2021, EPSC2021-273, https://doi.org/10.5194/epsc2021-273, 2021.
Abstract
The surface pressure measurements recorded by InSight seem to be the best in terms of precision and stability for comparison with Viking data and to rule on a possible secular climate change. However, the comparison of the measurements between the two consecutive mission years reveals an offset imposed by the sensor temperature. We propose here a correction of this effect by exploiting the MSL REMS data acquired at the same time. The corrected data then follow perfectly the pressure models based on the pressure recorded by MSL during MY 34 and 35 interpolated with the help of the LMD GCM. Further investigations studying the possible difference between Viking 1 and InSight seasonal variations will be presented during the conference.
Introduction
Remote observations of interannual variations in polar cap coverage suggest that the south polar residual cap (SPRC) might be eroding [1,2,3]. Such a change in the SPRC would raise the surface pressure every year. Previous comparisons of surface pressures recorded by Viking 1 with Phoenix data [4] or MSL REMS measurements [5] report a possible increase of pressure at the surface of Mars within 30 years. However, the conclusions were unsure due to the uncertainty of the data for Phoenix, and the sensitivity of the hydrostatic adjustment imposed by the climbing of MSL on the complex Gale crater topography.
In 2018, the InSight lander brought an accurate pressure sensor at Elysium Planitia. The uncertainty due to the long-term instrumental drift and the accuracy of the sensor is negligible compared to the requirement of accuracy to detect this secular climate change [4]. We thus propose to detect any change of CO2 mass in the atmosphere or a change in the seasonality of the polar cap with an accurate comparison between the seasonal pressure variations recorded by Viking 1 and InSight.
Thermal Sensitivity of the Pressure Sensor
A direct comparison between pressure measurements made during the first and second years of the InSight mission shows a strong difference, thus questioning the reliability of the measurements (Figure 1). Considering the large difference between the measured pressure over the two years, and the correlation of some pressure decreases with some drops of the sensor temperature, we believe that the measurements are affected by a possible thermal offset due to a gradient of temperature within the sensor.
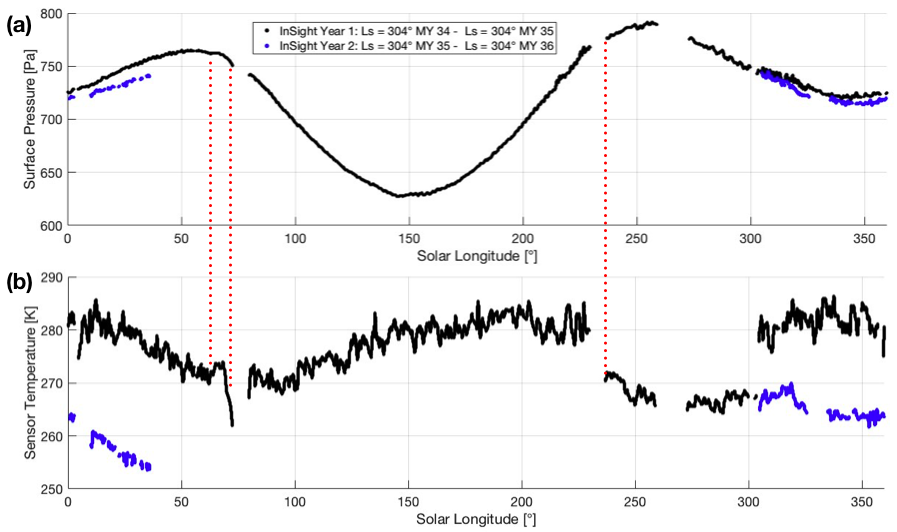
Figure 1. (a) Uncorrected diurnal-averaged surface pressure recorded by InSight during the first and second years of the mission. (b) Diurnal-averaged pressure sensor temperature. Red dashed lines indicate the correlation between drops in the pressure measurements and drops in the sensor temperature records.
Recalibration of the Pressure data
We propose here an empirical calibration to correct this sensor thermal effect. To remove any meteorological effects (thermal tides, baroclinic waves), the measured pressure P is averaged over 10-sols to give < P >10sols. As reported in [6] who used MSL data, it seems that the pressure recorded at the beginning of the mission (Ls < 70°, MY = 35) could be slightly lower than the pressure recorded at the end of the mission (Ls < 70°, MY = 36), possibly as a result of the MY34 global dust storm. To quantify this difference, we interpolated the MSL REMS data available on the PDS with careful altitude corrections. Neglecting the difference of scale height between MY35 and MY36, one may have:
Where:
with E the thermal-induced offset on pressure data described previously. Assuming that E can be written as a polynomial function of the sensor temperature, and introducing (2) and (1) yield to a minimization problem that needs to be constrained to avoid any non-physical solution. Figure 1 presents an unexpected increase of uncorrected pressure at Ls~63°, and then a drop, both certainly resulting from a rise of temperature at T = 270K, followed by a decrease of temperature at T = 275K. Based on this observation, we simply assumed that: E(T = 0°C) = 0.
With this constraint, the optimization problem can be solved and a first temporary correction is:
Applying this correction to InSight measurements following Eq. (2) leads to the results presented in Figure 2.
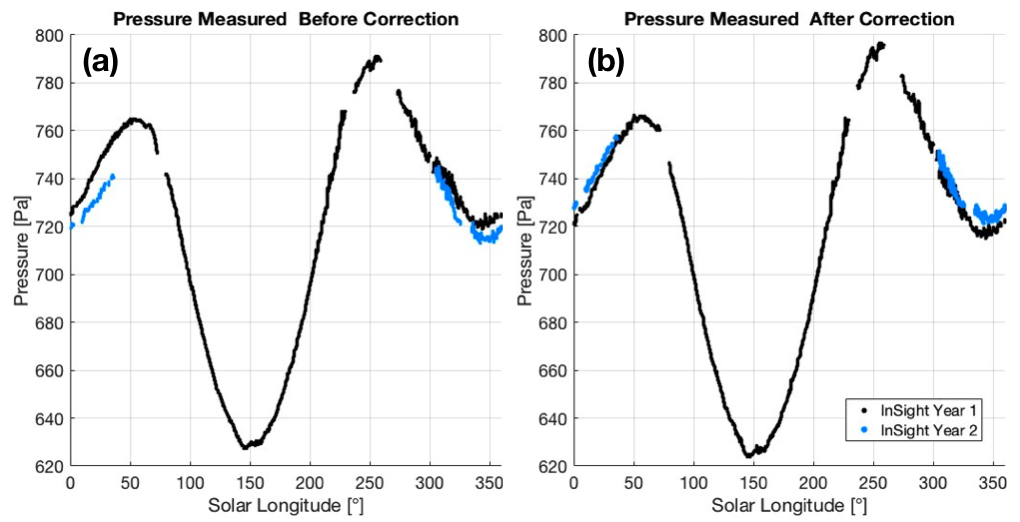
Figure 2. (a) Uncorrected diurnal-averaged surface pressure recorded by InSight during the first and second years of the mission. (b) Diurnal averaged pressure after sensor temperature correction following Eq. (2).
Comparison of the Corrected Pressure and MSL Measurements
To assess the quality of this correction, we interpolate the MSL Measurements from MY35 et MY34 (assuming that MY34 behaves like MY36 for Ls < 70°) to predict the surface pressure at the InSight landing site. MSL measurements are interpolated to the InSight landing site using the hydrostatic correction presented in [7]. Dynamical effects from MSL to InSight landing site are corrected using GCM runs with MY34 and MY35 as input dust scenarios. The comparison is presented in Figure 3 and reveals a good match between the model and the result obtained after correction.
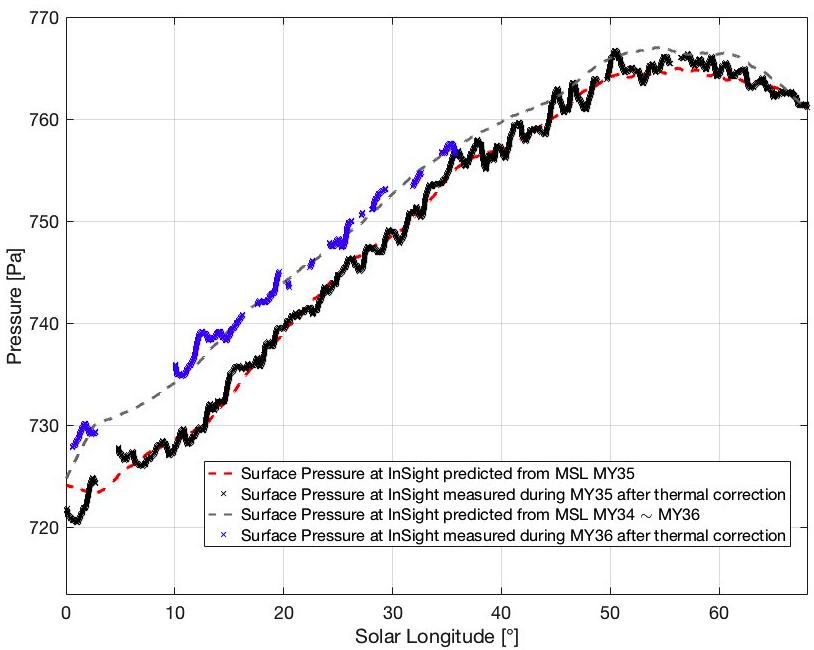
Figure 3. Surface pressure as predicted from the interpolation of MSL REMS measurements, after hydrostatic and dynamic correction (dashed curves) and observations from InSight after thermal correction (crosses). Observations are diurnally-averaged whereas predictions are 10-sols averaged.
Comparison of InSight and Viking 1 Surface Pressure
The comparison between Viking 1 and InSight data after hydrostatic, dynamical, and temperature-induced offset will be presented during the talk. Interpretations and conclusions on a possible secular climate change will be drawn.
References
[1] Malin et al., 2001, Science294(5549), 2146–2148
[2] Thomas et al., 2009, Icarus203, 352–375
[3] Blackburn et al., 2010, Space Sci.58, 780–791
[4] Haberle and Kahre, 2010, Mars Int. J. Mars Sci. Explor5., 68–75
[5] Haberle et al., 2014, J. Geophys. Res., Planets119,440–453
[6] de la Torre Juarez et al., 2019, AGU fall meeting abstracts, Vol. 2019, p. P51C-02
[7] Forget et al., 2007, Planets112(E11), 8
How to cite: Lange, L., Forget, F., Spiga, A., Banfield, D., Millour, E., Newman, C., Pla-García, J., and Viúdez-Moreiras, D.: Comparison of the Seasonal Pressure Variations Recorded by InSight and Viking 1 and Recalibration of InSight Data, Europlanet Science Congress 2021, online, 13–24 Sep 2021, EPSC2021-286, https://doi.org/10.5194/epsc2021-286, 2021.
Attempts have been made to detect secular changes in the Martian climate by comparing surface atmospheric pressure measurements separated by several decades [1][2]. Such multi-mission studies require information on the exact accuracies of the corresponding pressure measurements. In this presentation, we discuss results of our recently published study on the quality of the pressure data measured by the Mars Phoenix lander [3]. In addition, we evaluate the absolute accuracy of the Viking pressure data by using (less well known) sources in the literature [4][5].
Our results show that at the beginning of the Phoenix mission the offset of the pressure measurement was between -4.8 Pa and +0.1 Pa. The drift of the sensor during the mission was between -0.5 Pa and +3.4 Pa. Thus, the Phoenix pressure measurement was much more accurate than was reported immediately after the mission [6]. However, the systematic error of the Viking pressure data could be up to 8.8 Pa.
Haberle and Kahre (2010) found the Phoenix surface pressures to be ~10 Pa higher than the Viking surface pressures after correcting for elevation differences and dynamics [1]. Although our results show the Phoenix measurement to be more accurate than assumed by Haberle and Kahre (2010), the difference they found could still be explained by the uncertainty of the Viking pressure data. On the other hand, our results show that the Phoenix pressure data can be used as an accurate comparison point for future surface pressure measurements on Mars.
References:
[1] Haberle and Kahre, "Detecting secular climate change on Mars ", Mars, 5, 68–75, 2010.
[2] Batterson et al., "Secular Climate Change on Mars: An Update", AGU Fall Meeting, 2017.
[3] Kahanpää et al., "The quality of the Mars Phoenix pressure data", Planet. Space Sci., 181, 104814, 2020.
[4] Seiff, "The Viking atmosphere structure experiment - Techniques, instruments, and expected accuracies", Space Sci. Instrum., 2, 381–423, 1976.
[5] Mitchell, "Evaluation of Viking Lander barometric pressure sensor", NASA Technical Memorandum, NASA-TM-X-74020, 1977.
[6] Taylor et al., "On pressure measurement and seasonal pressure variations during the Phoenix mission", J. Geophys. Res., 115, E00E15, 2010.
Acknowledgments:
The contribution of H. Kahanpää in this study was supported by The Finnish Cultural Foundation [grant number 00170395]. The contribution of M. Daly was supported by the Canadian Space Agency. We wish to thank Germán Martínez (USRA/LPI) for providing a copy of reference article [4].
How to cite: Kahanpää, H., Polkko, J., and Daly, M.: Accuracy of the Phoenix and Viking atmospheric pressure measurements: impact on detecting the climate change on Mars, Europlanet Science Congress 2021, online, 13–24 Sep 2021, EPSC2021-63, https://doi.org/10.5194/epsc2021-63, 2021.
The characterisation of the Martian radiation environment is essential to understand if the planet can sustain life and ultimately if its human exploration is feasible. The major components of the radiation environment in the Mars orbit, are Galactic Cosmic Rays (GCRs) and Solar Energetic Particle (SEP) events. Since Mars has a negligible magnetic field and a much thinner atmosphere compared to the Earth’s, its surface is exposed to GCR and eventual SEP events, as well as to secondary particles produced in the atmosphere and in the shallow layers of the planet. The Curiosity rover that has been exploring the surface of Mars since August 2012, carries in its Mars Science Laboratory (MSL), the Radiation Assessment Detector (RAD) which measures high-energy radiation, such as protons, energetic ions of various elements, neutrons, and gamma rays. That includes not only direct radiation from space, but also secondary radiation produced by the interaction of space radiation with the atmosphere and surface rocks and soil.
The detailed Martian Energetic Radiation Environment Model (dMEREM) is a GEometry ANd Tracking (GEANT4) based model developed for ESA which enables to predict the radiation environment expected at different locations on the Martian orbit, atmosphere and surface, as a function of epoch, latitude and longitude, taking into account the specific atmospheric and soil composition. dMEREM can be interfaced to different Primary Particle Models, such as the ISO-15390 and the Badhwar - O'Neill (BON) 2014 or 2020 Galactic Cosmic Ray Flux Models, or the National Aeronautics and Space Administration (NASA) Emission of Solar Protons (ESP) model for solar energetic proton fluences. dMEREM is interfaced with the European Mars Climate Database from where it retrieves information on the atmosphere composition and density at specific locations and solar longitudes and Gamma Ray Spectrometer data aboard Mars Odyssey, for the description of Mars soil composition, although soil compositions for specific locations, including those locally sampled by Martian rovers can also be defined by the user. dMEREM provides the kinetic energy and directional spectra of all particle types produced in the interactions of energetic particles with the Martian Atmosphere and Soil.
The dMEREM validation results using differential proton fluxes stopping in the RAD sensor head as measured by MSL/RAD in Gale crater from November 15, 2015 to January 15, 2016 and in the begin of September 2017 is presented. Although the RAD only measures a limited field-of-view in zenith angle of the Martian Particle Radiation Field, the good agreement between the RAD data and the dMEREM predictions for protons within the RAD field of-view, are used as the basis for the use of dMEREM in the assessment of the expected ionizing radiation field on the surface of Mars for particles coming from all directions, including albedo particles. This assessment is also used to make predictions of dosimetric quantities, such as Ambient Dose Equivalent and Effective Dose, relevant for Human Space Flight, for the considered data periods.
How to cite: Gonçalves, P., Arruda, L., and Pinto, M.: The Radiation Environment on the Surface of Mars: dMEREM predictions based on RAD data, Europlanet Science Congress 2021, online, 13–24 Sep 2021, EPSC2021-411, https://doi.org/10.5194/epsc2021-411, 2021.
Introduction
In January 2019, the Mars Science Laboratory (MSL) rover Curiosity started exploring the Glen Torridon (GT) region of Gale crater, which corresponds to the topographic trough between the Vera Rubin ridge and the Greenheugh pediment (Fig. 1). From orbit, this region stands out due to the relatively strong near-infrared signatures of clay minerals [1,2]. The in-situ data collected so far by Curiosity have allowed the MSL team to confirm and quantify the presence of these clay minerals [3], to characterize their organic content [4], and to document in detail their geochemical and sedimentological settings [5].
In particular, the bedrock chemistry measured by ChemCam shows elevated values of the Chemical Index of Alteration (CIA) throughout most of Glen Torridon [6,7], which indicates an open-system type of alteration [8]. In addition, the ChemCam observations suggest the presence of illite in the fine-grained rocks [9] and reveal a possible relationship between grain size and geochemical variations [10]. Finally, they show that the light-toned rocks located just below the unconformity at the base of the Greenheugh pediment (Fig. 1) are associated with “anomalous” bedrock compositions that may be related to a late-stage diagenetic event at Gale [7].
Here, we report the findings of the ChemCam instrument along a ~2-km eastward traverse within the upper member – named Glasgow – of the Glen Torridon region (Fig. 1). This traverse allowed Curiosity to investigate the lateral variability of this member, while also getting gradually closer to the transition into the overlying sulfate-bearing unit [11].
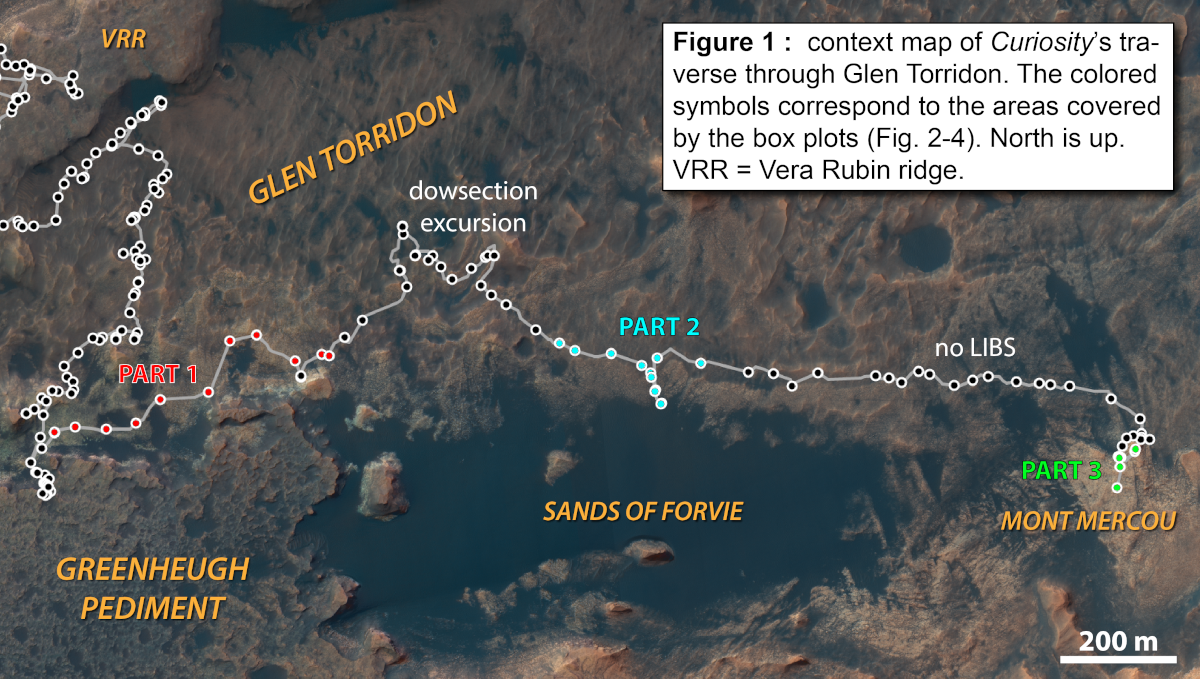
Dataset
ChemCam measures the chemical composition of targeted rocks and soils within a few meters of the rover using laser-induced breakdown spectroscopy (LIBS). Quantification of eight major rock-forming oxides is performed routinely [12]. Each ChemCam analysis consists of a raster of several points a few millimeters apart from each other, and each point itself consists of a series of laser shots (typically 30). For bedrock targets, this approach allows removal of unwanted contributions from Ca-sulfate veins or soil material by discarding the corresponding points [e.g., 8].
On sol 3007, ChemCam experienced a technical issue, which required halting the use of the laser during the time of the investigation, while imaging and passive spectroscopy activities continued. LIBS analyses on Mars targets resumed on sol 3107, in the Mont Mercou area (Fig. 1), ~600 m to the east and ~19 m higher in elevation. In addition, data acquired between sols 2816 and 2956 are not used here, since they correspond to a downsection excursion into the underlying Knockfarril Hill member [13].
Results
Variations in MgO, K2O and FeOT abundances along the rover path within the Glasgow member are shown in Figures 2, 3 and 4 (respectively). The bedrock composition is overall homogeneous, although small variations are observed for some oxides. In particular, the mean MgO abundance was well below 5 wt% in the western part of the traverse, but reached nearly 6 wt% after the downsection excursion (Fig. 2). This increase in MgO is accompanied by slightly lower Al2O3 abundances (not shown here).
In contrast, the K2O content does not show a clear change after the excursion (Fig. 3); however, it decreases slightly during the exploration of an area with rougher terrain (previously mapped as “fIU rubbly” [14]), between sols 2973 and 3000.
Regarding FeOT, large variations have been observed at small scale (i.e., within a given LIBS raster) in a group of targets characterized by the presence of dark nodules, likely of diagenetic origin [15,16]. These nodules have high FeOT (up to ~50 wt%), whereas the points in between the nodules show low FeOT (down to ~12.5 wt%). However, at the scale of the whole Glasgow member, the mean FeOT content is quite stable, with only a subtle increase in the eastern part of the traverse (Fig. 4).
As mentioned above, the most recent data (last bin in Fig. 2-4) were acquired after a gap of ~600 m laterally and ~19 m vertically. Despite this gap, the bedrock compositions appear remarkably similar to those measured earlier in the Glasgow member, especially after the downsection excursion. This suggests that no major change of environment occurred during the time when LIBS was unavailable.
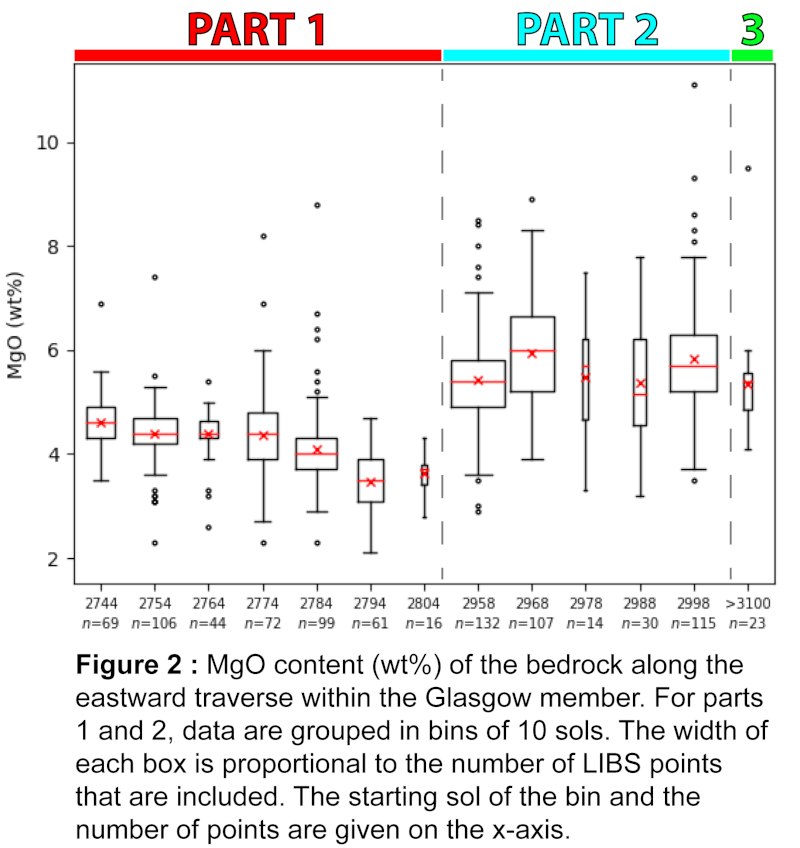
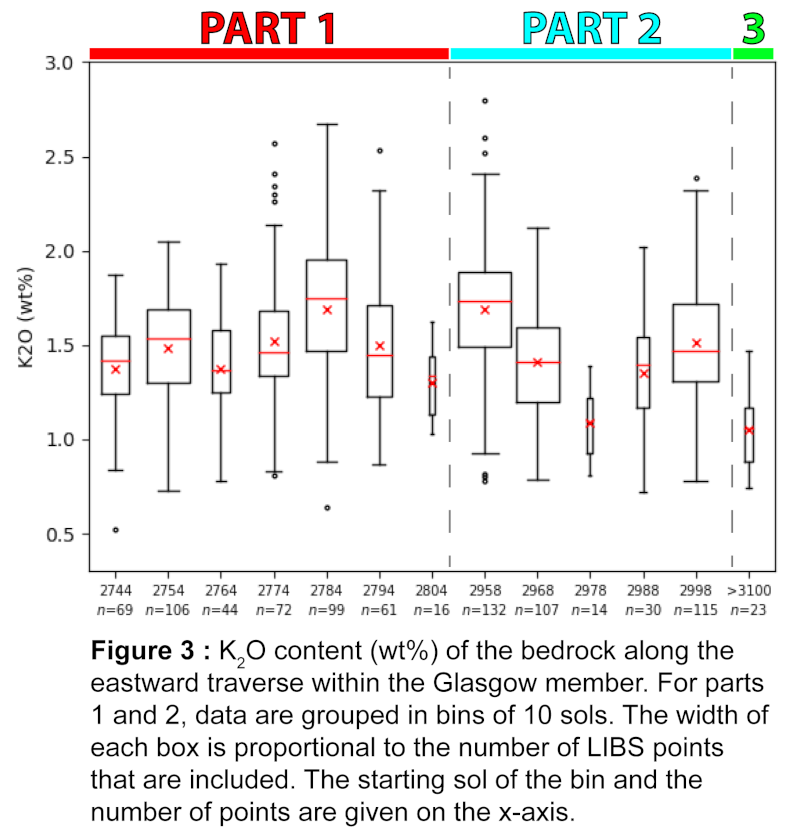
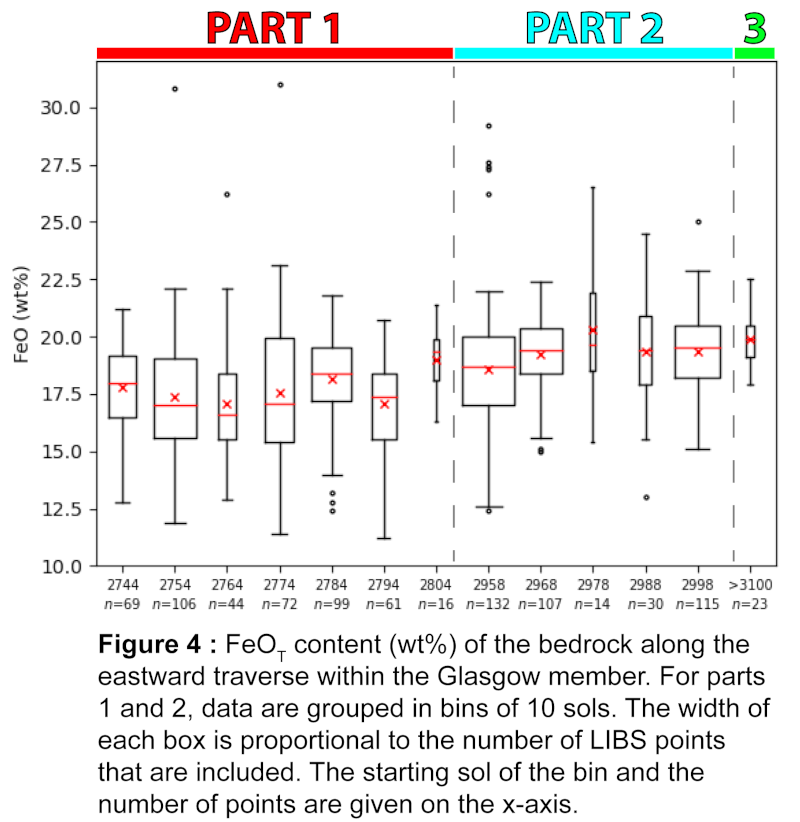
Discussion and conclusion
Curiosity’s eastward traverse within the Glasgow member is a rare opportunity to investigate the lateral variability of Gale sedimentary strata at the kilometer scale. The compositions appear overall homogeneous, but some variations are observed. As previously seen in Glen Torridon [6,7,10], Mg and K are the two most varying elements; however, their variations are not always well correlated, as illustrated by the trends observed after the downsection excursion (Fig. 2-3). In addition, while FeOT displays significant variations within some LIBS rasters due to the presence of dark nodules in the bedrock, it is stable at the scale of the whole Glasgow member, which suggests that diagenetic remobilization of iron occurred at small scale only.
Finally, the latest data acquired in the Mont Mercou area show that the bedrock compositions are still remarkably similar to those measured ~2 km to the west, when Curiosity first encountered the Glasgow member. As the rover continues to progress uphill, ChemCam will continue surveying the bedrock in search of the first chemical indications of the clay-to-sulfate transition.
References: [1] Milliken et al. (2010) GRL, 37. [2] Fraeman et al. (2016) JGR-Planets, 121. [3] Thorpe et al. (2021) LPSC, abstract #1519. [4] Millan et al. (2021) LPSC, abstract #2039. [5] Fedo et al. (2020) LPSC, abstract #2345. [6] Dehouck et al. (2020) LPSC, abstract #2770. [7] Dehouck et al. (2020) AGU Fall Meeting, abstract #P070-06. [8] Mangold et al. (2019) Icarus, 321. [9] Cousin et al. (2021) LPSC, abstract #2127. [10] Caravaca et al. (2021) LPSC, abstract #1455. [11] Rapin et al. (2021) Geology, 49. [12] Clegg et al. (2017) Spectrochim. Acta B, 129. [13] Dehouck et al. (2021) LPSC, abstract #1858. [14] Hughes et al. (2021) LPSC, abstract #1586. [15] David et al. (2021) LPSC, abstract #1433. [16] Gasda et al. (2021) LPSC, abstract #1271.
How to cite: Dehouck, E., Cousin, A., Mangold, N., Frydenvang, J., Gasnault, O., Rammelkamp, K., Rapin, W., Forni, O., Gasda, P. J., David, G., Caravaca, G., Lasue, J., Meslin, P.-Y., Bedford, C. C., Lanza, N. L., Fox, V. K., Bennett, K. A., Bryk, A. B., Maurice, S., and Wiens, R. C.: Bedrock geochemistry measured by ChemCam along a 2-km eastward traverse in the Glen Torridon region, Gale crater, Mars, Europlanet Science Congress 2021, online, 13–24 Sep 2021, EPSC2021-595, https://doi.org/10.5194/epsc2021-595, 2021.
Context:
On February 18th 2021, the NASA Perseverance rover landed at Jezero crater, Mars, a 50 km Noachian-aged open-basin lake system located on the western side of the Isidis impact structure. The bottom of the crater indicates the presence of a fluvial delta with associated inlet and outlet valleys and infrared observations from orbit have detected the presence of carbonate, mafic and hydrated minerals [1] Since its arrival at the Octavia E. Butler landing site, the rover explored about 100 meters around it initial landing position and analyzed the local bedrocks surrounding it.
Located on the top of the mast of the Perseverance rover is SuperCam, a multipurpose remote sensing instrument able to acquire high resolution color images, infrared, laser-induced breakdown spectroscopy (LIBS) and Raman spectra, and including also a microphone [2, 3]. The LIBS technique is similar to the one used by ChemCam onboard the Curiosity rover, which has been exploring Gale crater since 2012: a powerful laser pulsed at 1064 nm ablates targets at a distance, inducing a plasma spark, the light of which is analyzed by spectroscopy to determine its elemental composition (e.g. [4]). During such an analysis, spectra obtained from the first several laser shots at each location are contaminated by dust deposited on the surface of the rock targets and these spectra are usually removed from further analysis [5]. These spectra present a very homogeneous composition that is different from those of the underlying targets, and are interpreted to represent the analysis of eolian dust deposited over time on the surface of Mars [6].
In this study, we compare the spectral results obtained with the SuperCam first shots on the targets analyzed at the Octavia E. Butler landing site with the average first shot spectra obtained by ChemCam on the rock targets at Gale Crater to confirm whether the signal corresponds to a global microns-thick eolian dust cover of Mars.
Method:
We have used all the LIBS first shot spectra acquired since the landing of Perseverance. This corresponds to ~106 different spectra processed by denoising, background removal, wavelength calibration, and correction for instrument response. The average spectrum obtained from these data can then be appropriately compared with the average first shot spectrum obtained by ChemCam at Gale crater, which was built over 1500 sols (~ 8500 spectra). There is a 2 orders of magnitude difference between the number of first shots acquired by SuperCam and ChemCam at this time, so we can expect the SuperCam results to be less representative than the ChemCam ones.
Results:
The comparison of the LIBS spectra (Figure 1.) indicate strong similarities in major element compositions The only disparity comes from apparent elevated Mg and Ca lines in the SuperCam signal, which are possibly due to a local contribution. The minor elements, such as H, Li, Mn, Cr, also present peaks with intensities similar to the ones detected on the ChemCam spectrum, indicating a similar level of hydration and minor elements contents of the dust fraction at Jezero and at Gale. While the rocks analyzed by SuperCam at Jezero crater appear visually to be less covered by dust than the ones seen at Gale crater, our analysis indicates that the rocks studied at Jezero remain covered by a thin layer of homogeneous material similar in composition to the eolian deposited dust. This result is consistent with a global mixing of the eolian dust cover on Mars at the micron scale, or possibly a single origin for the eolian dust on Mars as described in previous studies (e.g. [7, 8]).
Conclusion:
The average of the first LIBS shot spectra acquired by SuperCam at Jezero crater compare very well with the average spectrum of ChemCam’s first shots at Gale crater. The intensity of the emission lines in the two spectra are very similar indicating the probable global mixing of the dust deposited all over the surface of Mars.
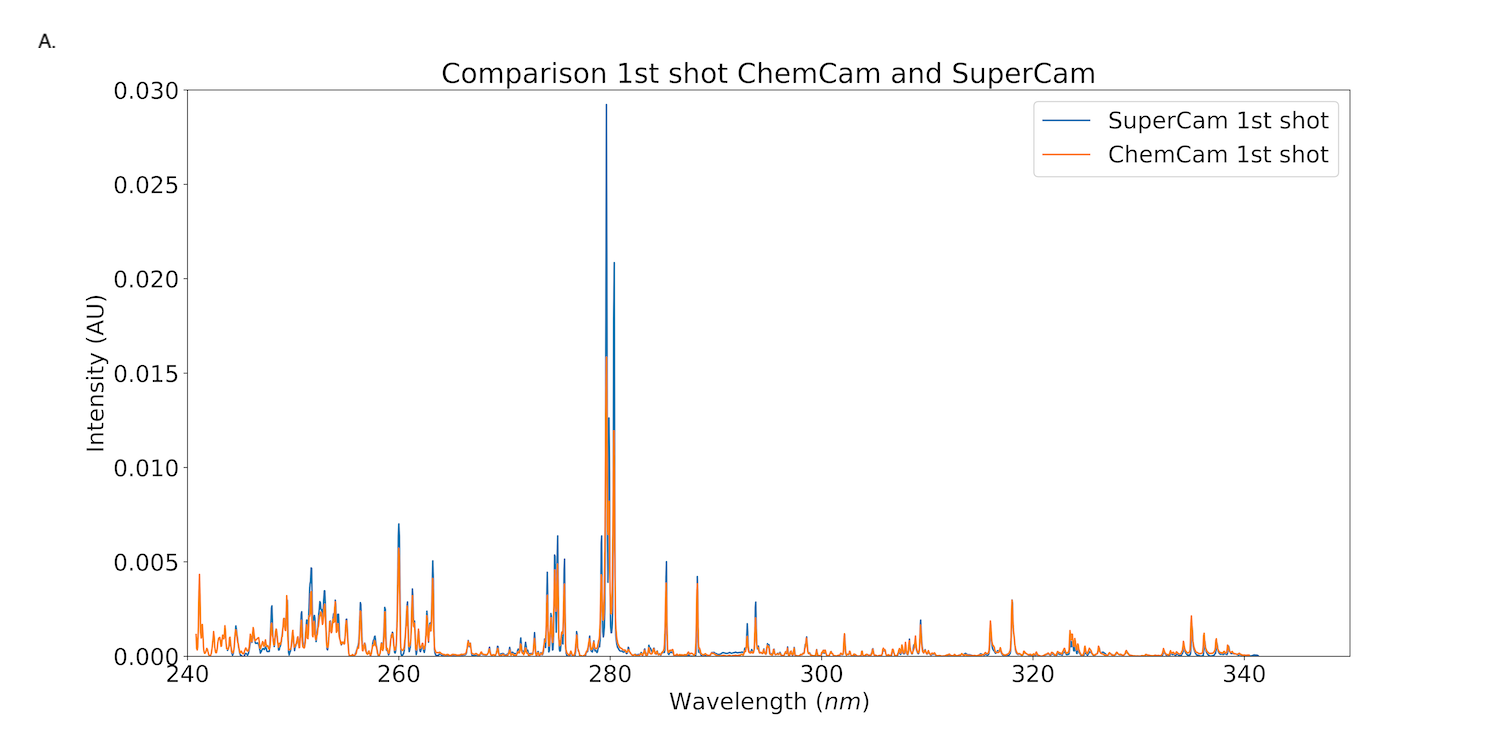
Figure 1: Comparison of average first shots LIBS spectra of ChemCam at Gale Crater ([6] in red) and average first shots LIBS spectra of SuperCam at Jezero Crater (in blue). A) UV range, B) blue-violet range, C) green range D) orange range E) red range.
Acknowledgements:
The Perseverance rover and the SuperCam instrument were funded by NASA, CNES and LANL.
References:
[1] Stack, K. M., et al. (2020) Space Science Reviews, 216(8), 1-47. [2] Maurice, S., et al. (2021) Space Science Reviews, 217(3), 1-108. [3] Wiens, R. C., et al. (2021) Space Science Reviews, 217(1), 1-87. [4] Maurice, S., et al. (2016) Journal of Analytical Atomic Spectrometry, 31(4), 863-889. [5] Clegg, S. M., et al. (2017) Spectrochimica Acta Part B: Atomic Spectroscopy, 129, 64-85. [6] Lasue, J., et al. (2018) Geophysical Research Letters, 45(20), 10-968. [7] Berger, J. A., et al. (2016). Geophysical Research Letters, 43(1), 67-75. [8] Ojha, L., et al. (2018) Nature communications, 9(1), 1-7.
How to cite: Lasue, J., Meslin, P.-Y., Cousin, A., Forni, O., Anderson, R., Dehouck, E., Frydenvang, J., Gasnault, O., Rapin, W., Pilleri, P., Clegg, S., and Wiens, R.: Comparing SuperCam first shots at Jezero with ChemCam eolian dust analysis at Gale, Europlanet Science Congress 2021, online, 13–24 Sep 2021, EPSC2021-254, https://doi.org/10.5194/epsc2021-254, 2021.
The Perseverance rover (Mars 2020 mission, NASA) landed in the ancient lakebed of Jezero crater, Mars on February 18th, 2021. The main science objectives of the mission are the characterization of past habitable environments, the search for preserved biosignatures and the collection of samples to be returned to Earth by the next MSR (Mars Sample Return, NASA/ESA) mission [1]. The payload includes the SuperCam instrument (under the leadership of LANL, USA and IRAP, France), which plays a critical role in the exploration strategy, as it combines various remote-sensing techniques to investigate the elemental and mineralogical composition of rocks and soils: high-resolution color imaging, laser-induced breakdown spectroscopy, Raman spectroscopy, visible and near-infrared (VISIR) reflectance spectroscopy, and acoustic sensing [2, 3, 4, 5]. In particular, the near-infrared spectrometer is a novel instrument on the Martian surface. The spectra, together with data from two additional visible spectrometers, cover 0.39–0.85 µm (VIS) and 1.3–2.6 µm (IR), which allows the identification of a wide variety of minerals.
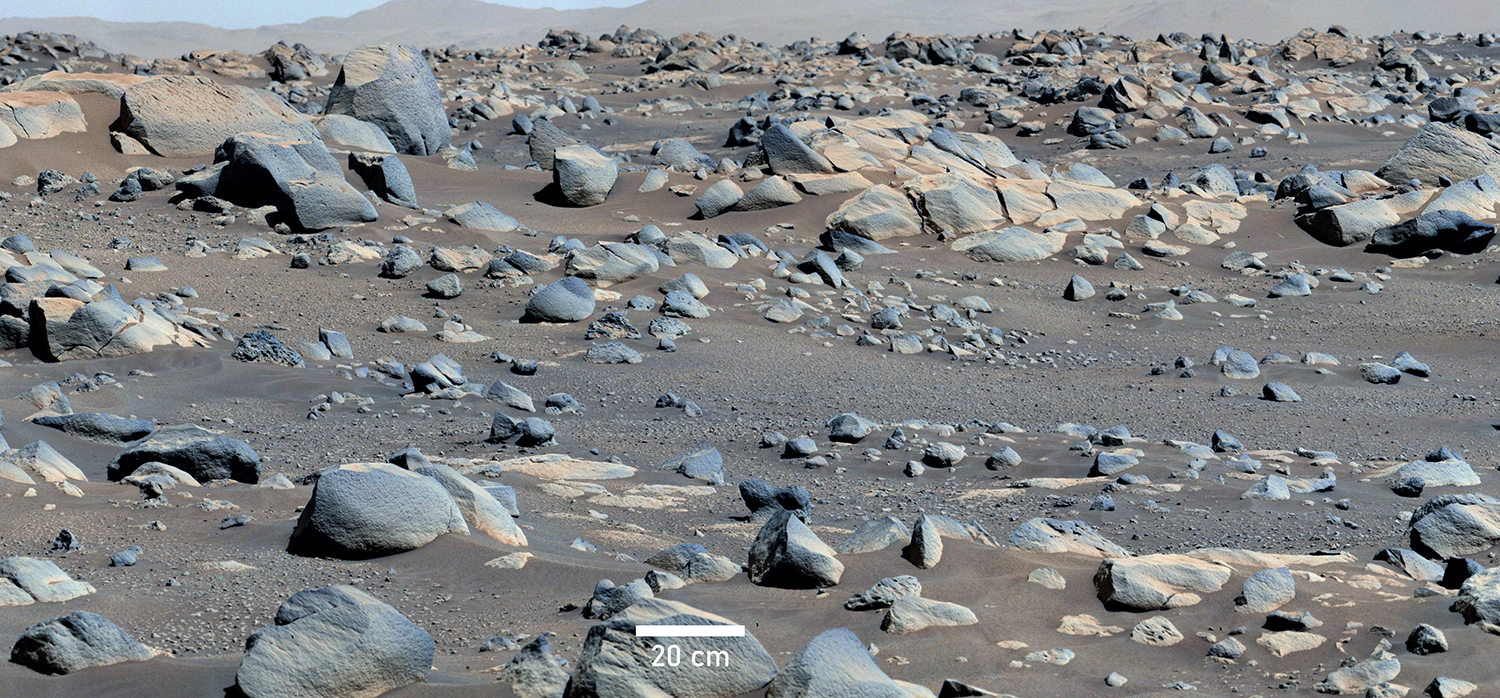
Figure 1. Enhanced-color mosaic of images taken by the Mastcam-Z Left camera of the rover workspace on sol 78 [6]. NASA/Caltech-JPL/MSSS/ASU.
Orbital data show that the landing site exhibits diverse mineralogical assemblages in various geological contexts, attesting in particular of an ancient aqueous activity during the Noachian and Hesperian eras (> 3 Ga), and including mafic minerals, carbonates, phyllosilicates and opaline silica [7, 8, 9].
We present the initial results of the SuperCam VISIR spectrometers, with calibrated [10] spectral data collected in the first months of operation of the instrument, with a focus on the rocks and soils present in the rover workspace and explored so far. Spectra have been obtained on nearby rocks so far within 50 m of the Octavia E. Butler landing site, at the boundaries of the Crater Floor Fractured Rough (CF-Fr) and Crater Floor Fractured (CF-F) units, which from orbit exhibit the spectral signatures of pyroxene and olivine, respectively [7]. A comparison with orbital data is presented in [11].
Most of the rocks analyzed in the close vicinity of the rover so far consists of light-toned ‘pavers’ and upstanding dark-toned rocks (Fig. 1). Some variability in reflectance levels and absorption bands is observed within and between the rocks (Fig. 2), but overall they share similar spectral characteristics in the VISIR. In particular, they all exhibit an absorption band near 1.9 µm (a spectral signature indicating the presence of the water molecule), a band that is usually not observed in the soils – at least not with the same depth. This absorption near 1.9 µm is also present in spectral observations of outcrops a few kilometers away from the rover [11]. In addition to this absorption at ~1.9 µm, a blue slope in the 2.1-2.5 µm region and subtle absorption bands near 1.4 µm and 2.28 µm show up locally, which suggests the presence of hydrated mineral species, such as an iron-rich phyllosilicate (like nontronite or hisingerite), potentially mixed with an oxy-hydroxide such as ferrihydrite (Fig. 2). The intensity of these absorption bands is consistent with at least a few weight percent of these hydrated species in the observed target, either in the bulk of the rock or in a varnish/coating. Finally, fewer spectra exhibit a weak absorption at 2.2 µm, suggesting the additional presence of an Al-OH or Si-OH-bearing phase.
Overall, the detection of these widespread hydration features supports some pervasive water-rock interactions during the past, in the landing site of Perseverance. CRISM data suggest that we have landed in a relatively low hydration region, and that the rover will be driving through progressively increasing hydration throughout the mission, as it moves onto the delta, the olivine-carbonate and the region outside of Jezero crater. Future in situ measurements on these potentially more hydrated and diverse rocks are expected to bring new insights into the past aqueous environment at Jezero crater.
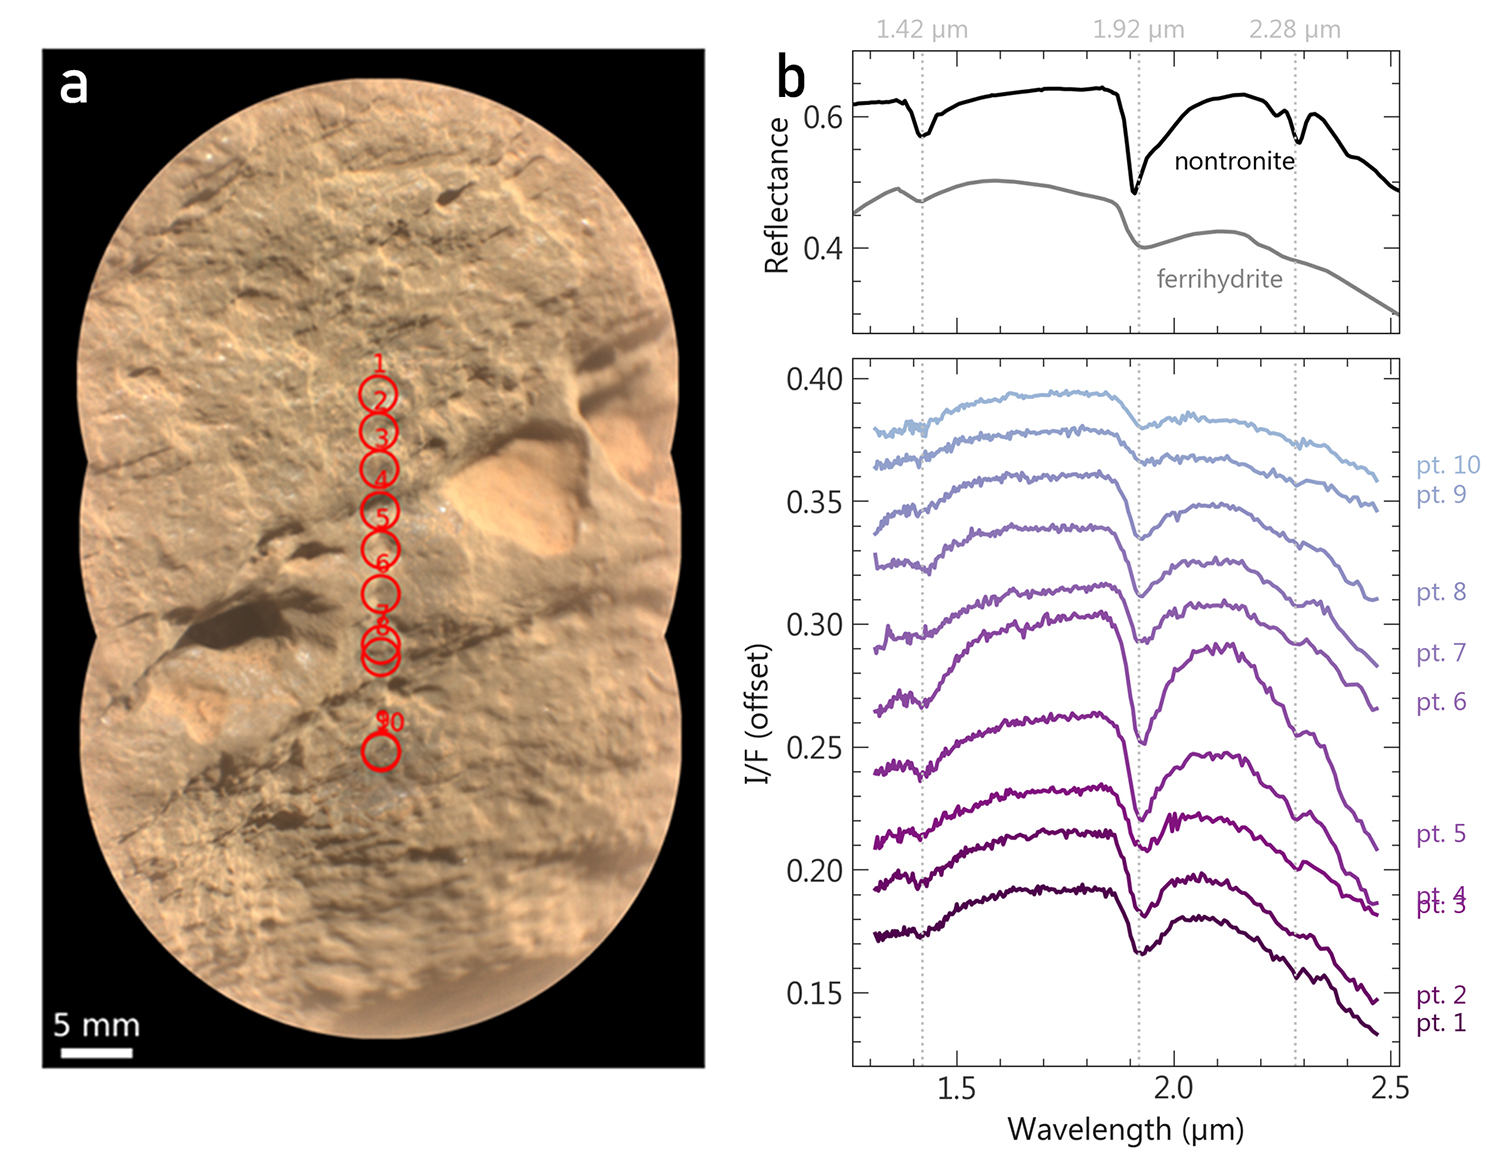
Figure 2. Example of a SuperCam observation on a rock present in the workspace of the rover: 10x1 raster on target Bidziil. (a) RMI mosaic taken at 2.3 m from the rover mast on sol 56 with the IRS 68% field of view annotated in red. (b) Corresponding IRS spectra in color, compared to laboratory spectra of known minerals in black and grey.
References
[1] Farley, K. A. et al., 2020. Space Sci. Rev.; [2] Wiens, R.C. et al., 2017. Spectroscopy; [3] Maurice, S. et al., 2021 Space Sci. Rev.; [4] Cousin, A. et al., this conference; [5] Chide, B. et al., this conference; [6] Bell, J. F. et al., 2021. Space Sci. Rev. [7] Goudge, T. A. et al., 2015. J. Geophys. Res. Planets; [8] Ehlmann, B. L. et al., 2008. Science; [9] Tarnas, J. D. et al., 2019. Geophys. Res. Lett.; [10] Royer, C. et al., this conference; [11] Quantin-Nataf et al., this conference.
How to cite: Mandon, L., Quantin-Nataf, C., Beck, P., Fouchet, T., Royer, C., Montmessin, F., Forni, O., Johnson, J. R., Gasnault, O., Dehouck, E., Poulet, F., Brown, A., Tarnas, J. D., Le Mouélic, S., Bernardi, P., Reess, J.-M., Newell, R. T., Maurice, S., and Wiens, R. C.: Observing rocks in Jezero crater, Mars: results of the first months of operation of the SuperCam VISIR spectrometer, Europlanet Science Congress 2021, online, 13–24 Sep 2021, EPSC2021-534, https://doi.org/10.5194/epsc2021-534, 2021.
Introduction: On February 18, 2021, NASA’s Mars 2020 Perseverance rover landed successfully in Jezero crater, a 50 km crater located on the margin of the Isidis basin on Mars. The Mars 2020 mission is the first step of a Mars sample return campaign, as Perseverance has the capability of collecting and caching samples.
The detailed mineralogy of the landing site has been extensively studied using the OMEGA and CRISM Visible and Near infrared spectroscopic-imagers [1, 2]. Jezero crater displays a variety of spectral signatures that revealed a large variety of minerals. Several compositional units have been identified within Jezero crater [3,4]: a pyroxene-bearing cratered dark floor unit, an olivine-bearing unit exposed in erosional windows below the dark floor unit that is variably altered, including phyllosilicates and carbonates [5], and a deltaic complex and marginal carbonate-bearing unit [3]. Orbital observation of the distinctive compositional units are one of the assets of Jezero landing site probably related to the low dust coverage of the site (e.g. 4).
Perseverance landed in Octavia E. Butler Site, located within the dark crater floor unit and has started to investigate the rocks (float rocks as well as possible bedrock exposures) along its traverse.
The SuperCam instrument onboard Mars2020 contains a suite of techniques including passive spectroscopy in the 0.40-0.85 (VIS) and 1.3 to 2.6 microns (IR) wavelength ranges [6], therefore covering a similar range of wavelengths as the OMEGA and CRISM spectrometers that were used for the mineralogical assessment of Jezero before landing. During the first two months at the surface of Mars, >100 VISIR spectra were acquired both on the rocks around the rover [7] and at long distance (several kilometers) on targets of interest: the front of the Delta, Santa Cruz butte, and possible delta remnants like Kodiak mesa and Seitah deposits. A direct comparison between the orbital spectral signatures of the landing site and long distance targets is the purpose of this contribution.
Methods: We processed the CRISM data cube HRL000040FF covering both the landing site and the long distance observations performed by Perseverance. The processing included: calibration, correction from the atmospheric contribution and ratioing methods [8]. We processed SuperCam IR data by ratioing to the white calibration target first acquired on sol 20 . See also [9] for additional details of SuperCam’s IR processing. The preliminary residual atmospheric contribution for long distances is removed using a distance dependent model of atmospheric contribution scaled on the CO2 2 µm absorption band.
Results : From orbit, this dark crater floor unit Perseverance landed on is overall pyroxene-bearing, potentially calcium-rich [3, 4]. The delta front exhibits a spectral mixture of olivine, low calcium pyroxene (LCP) and phyllosilicates [3]. Santa Cruz also displays spectra with possible low calcium pyroxene spectral signatures mixed with hydrated mineral signatures, possibly phyllosilicates. The Seitah deposits are olivine-bearing deposits mixed with hydrated minerals [5].
SuperCam IR spectra of the rocks within the workspace show spectral signatures mainly dominated by a 1.9 µm absorption feature indicative of the presence of one or several hydration phases. Occasionally, this 1.9 µm feature appears correlated to the 1.4 and 2.28-2.3 µm bands, suggesting the presence of phyllosilicates. The rocks show some spectral diversity possibly indicative of iron-rich phyllosilicates and/or (oxy-)hydroxydes. The soils in the workspace are less hydrated than the rocks. . See also [10] for initial elemental composition results in the workspace. For the long distance observations, the front of the delta shows spectral signatures indicative of Fe-Mg phyllosilicates possibly mixed with low calcium pyroxene. The observation of Santa Cruz also reveals Fe-Mg phyllosilicates, potentially with a stronger spectral signature of low calcium pyroxeneCP. The delta remnant Kodiak also shows phyllosilicates likely Fe-Mg. Finally, Seitah deposits observed at long distance display spectra in agreement with olivine and Fe-Mg phyllosilicates.
Discussion/Conclusion: Most of the IRS spectra confirm what has been observed from orbit but there are also differences. The 1.9 µm band linked to hydration is deeper in all ground based observations. It seems that the hydrated phases are the most dominant spectral signal on the ground for the areas sampled so far.
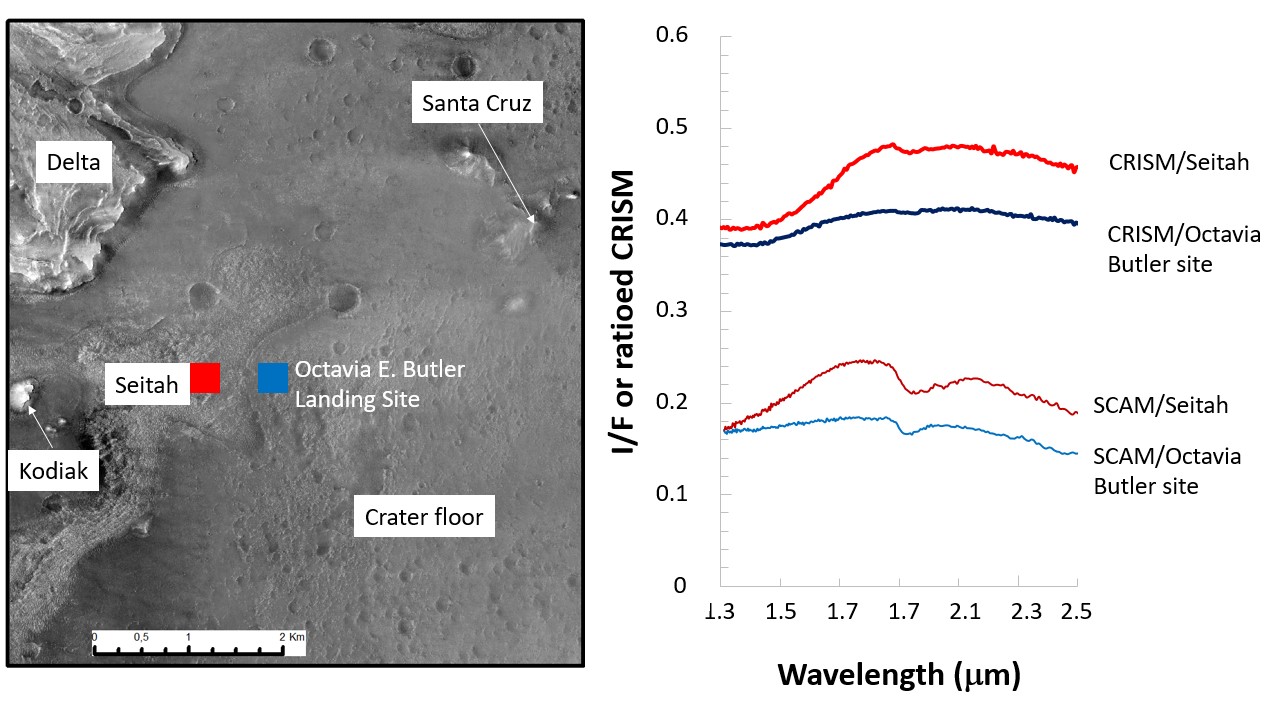
Figure 1 : Left : CTX image mosaic showing the different compositional unit and the locations of the SuperCam spectral observations as well as CRISM observation (the red square corresponds to Seitah observation, the blue square corresponds to Octavia E. Butler landing site). Right : IR spectra of CRISM data (3*3 averaged ratioed spectra);the spectra have been ratioed to the median of the column of the non-projected data cube HRL40FF [8]; offset of -0.6 has been applied for clarity; SuperCam results are an average of 20 spectra acquired on Seitah and average of >100 spectra acquired on the rocks of the rover workspace until Sol 70 .
References
[1] Mangold et al., JGR, 2007 [2] Murchie et al., JGR, 2009 [3] Horgan et al., Icarus, 2020 [4] Goudge et al., JGR, 2015 [5] Tarnas, et al., GRL, 2019. [6] Wiens, et al., Spectroscopy, 2017. [7] Mandon et al., this conference ; [8] Quantin-Nataf et al., PSS, 2018. [9] Royer et al., this conference ; [10] Cousin et al., this conference
How to cite: Quantin-Nataf, C., Mandon, L., Royer, C., Tarnas, J., Beck, P., Montmessin, F., Forni, O., Le Mouelic, S., Fouchet, T., Gasnault, O., Dehouck, E., Poulet, F., Johnson, J., Brown, A., Pilleri, P., Horgan, B., Ehlmann, B., Mangold, N., Wiens, R., and Maurice, S.: Comparison of Orbital and in situ NIR-spectra in Jezreo Crater: insight from the first Supercam Infrared Spectrometer data, Europlanet Science Congress 2021, online, 13–24 Sep 2021, EPSC2021-532, https://doi.org/10.5194/epsc2021-532, 2021.
The Perseverance rover (Mars 2020 mission, NASA) is exploring the mineral diversity within Jezero, the host crater of a paleolake, and is searching for potential biosignatures and past habitability evidence. Amongst its science payload, the SuperCam instrument (LANL/USA and a consortium of French laboratories) plays a central role in the Mars habitability investigation by providing rapid, synergistic, fine-scale mineralogy, chemistry, and color imaging [1]. In particular, it carries the first near-infrared spectrometer, IRS, to be operated on the Martian surface. IRS is a miniaturized point spectrometer (~1.15 mrad field of view) located in the SuperCam’s mast unit. Its spectral range (1.3 – 2.6 µm range) covers major silicate and hydrated mineral absorption features [2].
The instrument has been fully calibrated on ground before its launch [3] but flight measurements are necessary to check and refine its instrumental response after the cruise, entry, descent and landing. During the first 90 sols, observations of the SuperCam Calibration Targets (SCCT) were routinely performed in alternance with scientific targets.
An opportunistic observation of the Mastcam-Z calibration target has also been acquired. The IRS sensitivity, measured on the White SCCT, appears to be generally compliant with the ground measurements, except at short wavelengths (Fig. 1).
Flight calibrated measurements of the other SCCTs are compliant with their lab reference (Fig. 2) within 5 to 20 % for the Red and Cyan, but the evaluation of the absolute reflectance of the Black SCCT is far from expected, perhaps due to the ambient light misestimation. The calibration also consists in the removal of instrumental and environmental parasitic effects: CO 2 absorptions caused by the path of light through the Martian atmosphere are removed by dividing by a simulated spectrum of the gas; an EMI/EMC effect causing “glitches” in the AOTF’s RF power supply as well as in acquired data is mitigated by a specific detection algorithm; and readout spikes are eliminated by a statistical algorithm as well. Finally, datasets are cosmetically cleaned using higher level refinement algorithms (wavelets filtering and polynomial smoothing of the dark) to enhance band depth contrast without introducing significant biases. The remaining uncertainty on reflectance absolute level is mainly attributed to the error on the geometry of the illumination which requires a better modeling of local opography and the atmosphere diffusion. Some low frequency residuals are also miscalibrated by the current pipeline and still under investigation (e.g., RF power stability, thermal effects).
Notwithstanding these calibration uncertainties, the instrument signal to noise ratio (SNR) is high enough, and the relative (i.e., spectral channel to spectral channel) calibration is precise enough to be sensitive to faint spectral features (down to a few percent band depth) even if few parts of the spectral range show very faint but high frequency effects. Thus we will present the assessment of the radiometric in-flight performance of the instrument and the evaluation of the detection threshold for specific spectral signatures.
Figure 1: Radiometric instrument transfer function derived from ground calibration (blue) and flight measurements (orange), showing their divergence at short wavelength.
Figure 2: Color SCCTs measurement performed on Sol 77. The lighter lines correspond to the lab reference of these calibration targets.
References
[1] Wiens, R.C. et al., 2017. Spectroscopy; [2] Fouchet et al., 2015, 46 th LPSC; [3] Royer et al., 2020, RScI;
How to cite: Royer, C., Fouchet, T., Montmessin, F., Poulet, F., Forni, O., Johnson, J., Gasnault, O., Quantin-Nataf, C., Beck, P., Ollila, A., Mandon, L., Pilorget, C., Bernardi, P., Reess, J.-M., Newell, R., Maurice, S., and Wiens, R.: The flight radiometric calibration of IRS/SuperCam onboard Perseverance: campaign follow up and performance assessment, Europlanet Science Congress 2021, online, 13–24 Sep 2021, EPSC2021-735, https://doi.org/10.5194/epsc2021-735, 2021.
Abstract
On 19 February 2021 the SuperCam microphone onboard Perseverance recorded the first ever sounds on the surface of Mars. These recordings of the Martian dynamic pressure fluctuations actually contain a wealth of information about the Martian atmosphere.
Introduction
The Mars 2020 Perseverance rover [1] landed in Jezeero crater on 18 February 2021. The SuperCam Microphone is located at a height of 2.1 m above the ground on the front of the SuperCam instrument (Fig 1; [2,3]). Although the primary science objective of the SuperCam Microphone is to support the SuperCam Laser-Induced Breakdown Spectroscopy (LIBS) investigations by providing additional information about the physical properties of the LIBS targets [4,5], the microphone also has the capacity to provide data for new and important atmospheric investigations. With a bandwidth from 100 Hz to 10 kHz, the overarching atmospheric science goal of the microphone is to characterise the Martian atmospheric dynamics at high frequency, including the diurnal and seasonal evolution.
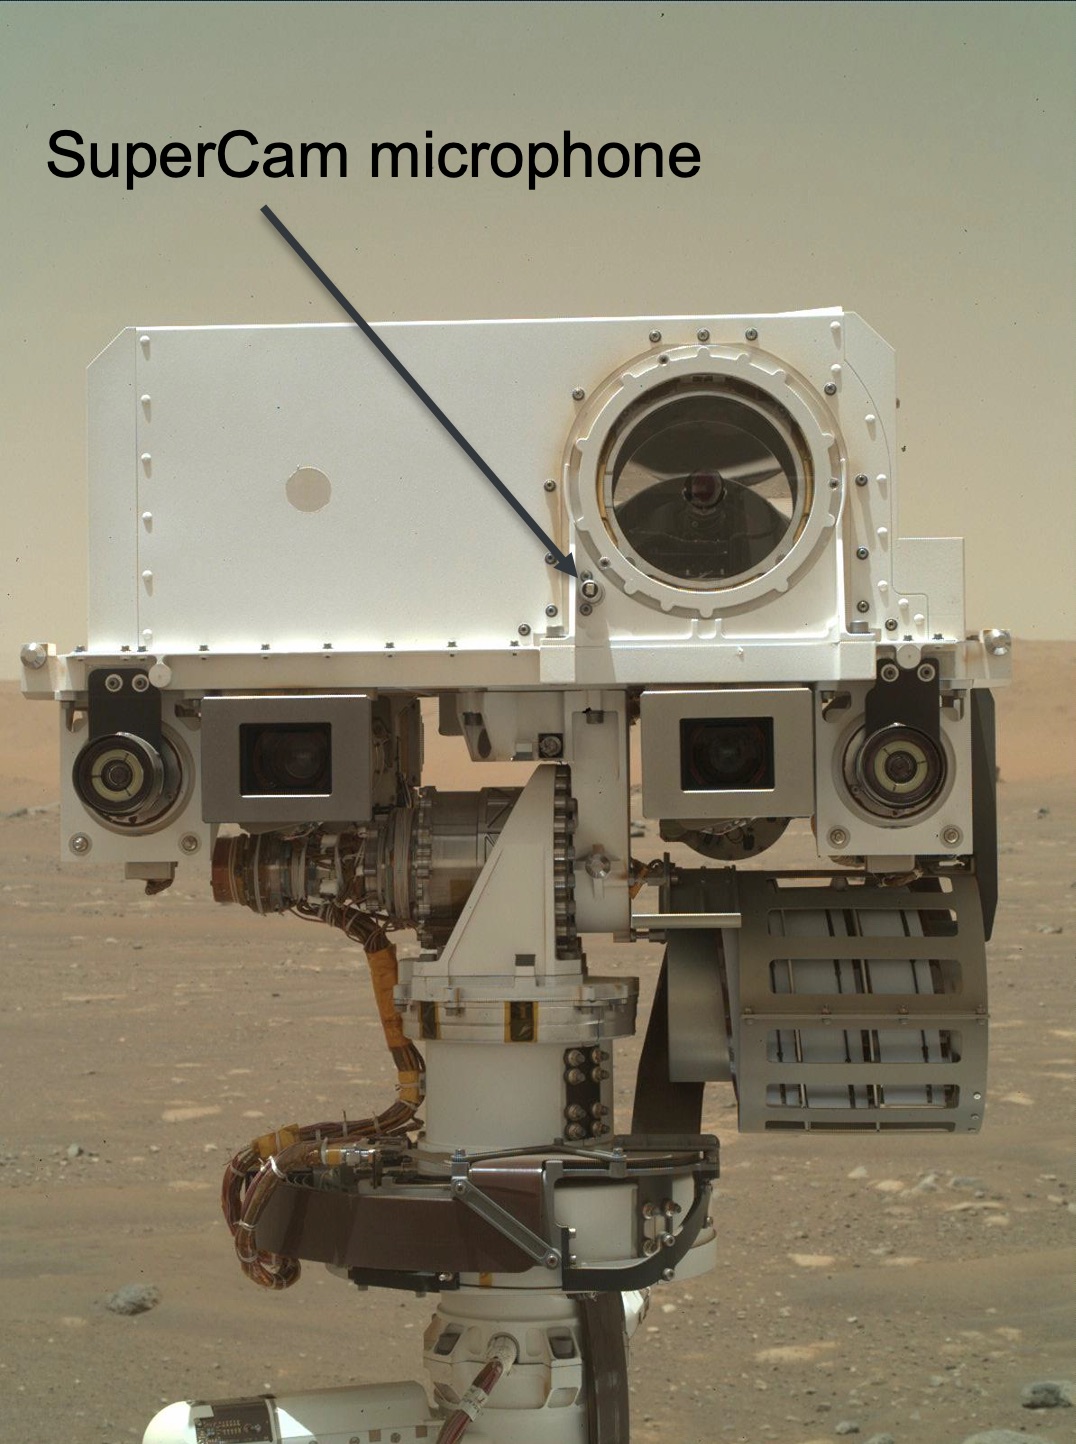
Figure 1: The SuperCam instrument, including the microphone, on the surface of Mars
Studying the turbulent Martian atmosphere with the SuperCam microphone
Pressure fluctuations in the atmosphere tell us about boundary layer convection, convective cells and vortices, and the inertial and dissipative regimes. Compared with Earth, Martian daytime turbulence is characterised by a stronger radiative control, a lack of latent heat forcing and a reduced inertial range [6].
Wind gustiness, convective vortex activity and the spectral slope of pressure, wind and temperature measurements can be used as indicators of turbulent motion in the atmosphere. These variables exhibit strong diurnal and seasonal variations (e.g., [7-10]). Recent analyses have also shown that wind gustiness on Mars is positively correlated to surface temperature rather than ambient wind speed and sensible heat flux [10].
Previous Martian space missions have provided valuable pressure, wind and temperature data allowing the Martian turbulence to be studied (e.g., [7,11]). The highest frequency atmospheric measurements that we currently have come from the pressure sensor on the InSight mission [12,13]. The InSight pressure measurements show unexpected behaviour. For example, they seem to contradict the theoretical predictions (Kolmogorov theory) for the cascade of the inertial range [14].
With its high sampling frequency, we can use the SuperCam microphone to study Martian turbulence on new, previously inaccessible, scales. From recordings at different local times and over different seasons, the SuperCam microphone can complement the lower frequency MEDA [15] wind speed measurements and provide a window into previously unexplored regimes of Martian atmospheric science.
The SuperCam microphone as a high frequency wind sensor
Pre-mission, in wind tunnel tests, it has been shown that the microphone can be used to estimate the wind speed – a quadratic relationship exists between wind speed and the microphone RMS signal [16]. However, the relationship between the microphone signal and wind speed may be more complex than this simple relationship, and other atmospheric effects (such as atmospheric stability) should also be included in the future.
The dynamic pressure signal measured by the microphone is a combination of the atmospheric dynamic pressure fluctuations and the aeroacoustic fluctuations due to vortex shedding (Fig. 2; [16,17]). Simultaneous MEDA and SuperCam measurements (over 360°) are necessary in order to perform a cross-calibration activity with MEDA in order to produce absolute wind speed estimates. The microphone can also be used with single (not directional) observations to provide relative wind speed estimates, and to study the gustiness in the Martian atmosphere [18].
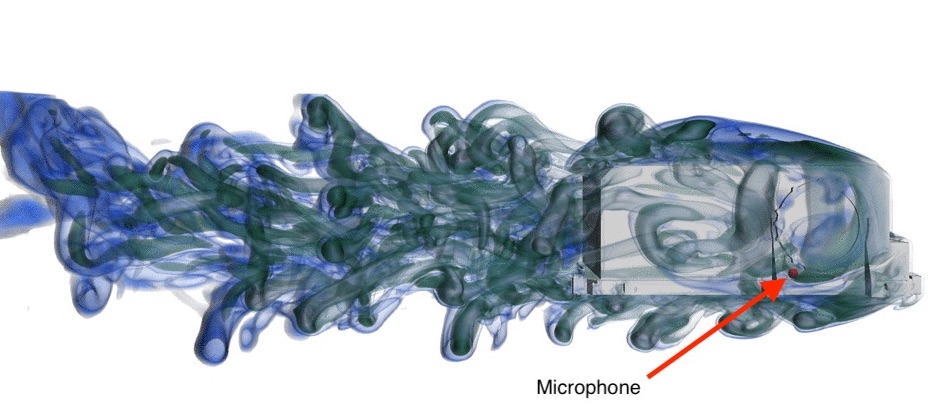
Figure 2: CFD simulations of vortex shedding around the SuperCam instrument under Martian atmospheric conditions with a wind speed of 5 m/s from the right of this image. The microphone is indicated by the small red sphere on the front of the instrument [16,17]. The blue and dark green areas correspond to the vortices generated around, and in the wake of, the SuperCam instrument
Air temperature measurements with the SuperCam microphone
Combined LIBS and SuperCam microphone operations [4, 19 - 20] can be used to probe the high frequency temperature fluctuations in the Martian atmosphere. Specifically, measuring the propagation time of the acoustic signal produced by the laser gives the sound speed from the ground to the microphone. The sound speed can then be used to derive the ‘acoustic temperature’ - the average of the air temperature over the 2 meters between the microphone and the laser target - for every laser shot (3 Hz). This is potentially important because large thermal gradients just above the Mars surface have been hinted at in previous data [21].
Conclusions
The SuperCam microphone observations allow us to quantify the dynamic pressure spectra, the wind gustiness and the air temperature at high frequency thus providing an opportunity to characterise the Martian atmospheric dynamics in previously unexplored regimes. The SuperCam microphone may also be used for more opportunistic science such as searching for the acoustic signals of convective vortices [22].
References
[1] Farley et al. SSR 2020. [2] Maurice et al. SSR 2021. [3] Wiens et al., SSR 2021. [4] Murdoch et al. PSS 2019. [5] Chide et al. SAB 2019. [6] Spiga et al., SSR 2019. [7] Davy et al., JGR, 2010. [8] Murdoch et al., SSR 2017. [9] Ullan et al. Icarus 2017. [10] Spiga et al. JGR-Planets 2020. [11] Larsen et al. BLM 2002. [12] Banfield et al. SSR 2019. [13] Banerdt et al. Nature Geoscience 2020. [14] Banfield, Spiga et al. Nature Geoscience 2020. [15] Rodriguez-Manfredi et al. SSR 2021. [16] Chide et al. Icarus 2021. [17] Bury et al. EPSC 2019. [18] Stott et al. EPSC 2021. [19] Chide et al. SAB 2020. [20] Chide et al. EPSC 2021. [21] Schofield et al. Science 1997. [22] Murdoch et al. LPSC 2021
How to cite: Murdoch, N., Mimoun, D., Stott, A. E., Chide, B., Lorenz, R., Maurice, S., de la Torre Juarez, M., Newman, C., Wolff, M., and Wiens, R. C. and the The Perseverance Acoustics and Atmospherics working groups: Atmospheric Science with the SuperCam Microphone on the Perseverance Rover, Europlanet Science Congress 2021, online, 13–24 Sep 2021, EPSC2021-516, https://doi.org/10.5194/epsc2021-516, 2021.
Abstract
The SuperCam instrument on the NASA Perseverance rover [1,2] is equipped with a microphone which, for the first time, has recorded sounds from Mars. These sounds include shockwaves from the laser-induce breakdown spectroscopy technique, the Ingenuity rotorcraft and the ambient Martian atmosphere [3,4]. Each of these offers a unique dataset to study Martian atmospheric dynamics at high frequencies. In this abstract we present preliminary results on studying the relationship between the wind and the sounds recorded from the microphone.
1. The SuperCam microphone
The microphone is a Knowles Electret condenser microphone model EK-23132 [1,2,5]. It can record at sampling rates of 25kHz or 100kHz for up to 167s. The nominal bandwidth is 100Hz-10kHz but lower frequencies can be retrieved. It is located on the SuperCam mast unit 2.1m above the ground and is aligned with the camera. This means that the microphone can be made to point in different azimuths and elevations.
2. Wind speed estimation from the microphone
The microphone records the atmospheric pressure at high frequencies. This dynamic pressure is linked to the winds on Mars [5,6]. In a pre-landing analogue study in a wind tunnel, Chide et al. 2021 [5] found that the root mean square (RMS) of the pressure signal is correlated to the wind speed. It was shown that the RMS value from the microphone in the bandwidth of 100-500Hz is proportional to the square of the wind speed. This frequency band was seen to not be extremely sensitive to the wind incidence azimuth but there is some uncertainty, especially for higher wind speeds.
We can calculate the RMS envelope over the recording. The square root of this envelope is then proportional to wind speed and can be used as a relative estimate. Figure 1 shows initial results from an afternoon recording on Sol 38 of the mission.
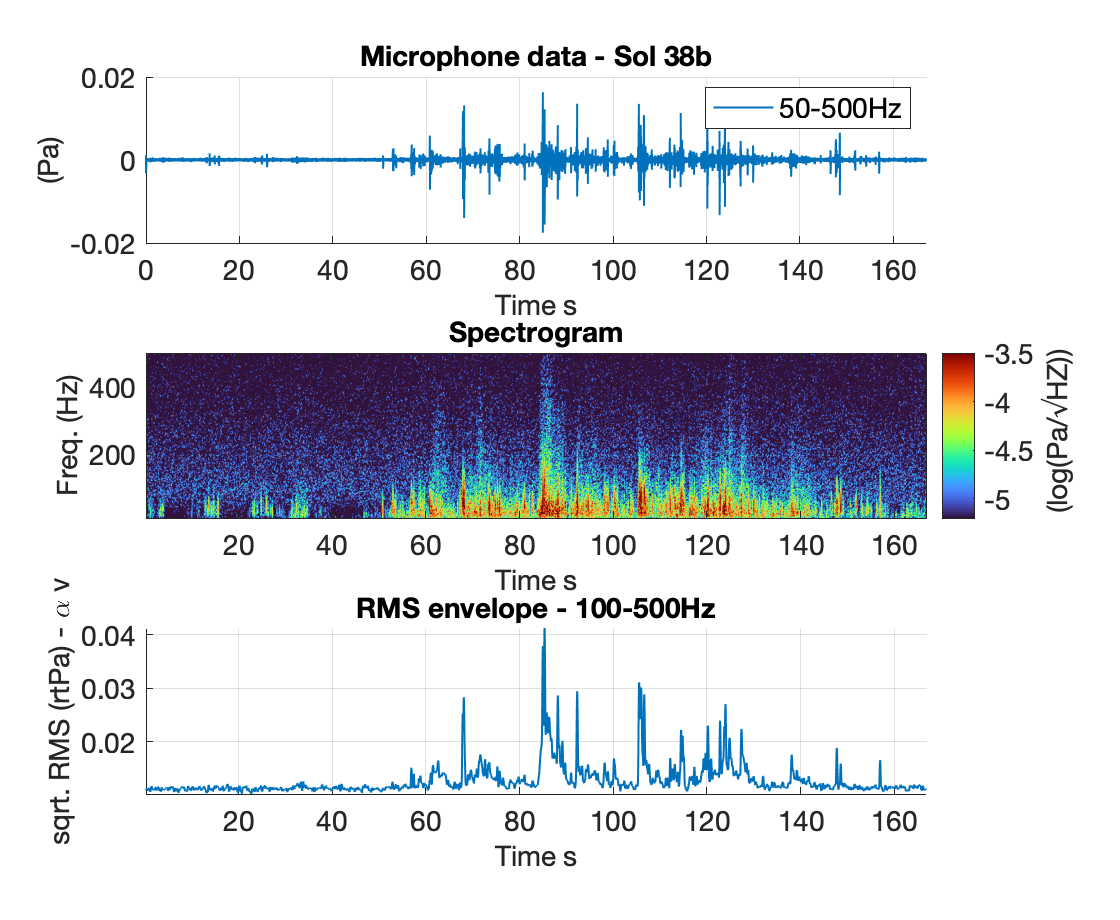
Figure 1: Microphone data from Sol 38. Top panel: microphone signal, Middle panel: spectrogram of microphone data, Bottom panel: square root of RMS envelope for 100-500Hz bandwidth.
A cross-calibration will be performed with the Mars environmental dynamic analyser (MEDA) wind sensor [7]. This will enable us to obtain an absolute wind speed determination with the microphone. The mast will also be rotated during the cross-calibration to help capture recordings for a variety of wind speed incidence azimuths and thus also determine the sensitivity to wind direction including the identification of vortex shedding [5]. Moreover, a variation of the mast elevation may lead to the determination of vertical wind speeds.
The relationship could also be sensitive to other effects, such as the atmospheric stability. To this end, we aim to track diurnal and seasonal variation, along with temperature and static pressure conditions.
3. Wind speed variation - gustiness
The microphone recordings yield an estimate of the Martian wind speed. The so far obtained relative wind speed estimates can be used for an analysis of the wind gustiness, that is, the wind speed variation with respect to its mean. This has been explored for Phoenix, Viking and InSight data [6,8] with a gustiness metric defined as the wind speed standard deviation, σw, over the mean wind speed, μw, as
normalised gustiness = σw/μw.
The gustiness metric was applied to several microphone recordings around Noon and 16:00 local true solar time (LTST). These results indicate that the later afternoons are more turbulent than midday, where some acquisitions contain very little wind. However, the noon recordings can contain infrequent very large gusts, including the largest so far observed by the microphone. This information was utilised early on in the mission to aid the understanding of potential flight conditions for the rotorcraft Ingenuity.
4. Conclusions
We have introduced how the microphone data are related to the Martian wind. It enables an estimation of the Martian wind speed and the ability to examine the high frequency content of wind gusts. This is important for the understanding of the dynamic pressure spectrum on Mars [3]. The microphone will record the high frequency portion of this dynamic pressure spectrum shedding light on the dissipative regime in Martian turbulence. The variability of the relationship to wind speed and the distribution of gustiness provides a study of high frequency Martian atmospheric dynamics, valuable for studying the Martian planetary boundary layer (PBL).
References
[1] Wiens et al., SSR, 2021;
[2] Maurice et al., SSR, 2021;
[3] Murdoch et al., EPSC, 2021
[4] Chide et al., EPSC, 2021;
[5] Chide et al., ICARUS, 2021;
[6] Murdoch et al., SSR, 2017;
[7] Rodriguez-Manfredi et al., SSR, 2021;
[8] Spiga et al., JGR, 2021;
How to cite: Stott, A., Murdoch, N., Mimoun, D., Chide, B., Lorenz, R., Maurice, S., De La Torre Juarez, M., Newman, C., Wolff, M., and Wiens, R. C. and the Mars 2020 Perseverance Acoustics and Atmospherics Working Groups: The Sound of the Wind on Mars: Preliminary Wind Speed Analysis with the SuperCam Microphone on Perseverance, Europlanet Science Congress 2021, online, 13–24 Sep 2021, EPSC2021-557, https://doi.org/10.5194/epsc2021-557, 2021.
Abstract:
The Mars 2020 Perseverance rover, which landed in February 2021, is carrying the SuperCam remote sensing suite [1,2]. It is a multifunctional spectroscopy instrument to analyze Martian rocks and soils with Laser-Induced Breakdown Spectroscopy (LIBS), time resolved Raman and luminescence, Visible and Infrared Reflectance Spectroscopy, and color context imaging. It also includes a microphone (see Fig. 1) that records acoustic pressure fluctuations in the 100 Hz to 10 kHz frequency bandwidth. In particular, it supports LIBS investigation by listening to laser-induced sparks caused by the supersonic expansion of the plasma plume [3, 4]. The microphone also contributes to atmospheric science by recording the ambient noise [wind, turbulence, 5, 6] and it already listened to unique sounds from the Ingenuity Mars Helicopter flights. This abstract focuses on the first analysis of the LIBS acoustic signal recorded on Martian targets near the Octavia E. Butler landing site of Perseverance.
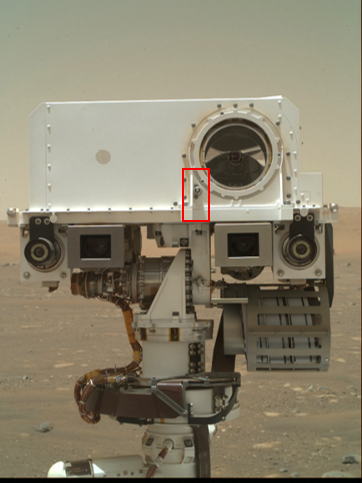
Figure 1 - WATSON image of the upper part of the Perseverance Remote Sensing Mast. The microphone is seen in the red rectangle. Credits: NASA/JPL-Caltech/MSSS/ASU
Listening to laser-induced sparks on Mars:
The LIBS experiment of Supercam uses a pulsed laser in the infrared (1064nm) to ablate rock or soil targets at the Mars surface at distance up to 7 meters. A standard LIBS burst consists of 30 laser shots repeated at the same location on a target. It creates an ablation pit up to hundreds of µm deep, depending on the target hardness (see LIBS pits in Fig. 2) [4, 7]. Longer bursts of 150 shots, called depth profiles, can also be performed to look for any chemical stratification with depth.
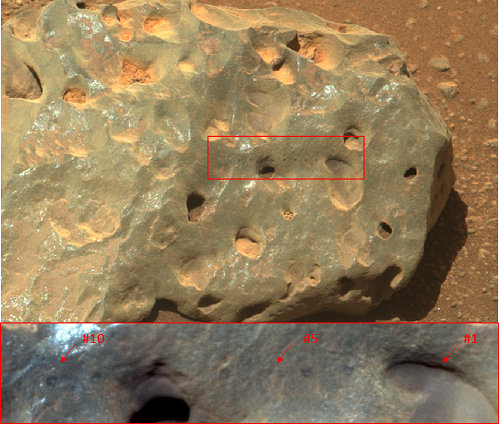
Figure 2 - Hedgehog target (sol 37) sampled by LIBS (10 points of 30 shots each). (a) Mastcam-Z documentation image. (b) RMI context mosaic highlighting the LIBS pits.Credits: NASA/JPL-Caltech/ASU/MSSS and NASA/JPL-Caltech/LANL/CNES/IRAP
It has been shown in lab studies [3, 4] that recording of the LIBS acoustic signal helps to determine the target physical properties (hardness) and also the laser pit volume by looking at the decrease of the signal amplitude with the number of laser shots performed at the same location. In addition, laser sparks may also be used to study rock coatings. In particular, it will help to determine the depth of the transition between a coating and its underlying host rock [8].
Moreover, as the start of the microphone recording is triggered on the laser pulse, the propagation time of the sound wave from the ground up to the microphone height is precisely measured. Therefore, it gives the sound speed along the sound propagation path. This parameter is used to estimate the ‘acoustic temperature’, an average of the air temperature over the two first meters from the ground [9].
First results on Martian targets:
Up to sol 78 of the mission, the Supercam microphone has recorded the LIBS acoustic signal from 12 targets, including 3 soil targets and 2 depth profiles.
The LIBS acoustic signal recorded on the float rock Hedgehog (sol 37) is represented in Fig. 3. The time series (Fig. 3a) shows a shot-to-shot decrease of the acoustic amplitude over the 30 shots fired in this target. The comparison with the hardness calibration curve presented in [4] suggests a soft target with a Vickers hardness lower than 10 and an ablated volume of about 200 µm. The frequency spectrum (Fig. 3b) is showing an acoustic bandwidth between 2 kHz and 10 kHz (see Fig. 3a), consistent with pre-flight calibrations [10]. Some gaps in the spectrum (5700 Hz, 10900 Hz, 14800 Hz) are indicative of destructive interferences induced by the reflection of the sound wave over the structure of the mast. Some wind-induced signal are also noticed in the time series (see red circles in Fig. 3a). They can be easily filtered, as their frequency content is lower than 500 Hz [6]. However, the influence of the turbulent atmosphere on the LIBS acoustic signal, needs to be assessed, as it was not tested in the laboratory.
Figure 3 - Time series (a) and power spectral density (b) of the LIBS acoustic signal recorded on point #5 of the Hedgehog target (sol 37)
As for the soil targets, the LIBS acoustic data show a clear decrease with increasing shot number due to shielding within the self-induced hole and also helps to determine whether the laser hit a coarse grain (louder sound) or fine-grained soil.
Perspectives:
The Supercam microphone has the unique capability to record the acoustic signal induced by the laser-induced plasma. The microphone will help to document the target hardness along the rover traverse and complement the chemical information provided by LIBS by adding an estimation of the ablated depth. This presentation will review results from all the microphone targets observed at the time of the conference.
References
[1] Wiens R. C et al., SSR 2021 https://doi.org/10.1007/s11214-020-00777-5 [2] Maurice S. et al., SSR 2021, https://doi.org/10.1007/s11214-021-00807-w [3] Chide B. et al, SAB 2019, https://doi.org/10.1016/j.sab.2019.01.008, [4] Chide B et al., SAB 2020 https://doi.org/10.1016/j.sab.2020.106000, 20, [5] Murdoch N. et al, this issue, [6] Stott et al., this issue, [7] Maurice S et al., JAAS 2016, doi:10.1039/c5ja00417a [8] Lanza N.L., LPSC 2020, 2807 [9] Chide B. et al., LPSC 2020 1366, [10] Murdoch N. 2019 PSS doi:10.1016/j.pss.2018.09.009.
How to cite: Chide, B., Lanza, N., Alvarez, C., Angel, S., Bernardi, P., Beyssac, O., Bousquet, B., Cadu, A., Clavé, E., Dehouck, E., Fouchet, T., Gasnault, O., Jacob, X., Laserna, J., Lorenz, R., Murdoch, N., Stott, A., Maurice, S., Wiens, R., and Mimoun, D. and the SuperCam Acoustics Working Group: The Supercam Microphone to support LIBS investigation on Mars: review of the first laser-spark recordings., Europlanet Science Congress 2021, online, 13–24 Sep 2021, EPSC2021-138, https://doi.org/10.5194/epsc2021-138, 2021.
1. Introduction
The ESA-Roscosmos ExoMars 2022 Mission [1] will deliver the Rosalind Franklin Rover and Kazachock Surface Platform to the Oxia Planum landing site on Mars [2, 3]. The launch window opens on 20 September 2022 with a corresponding Mars arrival on 10 June 2023. The Rover’s mission objectives are to search for signs of life and characterise the shallow subsurface. During its 211 sol nominal mission ‘Rosalind Franklin’ will accomplish its objectives using its ‘Pasteur’ Payload of 9 instruments, plus a drilling system capable of extracting samples from down to 2m for analysis.
2. Mission Status
Tests and reviews to confirm overall spacecraft readiness are proceeding, including a campaign of High Altitude Drop Tests (HADTs) on the parachute system. Activities at the Rover Operations Control Centre (ROCC) —located at ALTEC, Turin (IT)— are ramping up. Software systems used during the mission for planning are being tested and refined, and the Control and Science Teams are working together to train for the day-to-day operations environment.
3. Spacecraft Control
The ROCC can be considered an Activity Plan factory for the Rosalind Franklin rover. The ROCC is designed to support ESOC (European Space Operations Centre) during the launch, LEOP (Launch and Early Orbit Phase), when conducting periodic checkouts of the rover and instruments in interplanetary cruise, and to perform rover mission operations on Mars. A partner facility in Moscow, the Surface Platform Payload Operations Control Centre (SPOCC), controls the Kazachok Surface Platform.
The Science Team and the rover Control Team work together at the ROCC (including by remote connection) to conduct two parallel and connected processes. The Strategic process, performed during office hours, is the top-level process to plan rover activities. It proceeds via daily structured work and meetings. Strategic planning aims to achieve the rover mission objectives and maximize scientific return, and it is dynamic; adjusting to new scientific findings and interpretations. Strategic planning is done on 3 timescales: short term (next sol), medium term (within the current mission phase), and long-term (the next major mission phase plus objectives that could be addressed further in the future).
The Tactical process is the sequence of events triggered by the downlink of rover data to ROCC following an orbiter pass. It ends with uplink of validated activity plans to the rover for execution. Tactical planning is done on a schedule synchronised with downlink and uplink via Mars orbiters.
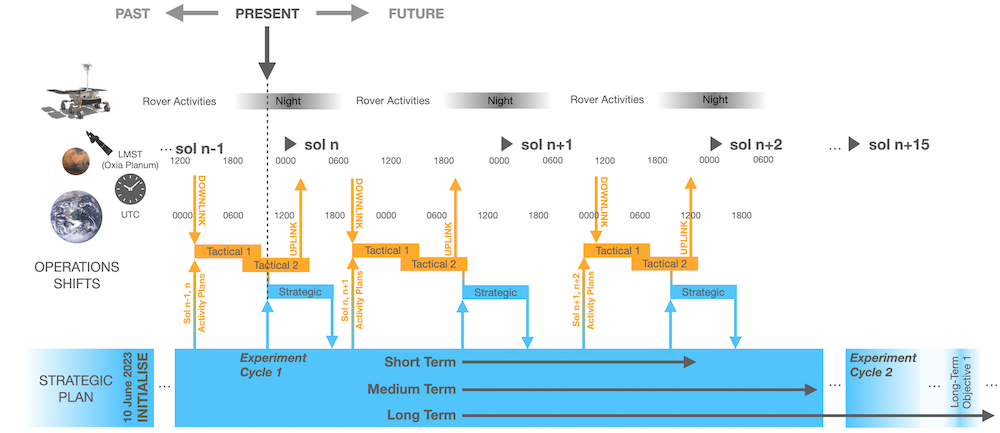
Figure 1: Illustration of scheduling strategic and tactical processes.
4. Strategic Plan
The Strategic Plan provides traceability from the top-level mission science objectives to individual rover activities. It provides the scientific context and background for how the mission science is organised. The Rover Science Operations Working Group (RSOWG) is building the Strategic Plan for the rover via 3 main tasks:
- Define scientific questions elaborated from the mission objectives.
- From these questions, construct corresponding hypotheses that are testable by rover instruments at the Oxia Planum landing site.
- Prepare preliminary instrument command sequences and potential targets to test the hypotheses.
Upon landing, the Strategic Plan will be ‘initialised’ at the landing point by the Science Team. They will interpret new data, assess locations to perform initial activities, and set long-term objectives.
5. Science Targets
The ‘Science Target Scheme’ has been conceived for use in daily science operations in order to harmonize the description of the places and features observed by the Rosalind Franklin rover during the mission, and the links between them. It is integrated into software tools running at the ROCC, and the data submitted to ESA’s Planetary Science Archive (PSA). It is a hierarchical schema of 10 classes representing objects at spatial scales relevant to Rover science, from areas identified in orbital data, down to spots on crushed samples analysed by instruments in the Rovers’ Analytical Laboratory Drawer, ALD [see 1]. A concept showing use of several target types used during the Post-Landing-To-Egress (PLTE) mission phase is shown in Figure 2.
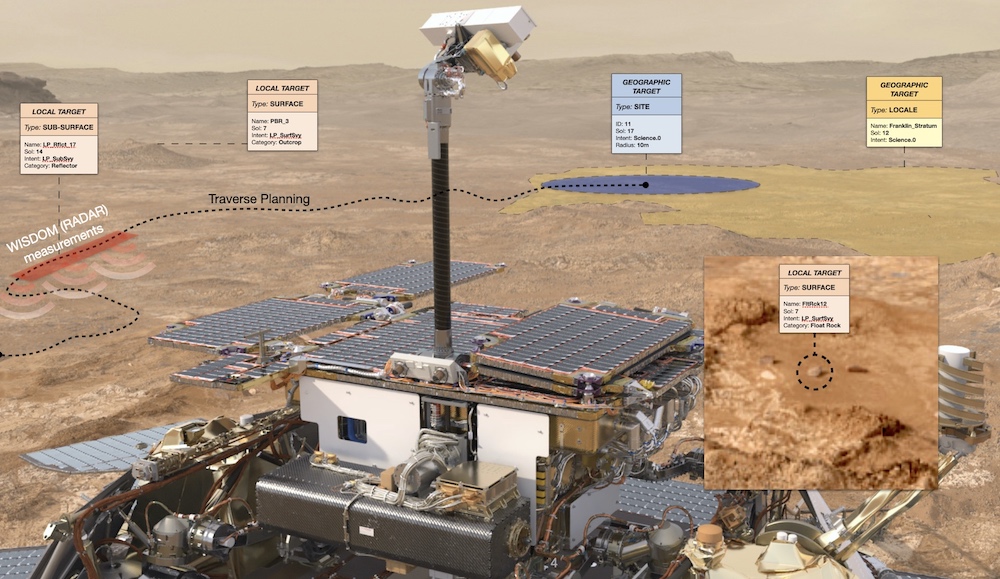
Figure 2: Concept for use of science targets in the PLTE mission phase (expected to last ~10 sols).
6. Team Simulations
During 2021-2023 a programme of simulations is being performed for training and certification of the team for operations. A subset of simulations in the programme are planned and run by the RSOWG. These allow the Science Team to test and refine their processes, for example to perform decision-making in the time-limited operations environment, and to rehearse several designated roles (e.g. Journal Keeper, Long Term Planner). RSOWG simulations are planned by a dedicated Simulations Planning Group composed of science, project and industrial team representatives. They use inputs from all Rover instrument teams, and lessons learned from analogue campaigns [e.g. 4] and other information, to design the scenarios determined to be most fruitful for maturing scientific processes.
7. ‘Micro’ and ‘Macro’ working groups
The RSOWG has chartered the ‘Micro’ and ‘Macro’ sub-working groups with a broad mandate to prepare for and optimise aspects of science operations at those spatial scales. For example, the Micro group works on the protocol for assessment of sample analyses, and builds knowledge of sample types using terrestrial analogues. While the Macro group, for example, provides a detailed morphostratigraphic map of the landing site as input to building the strategic plan [5], and prepares the geospatial data layers used in operations. Both groups also work together on important topics that span orbital to sample spatial scales, such as interpreting orbital spectroscopic and geomorphological data to set and refine mineralogical expectations for mission samples.
Acknowledgements
The authors wish to sincerely thank the ExoMars 2022 Science Team and Industrial Teams for their continuing tireless efforts to ensure readiness for operations.
References
[1] Vago, J. L. et al., (2017) Astrobiology 17 (6–7), 471–510, doi:10.1089/ast.2016.1533
[2] Quantin-Nataf, C. et al., (2021) Astrobiology 21 (3), doi:10.1089/ast.2019.2191
[3] Mandon, L. et al., (2021), Astrobiology 21 (4), doi:10.1089/ast.2020.2292.
[4] Balme, M. R. et al., (2019) Planet. Space Sci. 165, 31–5.
[5] Sefton-Nash, E. et al., (2021) in LPSC 52, #1947.
How to cite: Sefton-Nash, E., Vago, J. L., Joudrier, L., Haessig, F., Williams, A., Mitschdoerfer, P., Koschny, D., Lim, T., Toni, A., Fonteyne, R., Orgel, C., and Bahia, R.: ExoMars 2022 Rover Science Operations Preparations, Europlanet Science Congress 2021, online, 13–24 Sep 2021, EPSC2021-773, https://doi.org/10.5194/epsc2021-773, 2021.
1 Introduction & Scope
3D vision (mapping, localization, navigation, science target recognition etc.) using Planetary Rover imaging requires high-level test assets, including a “ground truth” against which the processing results (rover locations, 3D maps) can be compared. Whilst end-to-end simulation for functional testing is realized by visualization of a drone-based DTM (Digital Terrain Model), the accuracy and robustness of vision-based navigation and 3D mapping can only be verified by high-fidelity data sets. The approach followed in the EU Horizon-2020 Project ADE [3] used a terrestrial-captured image data set for high- and medium resolution (2mm / 3dm grid size) DTM generation of a representative Mars-analog environment, followed by batch rendering to be presented to the respective 3D vision components (Visual Odometry – VO, and stereovision-based point cloud generation):
- Capturing terrestrial & drone-based images for photogrammetric reconstruction using ground control points (GCPs)
- COTS (Commercial-Off-The-Shelf) compilation of 3D textured models in different resolutions using Structure-from-Motion (SfM)
- Fusion of the gained textured point clouds in the visualization component PRo3D, and batch rendering of simulated stereo images at poses along a Rover trajectory
- Using these images to validate / evaluate vision-based navigation and mapping frameworks.
2 Ground Truth 3D Data Assembly
Several images (6000x4000 pixels, Figure 1 bottom-left) on a test site at the Canary Islands were taken with a SONY ILCE-6500 digital camera. For DTM geo-referencing, 4 points were dGPS-measured (Figure 1, top). The reconstruction tool used was CapturingReality, using the following workflow:
- Import (a total of 1754) images and Ground Control Points (GCPs).
- Geo-registration: Identified GCPs on the images.
- Image alignment/registration. Find matching points, calculate camera poses and internal geometry, and a sparse 3D point cloud (Figure 1, bottom-right).
- Model generation for a complete dense 3D mesh in high quality.
- Texture mapping on the dense 3D model.
- Ortho image and DSM computation (49948 x 30768 pixels) with spatial resolution of 2mm in epsg:32628-WGS 84/UTM zone 28N coordinate system.
A similar technique was used for an image sequence captured by a drone flown by ESA in medium height, gaining a DTM with 3cm resolution. Without GCPs, a co-registration was possible within the following visualization component (see next section). See the various 3D data sets on Figure 2.
3 Simulation with PRo3D
PRo3D [1] allows planetary scientists fluent navigation through a detailed geospatial environment with a visual experience close to field work. It offers much of the required functionality to generate large volumes of reference images with a fidelity close to field captures and a clear relation to the geometry of the terrain and the capturing position. The fidelity is achieved by a high resolution of the DTMs and its image textures. Combination of textured point clouds (OPCs – Ordered Point Clouds) in various resolutions is easily possible by superimposing very high resolution data sets onto global medium / low resolution data sets (Figure 3). PRo3D’s batch rendering enables mass-production of such ground truth data by defining many different viewpoints from which to render different types of images, including camera animations between such viewpoints.
4 Testing the approach using a customer application
The demonstrated approach allows to verify navigation and reconstruction algorithms with simulated imagery. The DTMs and navigation poses resulting from processing this imagery can be directly and accurately compared with the original DTM & image poses from which the images were rendered. Thus, deviations between the ground truth and the resulting reconstruction as well as image poses can be more efficiently investigated.
To test an application, 101 stereo image pairs along a straight 10m path were rendered and fed into ORB-SLAM [6] (https://github.com/Phylliida/orbslam-windows) VO with satisfactory results (Figure 4).
5 Conclusion
We present a high-fidelity method to generate realistic rendered ground truth images for validating planetary 3D vision mechanisms (VO / stereo mapping / SLAM), based on terrestrial capturing of planetary analog environment by means of the PRo3D viewer’s batch render capability. The approach is currently in use for preparation of ExoMars PanCam 3D Vision, and HERA 3D Vision [4], [5].
Future work can include albedo maps in connection with a shader and artificial illumination, the usage of models that support ambiguities on Cartesian DTMs (e.g. overhangs, caves), adding different types of noise to simulate real conditions, and the augmentation of the landscapes by additional (real captured) rocks [2]. On the application side, adding noise to image content and poses, longer trajectories, multiple locations for mapping, and the combination / data fusion with other simulated sensors (LIDAR, INS) can be envisaged.
References
[1] Barnes R., Gupta S., Traxler C., Hesina G., Ortner T., Paar G., Huber B., Juhart K., Fritz L., Nauschnegg B., Muller J.P., Tao Y. and Bauer A. Geological analysis of Martian rover-derived Digital Outcrop Models using the 3D visualisation tool, Planetary Robotics 3D Viewer - PRo3D. In Planetary Mapping: Methods, Tools for Scientific Analysis and Exploration, Volume 5, Issue 7, pp 285-307, July 2018.
[2] Paar, G., Traxler, C., Sidla, O., Bechtold, A., Koeberl, C. “Science Autonomy Training by Visual Simulation”. International Symposium on Artificial Intelligence, Robotics and Automation in Space (I-SAIRAS), 2020.
[3] Ocón, J., et al. "ADE: Autonomous DEcision making in very long traverses." International Symposium on Artificial Intelligence, Robotics and Automation in Space (I-SAIRAS), 2020.
[4] Maria del Pilar Caballo Perucha, Rebecca Nowak, et. Al. Didymos images´ simulation for 3D reconstruction within HERA project. Abstract and oral presentation at Europlanet Science Congress 2020. Virtual Meeting. 21st September – 9th October 2020. Space Missions to Small Bodies: Planetary Defense
[5] Maria del Pilar Caballo Perucha, Rebecca Nowak, et. Al. Imaging Simulations of HERA Didymos Approach. Mission & Campaign Design. Abstract and E-poster at 7th IAA Planetary Defense Conference. Online Event. 26th- 30th April 2021.
[6] Mur-Artal, Raul, and Juan D. Tardós. "Orb-slam2: An open-source slam system for monocular, stereo, and rgb-d cameras." IEEE Transactions on Robotics5 (2017): 1255-1262.
Acknowledgments
We thank the European Commission and the members of the PERASPERA programme support activity for their support and guidance. This work receives funding from the European Union’s Horizon 2020 Research and Innovation programme under Grant Agreement No 821988. We thank the ESA Robotics Section / Martin Azkarate for providing the aerial DTM.
How to cite: Paar, G., Traxler, C., Caballo Perucha, P., Bauer, A., Klopschitz, M., Fritz, L., Nowak, R., and Ocón Alonso, J.: 3D Ground Truth For Simulating Rover Imagery 3D Vision Testing, Europlanet Science Congress 2021, online, 13–24 Sep 2021, EPSC2021-21, https://doi.org/10.5194/epsc2021-21, 2021.
The current generation of rovers exploring Mars for traces of life feature tools for subsurface sampling capabilities. This addition to the sampling capabilities of the martian rovers is crucial for the search for life. In fact, in the subsurface life is more likely to be protected from the harsh radiation environment present on the surface. The sampling of subsurface materials started with the analysis of the first millimeters of unweathered rocks being pulverized or abraded (NASA/MSL), evolved with the extraction of small cores from the first 10 centimeters (NASA/Mars2020), and will continue with the exploratory drilling of ESA's ExoMars 2022 which is capable of reaching 2 meters of depth. The proper planning and interpretation of measurements below the topographic surface require a model of the subsurface. Geological models are digital representations of subsurface structures generated by the sequence in time of processes putting in place different rocks and terrains. Geologic cross-sections are an example of bi-dimensional modeling that extends observations taken at the surface. Modern geologic models are commonly developed in three dimensions and used for terrestrial resource exploration, seismic analyses, and hydrologic simulations. The key to a good geologic model is the integration of measurements taken by different instruments. For ExoMars 2022, observations at the surface will be extended at depth by the spectrometer Ma_MISS which will read the mineralogical composition down to two meters, and the radar WISDOM which will collect geophysical images of the terrain down to ten meters or more. In this work, we explore different methods to generate geological models of the subsurface of areas at Oxia Planum and a selection of analog outcrops at different scales.
How to cite: Frigeri, A., De Sanctis, M. C., Ciarletti, V., Altieri, F., Ammannito, E., Apuzzo, A., Brossier, J., Ercoli, M., Ferrari, M., De Angelis, S., Formisano, M., and Fonte, S.: Geological modeling at ESA's ExoMars 2022 landing site Oxia Planum, Europlanet Science Congress 2021, online, 13–24 Sep 2021, EPSC2021-746, https://doi.org/10.5194/epsc2021-746, 2021.
Introduction: ESA’s ExoMars rover will land in the Oxia Planum (OP) region [1,2], which was chosen for its ancient age, evidence for the sustained presence of water, the presence of layered deposits, and the potential for biosignature preservation [2]. While some of the geological characteristics have been studied in detail [3-5], other aspects are less well understood. In particular, it is unclear if the situation in OP is a unique one, or if the geologic setting is representative for Mars on a regional, or even a global scale. Specifically, the stratigraphic relationship of the geologic units in OP to the nearby ancient impact basin, Chryse Planitia, requires further study. For example, a »bathtub«-like ring of Fe/Mg-rich phyllosilicates around Chryse [6] may indicate that the phyllosilicates at OP reflect aqueous processes that operated in a specific context at basin-scale.
To test the hypothesis that OP is representative for a circum-Chryse geologic setting, we selected a site in northern Xanthe Terra (XT) (~9-13.5°N/315-318.5°E; Fig. 1) to investigate key geologic features and compare them to OP. This site displays several characteristics similar to OP, making it a suitable reference site: The presence of phyllosilicates [7], the proximity to fluvial features [8-10], and the abundance of remnant buttes that are indicative of widespread erosional processes [11]. Here we present preliminary results of our mapping and geologic analysis.
Preliminary Results and Discussion: The study area is approximately 225 × 190 km in size. The general elevation increases in height from north to south from approximately -2,960 m to -1,800 m. Both at OP and XT, the lowland-highland boundary is expressed as a gradual slope rather than a sharp topographic step.
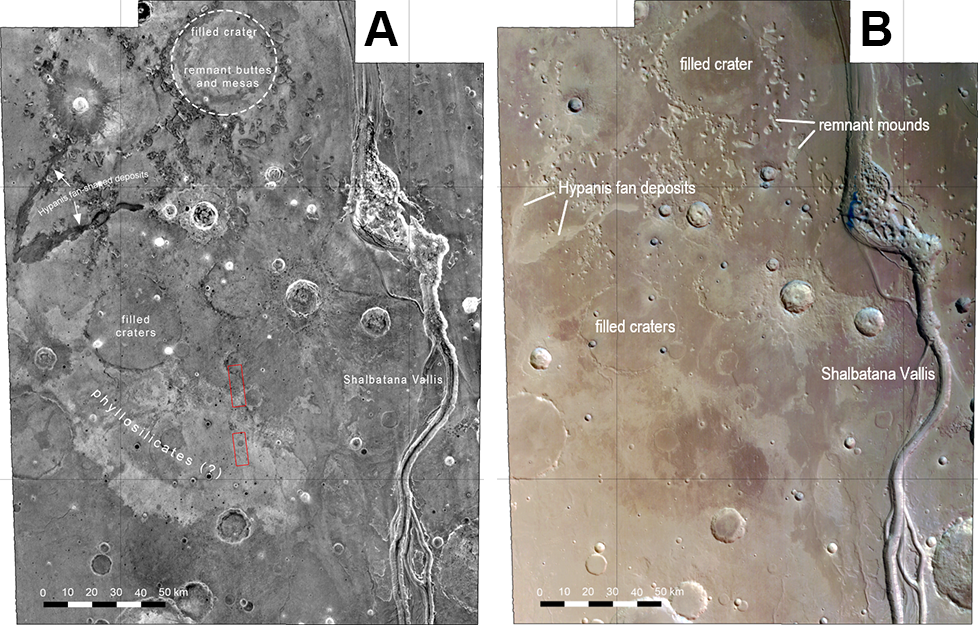
Figure 1: (A) THEMIS nighttime IR and (B) HRSC image mosaics of the study site in Xanthe Terra.
In the northwestern study area, the Hypanis fan represents the arguably largest sedimentary fan deposit on Mars [8-10]. These deposits are finely layered and appear dark in THEMIS nighttime IR images (Fig. 1). Sedimentary fan deposits, while having a smaller extent, are also present in OP at the termination of the Coogoon Valles fluvial system [5,12,13]. Both the sedimentary deposits in XT [8-10] and OP [13] are thought to have a fluvial origin.
Phyllosilicates are widespread in OP [4-6] and are the main target of the ExoMars rover. Apart from their spectral signature, they are also characterized by a bright THEMIS nighttime IR signature and a polygonised texture at HiRISE scale. A global-scale search for chemical alteration signatures revealed the presence of Fe/Mg phyllosilicates in northern XT, marginal to Chryse [4]. As in OP, the phyllosilicate-bearing plains appear bright in THEMIS nighttime IR images (Fig. 1). At least two different units are present in this region. The most widespread is a light and layered unit, which is partly eroded, exposing a darker material underneath (Fig. 2). NW – SE orientated small dunes and periodic bedrock ridges, a type of aeolian erosional landforms which is ubiquitous in the clay-bearing plains of OP [14], are present on top of the darker unit. HiRISE coverage of both units shows distinct polygonised textures. Several inverted craters are present within this two units. The material of these inverted craters differs from both units, and, therefore, represents the remnants of at least one further eroded unit. The phyllosilicate-bearing plains are overlain by a widespread unit, which seems to be present in most of the northern study area.
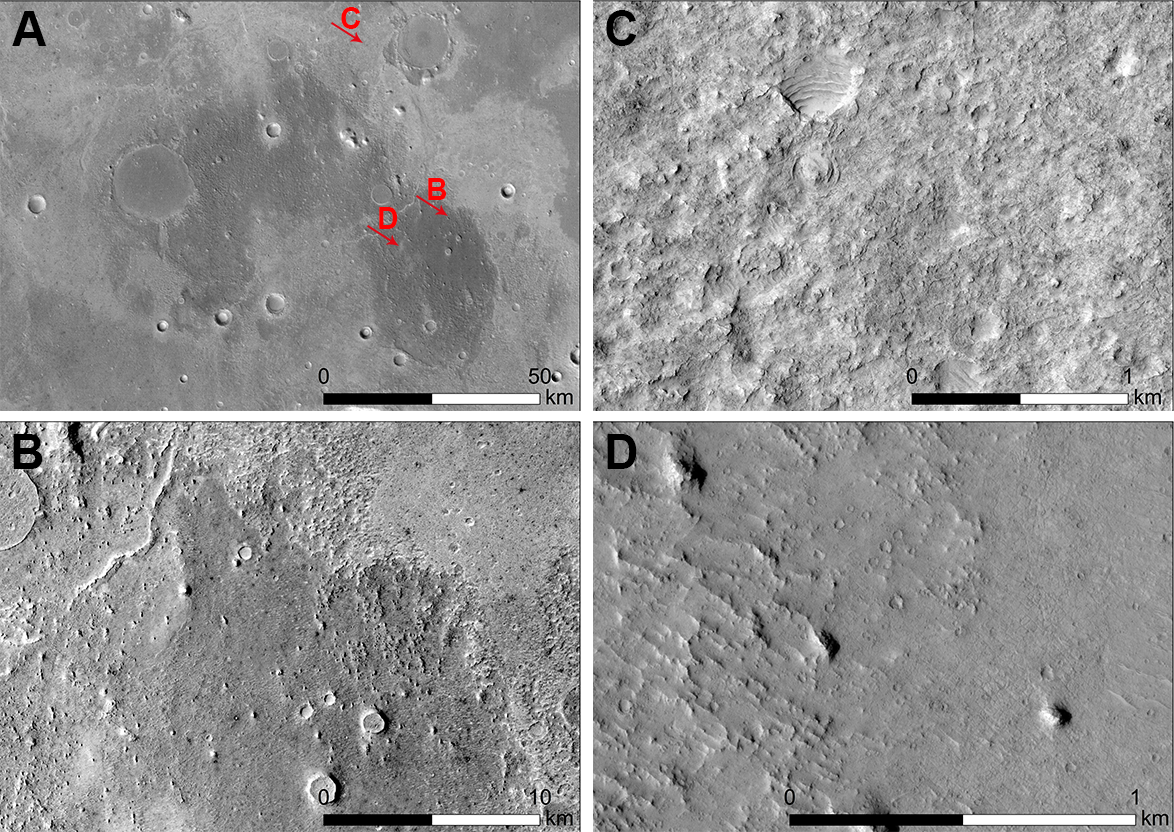
Figure 2: (A) HRSC mosaic of the phyllosilicate-bearing plains. The erosional contact is shown in (B). (C) and (D) are HiRISE images of the lighter and darker unit, respectively.
The rims of ancient filled craters are outlined by rings of mounds. The diameters of these mounds range from tens of meters to several kilometers. Their appearance is variable and resembles mesas, rounded knobs/buttes, and “bread-crust-like features” (Fig. 3). These mounds are increasing in height and abundance towards north, i.e. towards Chryse. A similar trend of height and abundance was also observed in OP [15]. However, the height of these mounds varies individually. Rounded buttes, for example, can be higher than mesas in their immediate neighborhood. Some mounds show a fine layering, and, in some cases, mounds stand on top of a finely layered basis. The mounds appear dark in THEMIS nighttime infrared images (Fig. 1). Similar mounds are present along the eastern highland boundary of Chryse [11]. The composition of the mounds and their erosional history are not yet clear. The low thermal inertia and the fine layering of some of the mounds, however, favor a sedimentary material. The timing of mound formation relative to other geological units is also still unknown since stratigraphic relationships between these units still seem conflicting.
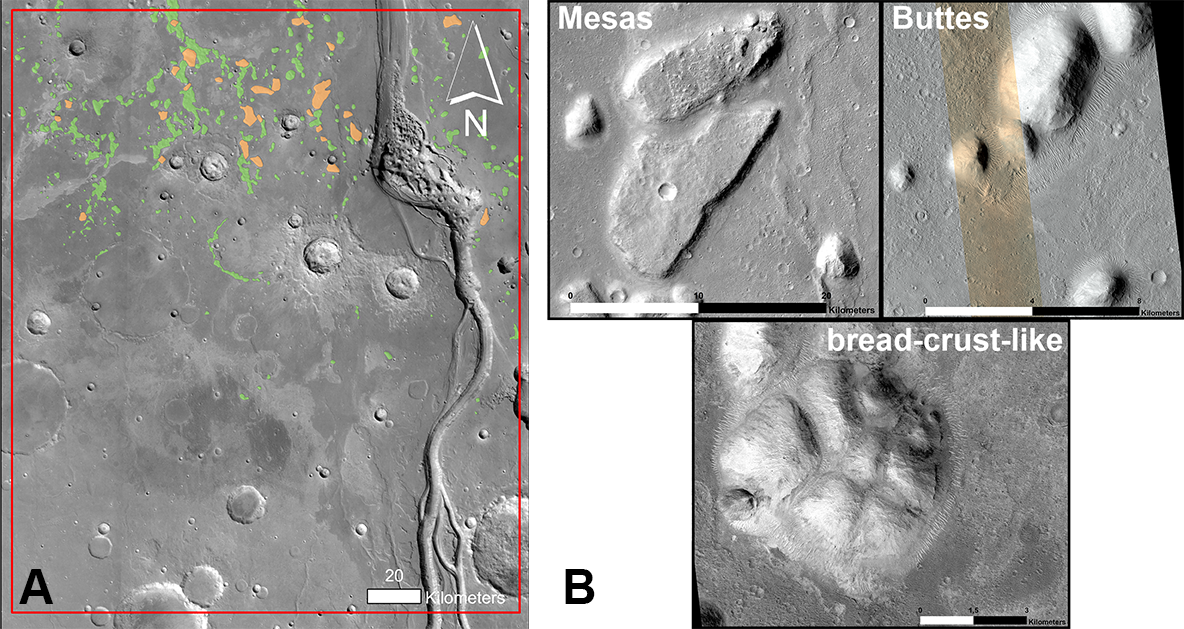
Figure 3: (A) Mapped mounds in the study area. Rounded buttes are shown in green and mesas in orange. (B) CTX and HiRISE images of the remnant mound types.
Preliminary Conclusions: Northern XT and OP share various geological characteristics (e.g., sedimentary fans, phyllosilicates, remnant mounds) and a comparable location at the lowland-highland boundary at Chryse Planitia. These similarities enable a comparison between both sites and a testing of hypotheses related to the ExoMars rover landing site.
References:
[1] Vago, J. L. et al. (2015) Sol. Syst. Res., 49, 538–542. [2] Bridges, J. C. et al. (2018), LPS XLIX, Abstract #2177. [3] Vago, J. L. et al. (2017) Astrobiol., 17, 471–510. [4] Carter, J. et al., (2013) J. Geophys. Res., 118, 831–858. [5] Quantin-Nataf, C. et al. (2021) Astrobiol., 21, 994-1013. [6] Mandon, L. et al. (2021) Astrobiol., 21, 464-480. [7] Carter, J. et al. (2019) Ninth Int. Conf. Mars, Abstract #6175. [8] Hauber, E. et al. (2009) Planet. Space Sci., 57, 944–957. [9] Fawdon et al. (2018) EPSL, 500, 225–241. [10] Adler, J. B. et al. (2019) Icarus, 319, 885–908. [11] McNeil, J. et al. (2021) LPSC, 52, Abstract #2548. [12] Ivanov, M. A. et al. (2020) Sol. Syst. Res., 54, 1-14. [13] Molina, A. et al. (2017) Icarus, 293, 27-44. [14] Silvestro, S. et al. (2021) GRL), doi: 10.1029/2020GL091651. [15] McNeil, J. D. et al. (2020) LPSC, 51, Abstract #1948.
How to cite: Frueh, T., Hauber, E., Adeli, S., Tirsch, D., and Nass, A.: Northern Xanthe Terra: Update on the Reference Site for the Exomars2022 Landing Site in Oxia Planum, Europlanet Science Congress 2021, online, 13–24 Sep 2021, EPSC2021-615, https://doi.org/10.5194/epsc2021-615, 2021.
Very-high-resolution rapid 3D mapping of Oxia Planum using cascaded MOLA-HRSC-CTX-HiRISE
Y. Tao (1), J-P. Muller (1), S. J. Conway (2)
(1) Imaging group, Mullard Space Science Laboratory, University College London, Holmbury St Mary, RH5 6NT, UK (yu.tao@ucl.ac.uk; j.muller@ucl.ac.uk), (2) CNRS, Laboratoire de Planétologie et Géodynamique, 2 rue de la Houssinière, Nantes, France (susan.conway@univ-nantes.fr)
Abstract
Stereo photogrammetry and/or photoclinometry have long been applied to the production of 3D imaging datasets for planetary surfaces. However, insufficient image resolution or reductions in the resultant 3D resolution, the lack of adequate stereo coverage and where available, lengthy processing time, various matching artefacts or noise effects, and unsatisfactory quality and complexity of processing, have long been significant barriers for large-area planetary 3D mapping. In this work, we demonstrate how deep learning based solutions can address the above issues using a single image and a coarse 3D reference as inputs.
1. Introduction
We demonstrate a very high-resolution rapid 3D mapping techniques and results over Oxia Planum, the forthcoming Rosalind Franklin ExoMars 2022 rover landing site. This uses a combination of deep learning based single-image super-resolution restoration (SRR), deep learning based single-image digital terrain model (DTM) estimation, and cascaded 3D co-alignment methods.
2. MARSGAN SRR
Improving the spatial resolution of Mars orbital images allows us to extract greater amounts of information about the nature of the surface, how it formed and has changed over time. One of the options to achieve a greater spatial resolution is through the use of SRR techniques. Recently, we have developed a single-image deep learning based SRR system, using Multi-scale Adaptive-weighted Residual Super-resolution Generative Adversarial Network (MARSGAN) [1], to be able to produce full-strip TGO CaSSIS SRR images within a few minutes. The MARSGAN SRR system can be similarly applied to MRO CTX and HiRISE images as demonstrated in [1].
3. MADNet DTM
The lack of adequate stereo coverage and where such coverage is available, the lengthy processing times, various artefacts and insufficient resolution, have long been big barriers for large-area planetary 3D mapping. Recently, we have developed a single-image deep learning based DTM extraction system, using Multi-scale generative Adversarial U-Net with Dense convolutional block and up-projection (MADNet) [2], to be able to produce high-quality, high-resolution, and artefact-free full-orbital strip CaSSIS DTM within a few seconds. The MADNet DTM system can be similarly applied to MEX HRSC, CTX, and HiRISE images as shown in [2]. Figure 1 shows examples of the MADNet DTM results compared to photogrammetric DTMs for HRSC (PSA MC11 product), CTX (SocetSet® product produced at NHM & OU), and HiRISE (SocetSet® PDS product).
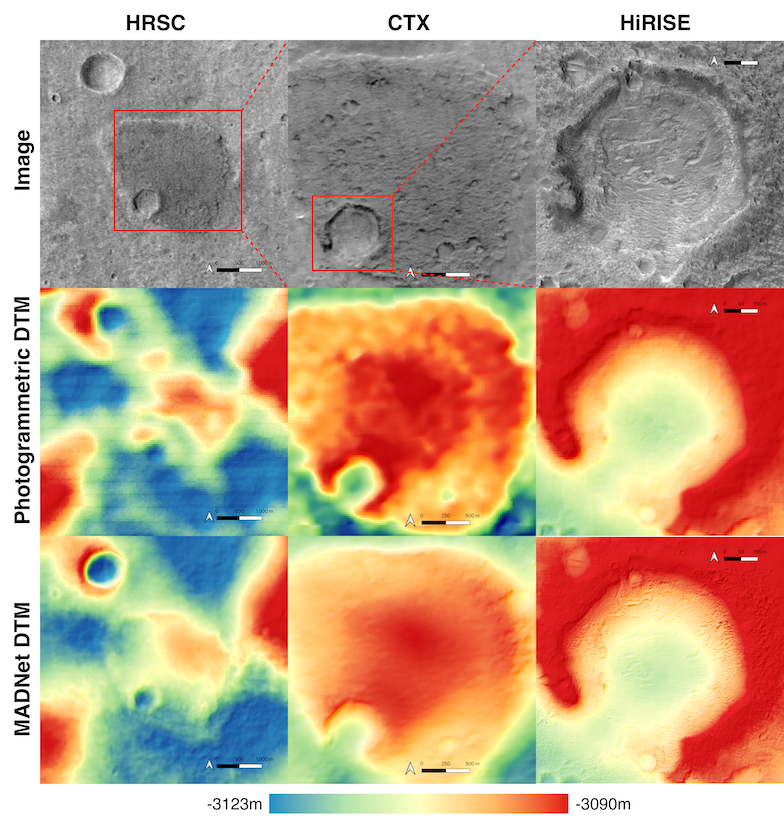
Figure 1. Examples of MADNet DTM results compared to photogrammetric DTMs for HRSC (PSA HRSC MC11 product), CTX (SocetSet® product produced at NHM & OU), and HiRISE (SocetSet® PDS product). Figure taken from [2].
4. Combining MARSGAN and MADNet
The MARSGAN SRR and MADNet DTM system can be efficiently and effectively coupled to produce high-resolution DTMs at subpixel-scale of the input images similar to [3], where we demonstrated MARSGAN SRR with photoclinometry to produce ultra-high-resolution DTMs. Figure 2 shows examples of using MARSGAN SRR coupled with photoclinometry for subsequent very-high-resolution DTM production.
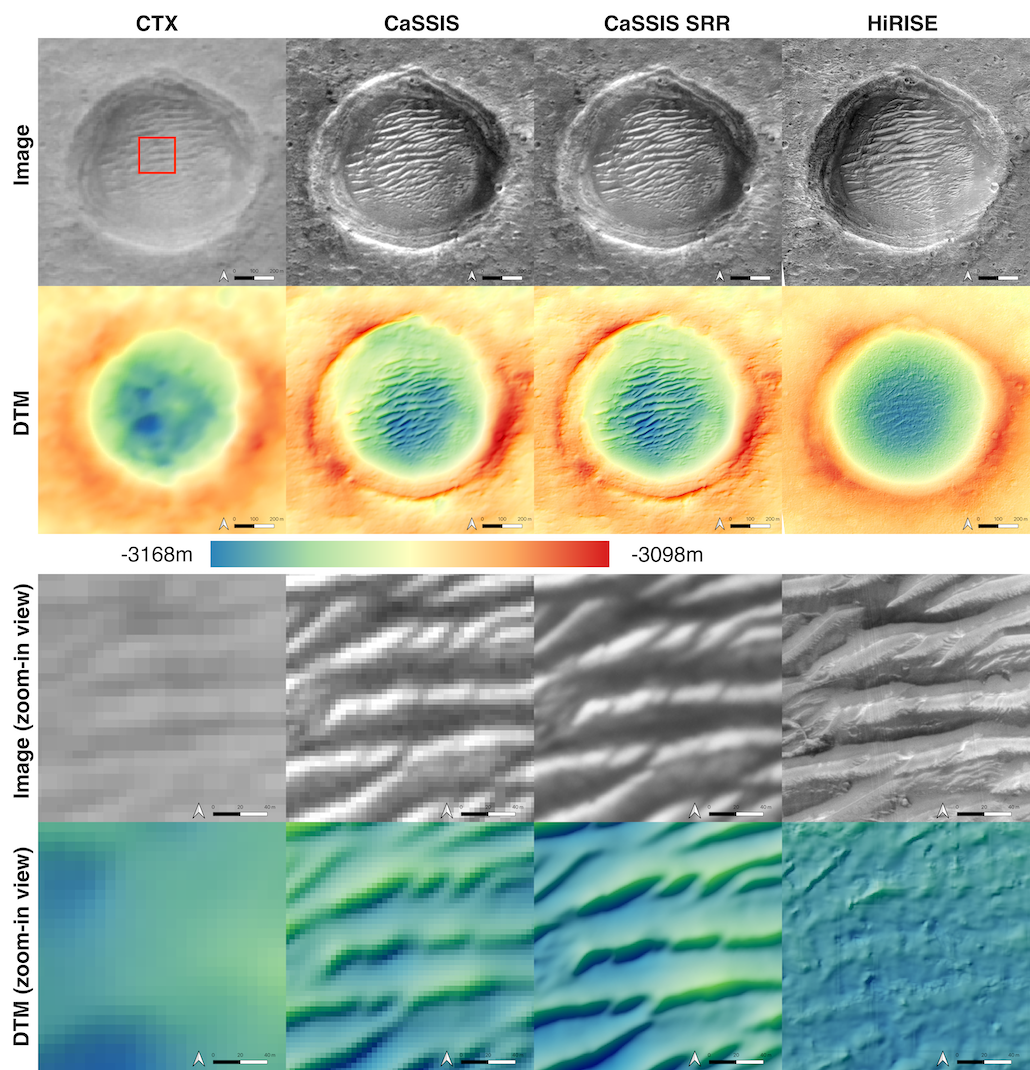
Figure 2. Examples of using MARSGAN SRR for sub-pixel DTM production. Figure taken from [3].
5. 3D Co-alignment and Large-area 3D Mapping
Recently, we have demonstrated an effective image co-registration and B-Spline fitting based 3D co-alignment method to correct for 3D errors using a coarse reference DTM (e.g., MOLA) [4]. Through 3D co-alignment and a coarse-to-fine reconstruction strategy, large-area DTM mosaics can be produced via a sequence of processing steps including: MADNet HRSC DTM production, 3D co-alignment of HRSC DTM and MOLA, MADNet CTX DTM production, 3D co-alignment of CTX DTM and HRSC DTM, MADNet HiRISE DTM production, 3D co-alignment of HiRISE and CTX DTM, MARSGAN SRR of HiRISE, MADNet DTM production using HiRISE SRR image, and 3D co-alignment of HiRISE SRR DTM and HiRISE DTM. Results will be shown of these different examples.
6. Conclusions
In this work, we describe the deep learning based SRR and DTM systems. Potential issues or limitations discussed in [1] and [2] will be studied in detail. Differences between each cascaded DTM products will be validated. As the final product, we demonstrate over Oxia Planum, a high-quality, high-resolution, artefact free, fully co-aligned cascaded DTM mosaics from HiRISE/CTX/HRSC, using a combination of the MARSGAN SRR and MADNet DTM system.
Acknowledgements
The research leading to these results is receiving funding from the UKSA Aurora programme (2018-2021) under grant no. ST/S001891/1. The research leading to these results also received partial funding from the European Union’s Seventh Framework Programme (FP7/2007-2013) under iMars grant agreement n˚ 607379. SJC is grateful for the financial support of CNES in support of her HiRISE work.
References
[1] Tao Y, Conway SJ, Muller J-P, Putri ARD, Thomas N, Cremonese G. Single Image Super-Resolution Restoration of TGO CaSSIS Colour Images: Demonstration with Perseverance Rover Landing Site and Mars Science Targets. Remote Sensing. 2021; 13(9):1777.
[2] Tao Y, Xiong S, Conway SJ, Muller J-P, Guimpier A, Fawdon P, Thomas N, Cremonese G. Rapid Single Image-based DTM Estimation from ExoMars TGO CaSSIS Images using Generative Adversarial U-Nets. Remote Sensing, 2021 (under review).
[3] Tao Y, Douté S, Muller J-P, Conway SJ, Thomas N, Cremonese G. Ultra-high-resolution 1m/pixel CaSSIS DTM using Super-Resolution Restoration and Shape-from-Shading: Demonstration over Oxia Planum on Mars. Remote Sensing, 2021 (under review).
[4] Tao Y, Michael G, Muller J-P, Conway SJ, Putri ARD. Seamless 3D Image Mapping and Mosaicing of Valles Marineris on Mars Using Orbital HRSC Stereo and Panchromatic Images. Remote Sensing. 2021; 13(7):1385.
How to cite: Tao, Y., Muller, J.-P., and Conway, S.: Very-high-resolution rapid 3D mapping of Oxia Planum using cascaded MOLA-HRSC-CTX-HiRISE, Europlanet Science Congress 2021, online, 13–24 Sep 2021, EPSC2021-790, https://doi.org/10.5194/epsc2021-790, 2021.
In 2022 rover, ESA-Roscosmos will launch rover to land at Oxia Planum on Mars. Oxia Planum is a wide, Noachian-age, phyllosilicate-bearing plain located between Mawrth and Ares Valles. The bedrock phyllosilicate deposits at Oxia Planum is Fe,Mg-rich and one of the largest exposures of this type on Mars, with a thickness of more than 10 m [1]. When characterized in the near infrared by CRISM and OMEGA instruments, the bedrock deposits exhibit absorptions that suggest the presence of Fe,Mg-rich phyllosilicates with significant amounts of Fe2+ in octahedral sites (i.e., trioctahedral) [2]. The typical spectrum is best matched by saponite or vermiculite, but an accurate spectral match is lacking so far. Because precise mineral composition of the bedrock is not fully understood, limited conclusions can be drawn regarding the aqueous evolution and habitability potential of Oxia – the main scientific aim of the ExoMars 2022 mission. To fill this gap, and to better prepare for in-situ analyses by the ExoMars2022 rover, we performed a survey of potential terrestrial analogue rocks. We have identified terrestrial deposits of Fe-rich, trioctahedral vermiculite and perform spectral comparisons with the Martian substrate.
Analogues from two terrestrial sites were obtained: (1) vermiculitized chlorite-schists from Blue Spur, Otago, New Zealand and [3] (2) basaltic tuffs and pyroclastics from Granby, Massachusetts, USA, with Fe-rich clays filling amygdales [4]. The samples were characterized by X-ray diffraction to understand chemistry and structure of clay minerals and by NIR spectroscopy in order to provide further structural details and to assess the match to Oxia Planum bedrock clays. XRD was performed on bulk rock samples as well as for separated clay fraction minerals. Near Infrared (NIR) spectra for each sample were collected using a reflectance spectrometer in the near-infrared (0.8–4.2 μm) mode. Analysis was performed on powdered samples, under ambient temperature and pressure conditions. Both analogues have been added to a newly built Planetary Terrestrial Analogue Library (PTAL) rock collection and spectral library.
Deposits in Blue Spur formed by erosion and deposition of greenschist-facies quartzo-feldspathic schists rich in Fe-rich chlorite. Due to rapid erosion and non-oxidizing or mild oxidative conditions [3] chlorite remained unoxidized when buried. Later interactions with groundwater caused formation of trioctahedral vermiculite and progressive alteration of deposit led to illitization and kaolinitization For our purposes we have collected samples of pristine schist clasts, greenish (unoxidized) vermiculitized material and pale, illitized clasts [3]. The XRD patterns of oriented clay fraction separates suggest the presence of chlorite in pristine material, trioctahedral vermiculite in greenish samples that underwent alteration in anoxic conditions, and interstratified illite-vermiculite in more oxidized samples.NIR spectroscopy analysis of Otago samples tends to indicate that the nature and overall Fe content is broadly similar to the phyllosilicates at Oxia. Furthermore, illitization of the vermiculite seen spectrally in Otago is likely limited for Oxia. This means that vermiculite at Oxia is a rather pure, one-phase mineral that underwent only minor (if any) post-depositional alterations toward illite.
The Granby Tuff consists of basaltic flows and volcanic ash units. In places, it contains zones of vesicular basalts that have amygdales filled with calcite and dark-brown clays. The clays filling the amygdales are of apparent hydrothermal origin, that is precipitated in gas vesicles from solutions generated by hydrothermal alteration of the basaltic tuff. The clays were reported to be either saponite or vermiculite [4]. The XRD patterns of the oriented clay fraction separates from these tuffs reveal the presence of well-crystallized, trioctahedral vermiculite and various amounts of saponite in different samples. In NIR spectroscopy, Granby samples show quite a good spectral match to Oxia and indicate that saponite, present in Granby, is absent from Oxia spectra. Oxia deposits are likely pure vermiculite rather than a mixture of saponite and vermiculite. Additionally, other spectral features suggest that the Granby clays have different Fe/Mg ratios than minerals of Oxia Planum, or a different (plausibly lower) oxidation state of Fe in the clay structure.
Our spectral analogue study shows that rocks containing Fe2+-rich vermiculite, locally with octahedral Al and (oxidized) Fe3+, are likely the main component of bedrock phyllosilicates at Oxia Planum. In terms of clay structure and its di- versus trioctahedral nature, Oxia deposits are matched best by a vermiculite-saponite from hydrothermally-derived settings (Granby Tuffs), although the contribution of saponite must be minor at Oxia. Comparison of Otago vermiculite to Oxia shows high Fe content in Oxia and a similar oxidation state. Spectral inconsistencies between Otago and Oxia related to presence of Al in the clay structure allow us to conclude that Oxia bedrock deposits were likely not oxidized nor illitized after formation.
Acknowledgments: This project has received funding from the EU Horizon 2020 Research and Innovation Program (687302, PTAL), and the Research Council of Norway (Centres of Excellence funding 223272).
References: [1] Quantin-Nataf C. et al. 2020: Astrobiology, accepted. [2] Carter J. et al. 2016. 47th Lunar and Planetary Science Conference. Abstract no. 2064. [3] Craw D. 1984. Clay Minerals 19: 509-520. [4] April R.H. and Keller D.M. 1992. Clays and Clay Minerals 40: 22-31.
How to cite: Krzesinska, A., Bultel, B., Loizeau, D., Craw, D., April, R., Poulet, F., and Werner, S.: Spectral study of Fe-rich vermiculite bearing rocks and implications for mineralogy of Oxia Planum, ExoMars 2022 Rover landing site, Europlanet Science Congress 2021, online, 13–24 Sep 2021, EPSC2021-349, https://doi.org/10.5194/epsc2021-349, 2021.
The landing site of the ExoMars 2022 mission is Oxia Planum, a basin rich in hydrated minerals located between Mawrth and Ares Vallis. Its clay-rich deposits of Noachian age have been covered by volcanic outflows, that have only recently started to erode away. This makes it more likely that biochemical markers have been preserved as they were shielded from long-term cosmic ray exposure.
Martian analogue sites are valuable testing-grounds for both instrumentation and scientific analysis. During the EuroMoonMars Etna campaign, mockups of ExoMars instruments were used to perform scientific analysis on a Martian Analogue site on Mt. Etna.
Satellite images are used to identify sites of interest on the slopes of Mt. Etna, mimicking the use of images and data from the MRO CTX, HiRISE, MEX HRSC and the CRISM spectrometer, to characterise the surface of Oxia Planum during the ExoMars Mission.
On the ground, Panoramic imaging and wide-angle photographs are used to select sites for close-up study with a mock-up of the Pancam instrument. Pancam is a set of two wide angle cameras for multi-spectral stereoscopic panoramic imaging, and a high resolution camera for colour imaging.
On selected sites, geological and biogeochemical markers are identified and characterized using Raman spectroscopy and optical microscopy, mimicking ExoMars’ onboard instruments RLS (Raman Laser spectrometer), and CLUPI (Close-up imager).
How to cite: de Palma, G., Ehreiser, A., Lakomiec, P., and Schlarmann, L.: Site Identification and Sample Analysis with ExoMars Mission mock-up instruments on a Martian analogue site on Mt. Etna, Europlanet Science Congress 2021, online, 13–24 Sep 2021, EPSC2021-760, https://doi.org/10.5194/epsc2021-760, 2021.
The scientific objectives of the ExoMars Rosalind Franklin rover [1] are designed to answer several key questions in the search for life on Mars. In particular, the unique subsurface drill will address some of these questions for the first time, such as the possible existence and stability of sub-surface organics. PanCam [2] will establish the surface geological and morphological context for the mission, working in collaboration with other context instruments. Here, we describe the PanCam scientific objectives in geology, atmospheric science and 3D vision. We discuss the design of PanCam, which includes a stereo pair of Wide Angle Cameras (WACs), each of which has an 11 position filter wheel, and a High Resolution Camera (HRC) for high resolution investigations of rock texture at a distance. The cameras and electronics are housed in an optical bench that provides the mechanical interface to the rover mast and a planetary protection barrier. The electronic interface is via the PanCam Interface Unit (PIU), and power conditioning is via a DC-DC converter. PanCam also includes a calibration target mounted on the rover deck for radiometric calibration, fiducial markers for geometric calibration and a rover inspection mirror. Recent simulations [3] show the view from PanCam, the ‘science eyes’ of the Rosalind Franklin rover.
References:
[1] Vago, J.L., F. Westall, A.J. Coates, et al., Habitability on Early Mars and the Search for Biosignatures with the ExoMars Rover, Astrobiology, 17(6-7), 471-510, doi:10.1089/ast.2016.1533, Jul 2017.
[2] Coates, A.J., R. Jaumann, A.D. Griffiths, et al., The PanCam instrument for the ExoMars rover, Astrobiology, 17 (6-7), 511-541, doi: 10.1089/ast.2016.1548, Jul 2017.
[3] Miles, H.C., M.D. Gunn and A.J. Coates, Seeing through the ‘Science Eyes’ of the ExoMars Rover, IEEE Computer Graphics & Applications, Applications Department, 40, 71-81, doi: 10.1109/MCG.2020.2970796, Mar-Apr 2020.
How to cite: Coates, A. and the Rosalind Franklin PanCam team: PanCam: the ‘science eyes’ of the Rosalind Franklin (ExoMars 2022) rover , Europlanet Science Congress 2021, online, 13–24 Sep 2021, EPSC2021-748, https://doi.org/10.5194/epsc2021-748, 2021.
The Mars Organic Molecule Analyzer (MOMA) investigation is part of the scientific payload of the ExoMars rover Rosalind Franklin that will arrive at Oxia Planum on Mars in June, 2023. MOMA is a dual-source (laser desorption, LD, and gas chromatography, GC) mass spectrometer (MS) that will analyze the organic chemical composition of collected samples in support of the ExoMars objective to seek the signs of life in the near subsurface (up to two meters depth) of Mars [1]. The dual-source design allows MOMA to provide broadly sensitive detection of organics over a range of molecular weights and volatilities, as well as probe structural patterns of martian molecules such as enantiomeric ratios or chain length biases in aliphatic moieties.
A number of important MOMA activities are being carried out in preparation for ExoMars launch in 2022 and science mission beginning in mid-2023. These activities will optimize the readiness of all relevant MOMA hardware (both flight and reference) and of the full team for surface operation. These include development and certification of the MOMA Testbed Model that will serve as a flight reference instrument, analysis of Mars analog samples with MOMA laboratory capabilities, and preparation for data analysis, decision making, and risk management during the rover mission.
The Testbed Model is a ground-based duplicate of the Flight Model (FM), serving a dual role as (i) an engineering reference for verification and validation of flight procedures and for diagnosing flight performance (including any off-nominal situations); and (ii) a science reference with direct traceability to the sensitivity, background, and other characteristics of the FM, with the potential to carry out selected analog studies for scientific interpretation of MOMA flight data.
The Testbed must always retain full flight fidelity and be available on tactical (sol-to-sol) timeframes (more-or-less continuously) to serve its engineering reference functions. It can thus be used to test modified operational software scripts to be run subsequently on the FM. There is additionally a strong bias to maintaining the Testbed in a state of low chemical background and overall performance, comparable to the FM, to retain its ability to rule-in/out any detections of low-concentration organic compounds on Mars. As such the bar for introduction of complex Mars analog samples into the Testbed must be set very high, and must be managed responsibly over the mission duration. Only those analyses requiring the full fidelity of the FM, under simulated Mars ambient conditions, for interpretation of critical data products would normally be considered for significant scientific use of the Testbed.
A variety of sample studies are conducted in MOMA team laboratories, including use of the Engineering Test Unit (ETU) which lacks the Mars thermal-vacuum (Mars ambient pressure) environmental facility of the Testbed but is otherwise a high-fidelity scientific performance reference of MOMA used for analysis of Mars analog materials. Some of the ongoing and planned ETU-based test campaigns include: (i) development of detailed protocols for collection of LD mass spectra, comparing point-by-point and multi-pulse averaging modes [2] and use of isolation and tandem mass spectrometry, or MS/MS, capabilities to inform chemical assignments; (ii) characterization of the dependence on geochemical (e.g. sample matrix) and environmental factors during analysis of organic compounds using derivatization and GCMS, to include a recently-upgraded GC ETU supporting flight-like column and gas processing line temperatures; and (iii) participation in ExoMars collaborative analysis campaigns, using additional shared analogs including designated “mission samples” (matching projected compositions at Oxia Planum), alongside other payload investigations such as the MicrOmega and Raman spectrometers of the Analytical Laboratory Drawer (ALD).
In addition to developing and testing flight-like experimental resources, the MOMA team is actively involved in preparations for ExoMars operations across the spectrum of planning and training for telemetry management, science analysis, and decision-making roles and processes. Team members are participating in rover simulation and software tool training hosted by the Rover Operations Control Center (ROCC) managed by ALTEC SpA, Turin, Italy. As a nominal “end-point” analysis of collected samples during each Experiment Cycle and Vertical Survey campaign, MOMA has significant interest in collaborating fully with all rover scientific payload teams to develop target interpretations and prioritizations based on remote, contact, and collected-sample analyses. As such mission simulations merging and synchronizing strategic and tactical processes of increasing fidelity are critical.
Within the context and structure of these rover-level interactions and flows, the MOMA team additionally is establishing a set of scenario- and data-based evaluation metrics and decision-making procedures to aid in efficient and robust science operations in line with overall MOMA analytical objectives. One line of science scenario preparation is understanding what aspects of sample characteristics and preliminary mineralogy, as determined by other rover instruments, will be used to set initial MOMA parameters for LDMS or GCMS runs. Such settings are empirically based on laboratory data as well as rover mission data up to that point. Any follow-up analyses by MOMA on the same sample, such as selection of a particular type of chemical derivatization and GC column, would similarly depend on advance understanding based on analog and flight data.
The need for decision making preparation applies to non-optimal, unexpected, and/or anomalous situations as well as nominal operations. Given the few-hour turnaround for tactical decisions, to avoid the potential for loss of a sol MOMA is developing policies and procedures to determine the nature of the situation, and work in conjunction with the rover team to assess options, and to convey, through the MOMA PI and operations team, a recommended path forward, based on prior simulations and flight experience. Examples of such cases may include finding that less (or more) energy is available for a given MOMA run than planned, or more concerning, receiving anomalous data products (e.g., noise) or alarmed housekeeping values.
The above activities, carried out across the MOMA team, provide critical inputs to the planned Operational Readiness Reviews in mid-2022 and allow the MOMA investigation and the ExoMars mission to meet its higher-level goals.
- Goesmann F et al. (2017) Astrobiology 17:655-685. https://doi.org/10.1089/ast.2016.1551
- Siljeström S et al. (2021) Astrobiology. https://doi.org/10.1089/ast.2020.2368
How to cite: Brinckerhoff, W., Goesmann, F., Raulin, F., and Szopa, C.: Mars Organic Molecule Analyzer (MOMA) Flight Analog Activities in Preparation for ExoMars Surface Operations, Europlanet Science Congress 2021, online, 13–24 Sep 2021, EPSC2021-470, https://doi.org/10.5194/epsc2021-470, 2021.
Abstract
Finnish Meteorological Institute has delivered a pair of miniature meteorological instruments, METEO-P and METEO-H, for the ExoMars 2022 mission. The instruments are part of the METEO package, a set of scientific meteorological instruments included in the payload of the ExoMars 2022 surface platform. METEO-P/H will perform stationary and continuous measurements of the Martian atmospheric pressure and relative humidity.
1 Introduction
METEO-P and METEO-H constitute the latest pressure and relative humidity instrument pair developed by Finnish Meteorological Institute (FMI). The instruments have been built and delivered for the ExoMars 2022 mission of the European Space Agency (ESA) and Roscosmos [1]. METEO-P, a compact pressure instrument, continues FMI’s extensive history of providing pressure instruments for Mars landers. The core technology has heritage from a number of previous missions, such as Mars Phoenix, MSL Curiosity, ExoMars 2016 Schiaparelli and Mars 2020 Perseverance. The relative humidity instrument METEO-H is likewise based on a strong heritage from similar instruments delivered for Curiosity, Schiaparelli and Perseverance.
The instruments are part of the meteorological package METEO, led by the Russian Space Research Institute (IKI) [2]. METEO will operate on board the Russian-led surface platform Kazachok, taking part in the Entry, Descent and Landing of the ExoMars 2022 lander and providing scientific surface observations from a stationary location after landing. METEO-P is located inside the platform’s warm compartment together with the METEO Central Electronics Unit (CEU), while METEO-H is exposed to the ambient environment on top of the meteorological mast.
METEO-P and METEO-H protoflight models (PFM) and flight spares (FS) have been built and calibrated in FMI’s facilities. The FMI calibration laboratory has an in-house developed calibration system for simulating the Martian pressure and humidity environment. Furthermore, the METEO-H ground reference model has gone through testing campaigns in two other laboratories in order to obtain additional data for complementing the relative humidity calibration.
2 Instrument description
Both METEO-P and METEO-H use sensor and measurement technology by Vaisala Inc., Finland. The capacitive Barocap® pressure sensor contained in METEO-P is a micromachined silicon sensor optimized for the Martian pressure range. METEO-P consists of two pressure transducers, each with 8 measurement channels: 2-3 Barocap® channels, 2 capacitive Thermocap® temperature sensor channels and 3-4 reference channels with a constant capacitance. The measurements are controlled by Vaisala proprietary ASIC.

Figure 1: METEO-P pressure instrument protoflight model
METEO-H is based on Vaisala’s capacitive Humicap® sensor technology and the same ASIC as METEO-P. METEO-H has one humidity transducer with 2 Humicap® channels, 2 Thermocap® channels and 4 reference channels. Each of the Humicap® sensor chips include an integrated resistive PT1000 temperature sensor for obtaining the temperature near the sensor. Accurate temperature measurement is essential for the Humicap® calibration as the sensor is sensitive to temperature changes.
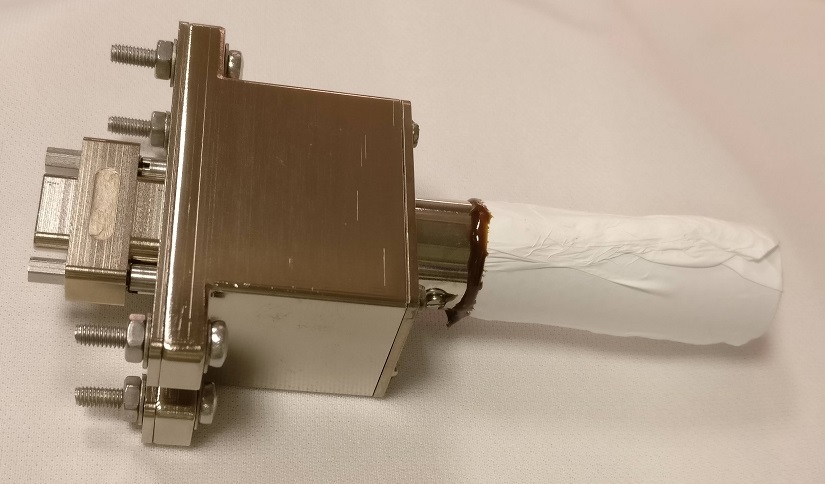
Figure 2: METEO-H humidity instrument protoflight model
Both instruments are controlled by an automotive microcontroller (MCU) integrated on the METEO-P board. The controller also handles the power distribution between the pressure and humidity transducers and collects the measurement data. METEO-H is connected to the controller through cabling, while an RS-422 serial interface allows the controller to communicate with the METEO CEU.
3 Calibration
The pressure calibration tests of METEO-P were performed in the FMI calibration laboratory. The PFM and FS were measured simultaneously in different constant temperature and pressure points within the temperature range of -45 to +55 °C and pressure range of 0 to 12 hPa. Measurements were also performed in changing temperature and pressure, as well as in high vacuum for obtaining the zero point. After integration to the METEO CEU, a thermal vacuum test was conducted by IKI, providing data for correcting calibration changes affected by the new environment. The final calibration correction will be obtained from measurement performed during the cruise phase prior to landing to compensate for possible calibration drift.
The relative humidity calibration is based on measurements performed for different models of METEO-H in three laboratories: the FMI calibration laboratory, Michigan Mars Environmental Chamber (MMEC) and DLR Planetary Analog Simulation Laboratory (PASLAB). The FMI calibration system is able to produce two humidity calibration points – dry (0%RH) and near saturation (95-100%RH) – in temperatures down to -70 °C in Martian pressure CO2. The dry points were measured in temperatures -70 to +22 °C and the saturation points in -70 to -40 °C. All tests at FMI were run simultaneously for METEO-H PFM, FS and the ground reference model.
The calibration was complemented after the delivery of METEO-H PFM by additional measurements for the identical ground reference model in DLR PASLAB. The resulting data set includes a number of calibration points over the full relative humidity scale in temperatures -70 to -30 °C and CO2 pressures 5.5 to 10 hPa. The calibration results are extrapolated to higher and lower temperatures to cover the entire expected operational range.
4 Conclusions
ExoMars 2022 is scheduled for launch during the launch window in 2022. Following the landing in 2023, METEO-P and METEO-H will make continuous pressure and humidity measurements on the surface of Mars. The past missions have provided valuable knowledge about the calibration and performance of the sensors, allowing this new instrument pair to continue the in-situ investigations of the Martian atmosphere. Currently FMI has two sets of operational pressure and humidity instruments on Mars, one on board the Curiosity rover and the other in the Perseverance rover. If both of these are still operational at the time of ExoMars 2022 landing, METEO-P/H will create the third observation point in the mini-network of FMI’s pressure and relative humidity sensors on Mars.
References
[1] Vago, J. et al.: ESA ExoMars program: The next step in exploring Mars. Sol Syst Res 49, 518-528 (2015).
[2] Rodionov, D. et al.: ExoMars-2020 Landing Platform scientific payload, EGU General Assembly 2020, Online, 4-8 May 2020, EGU2020-21128.
How to cite: Jaakonaho, I., Hieta, M., Genzer, M., Nikkanen, T., Meskanen, M., Polkko, J., and Harri, A.-M.: Calibration of METEO-P pressure and METEO-H relative humidity instruments for ExoMars 2022 surface platform, Europlanet Science Congress 2021, online, 13–24 Sep 2021, EPSC2021-505, https://doi.org/10.5194/epsc2021-505, 2021.
Introduction
The principal objective of Rosalind Franklin, the ExoMars Rover, is to look for evidence of past or present life on Mars. Such evidence would most likely remain in the subsurface, where organic molecules are protected from all kind of threats they could meet at the surface. For this reason, the ExoMars Rover mission has been optimized to investigate the subsurface to identify, understand, and sample those locations where conditions for the preservation of former past life are most likely to be found. The Water Ice Subsurface Deposit Observation on Mars (WISDOM) ground-penetrating radar has been designed to provide information about the nature of the shallow subsurface over depth ranging from 3 to 10 m (with a vertical resolution of up to 3 cm), depending on the ground’s dielectric properties.
WISDOM radargrams help to understand the geologic stratigraphy and structures of the subsurface, including potential ice formations. They provide important clues about the identification of optimal drilling sites for investigation and sampling by the Rover’s 2-m drill. WISDOM will also ensure the safety and success of drilling operations by detecting potential hazards that might damage the drill and jeopardize the retrieval of subsurface samples. The interpretation of these radargrams is a crucial point in the research process, and many tools are developed to analyse and understand all the data provided.
When the soil does not have any clear geological stratification or big reflectors such as buried stones, it can still provide information about its structure. The heterogeneity of the soil could reveal interesting mixed composition of two different materials, or with little structures too small to be detected by WISDOM. The objective of this study is to characterise the heterogeneities of the subsurface using different criteria.
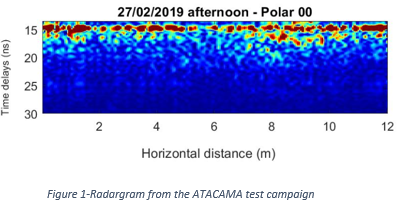
The ExoFit test campaign conducted in the Atacama Desert in 2019 revealed a subsurface showing very little evidence of structures, and the radargrams acquired there are particularly interesting to test and validate the method developed initially on simulated data.
Methods used
Simulation on TEMSI-FD
In order to work in a totally controlled environment, the data used for the methods development have been simulated by FDTD (Finite Differences in Time Domain). All the models are generated using the Diamond-Square algorithm [1] which allows to generate fractal structures simulating natural heterogeneities of a given size and dielectric contrast. It is a fast and efficient method for generating a heterogeneous environment on a volume of several m3. This FDTD simulation software is TEMSI-FD, developed by a team from the XLIM lab of Limoges and the simulation parameters were set by the work of Yann Herve [2] in order to get a simulation considering the actual waveform of the signal and the radiation pattern of the WISDOM antennas.
The two main variables parameters of the heterogeneous subsurface models are the size (L) of the heterogeneities and the mean dielectric constant (ε) with maximum contrast.
Bandwidth cutting
WISDOM has a large bandwidth (from 0.5 to 3 GHz) which allows the detection of different reflectors, with a high resolution. The wavelengths are related to these frequencies with the equation: λ = (c/√ε)/f with λ the wavelength, c the speed of light in vacuum, f the frequency and ε the dielectric constant. The heterogeneities in the subsurface produce volume scattering, with an intensity directly correlated to the ratio between the wavelength and the heterogeneity size. The division of the bandwidth in 2 to 5 ranges will provide different results and their analysis will allow the identification of the wavelength for which the level of scattering is the highest, hence the characterization of the typical size of the heterogeneities.
Sliding window and entropy
Another approach to characterize through the diffraction induced is to locally measure the entropy on the radargram. A sliding window is used to scan the whole radargram. [3]. The entropy is given by E(X) = ∑ni=1Pilog2Pi where Pi is the probability of amplitude level i occurrence among n (with n=256 for standard pictures) in the observed picture (X). The entropy gives a representation of the “disorder level” in the observed area, and helps to detect the zones with the highest level of heterogeneity. The window’s size will have an impact on the accuracy of the entropy detection and the resolution of the entropy picture obtained after the process. A good compromise will be selected depending on the size of the radargram and the targets.
Preliminary Results
The validation of the methods on simulated data before the automatization of the process and application to experimental WISDOM radargrams is an essential step. The bandwidth selection method has been applied to a simulation realised with TEMSI-FD, putting side by side zones of 1-meter width with increasing heterogeneities like figure 2.
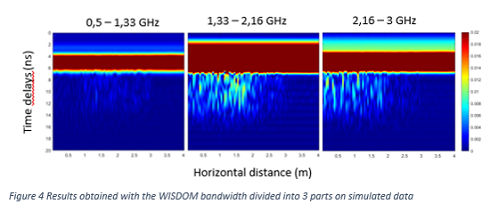
The results show that the heterogeneities around 8cm are especially diffracting for the middle bandwidth, which meets the expectations. A theoretical model will be implemented in order to find with precision the relation between the wavelength and the heterogeneity size.
The entropy calculation within a sliding window shows a good detection of the different zones, and can also be used to detect the heterogeneities of dielectric constant. On the other side, as the echoes amplitudes are decreasing with depth in the radargram, this method is expected to be more efficient in the near subsurface.
The preliminary results obtained on simulated data are very promising. On-going work is done to obtain a quantitative characterization of the subsurface even in absence of a clear layering.
References
[1] Miller, G. (1986). ACM SIGGRAPH Computer Graphics, volume 20.
[2] Herve, Y. (2018). Le radar WISDOM a bord du Rover de la mission ExoMars : Caracterisation et preparation du retour scientifique.
[3] HARALICK M. et al. (1973) Textural Features for Image Classification.
Ciarletti V. et al. (2017), ASTROBIOLOGY Volume 17, Num
How to cite: De Lamberterie, F.-W., Oudart, N., Ciarletti, V., Le Gall, A., and Hervé, Y.: Detection and characterisation of heterogeneities in the WISDOM/ExoMars 2022 radargrams., Europlanet Science Congress 2021, online, 13–24 Sep 2021, EPSC2021-478, https://doi.org/10.5194/epsc2021-478, 2021.
Introduction
WISDOM (Water Ice Subsurface Deposits Observation on Mars) will be the Ground Penetrating Radar of the Rosalind Franklin rover of the ExoMars 2022 mission. This rover will be the first able to collect samples down to 2 m in the Martian subsurface, and analyse them in search of potential traces of life [1]. Prior to any drilling operations, the WISDOM instrument will provide an insight into the shallow subsurface structure and composition, in order to guide the sample collection and understand its geological context [2].
In order to guide precisely the rover drill, an accurate estimation of the speed of electromagnetic waves in the subsurface is required to convert time delays of echoes from underground interfaces into distances. In the case of subsurface materials to be sounded by WISDOM, this speed is expected to be directly driven by their dielectric constants. Additionally, before drilling, subsurface hazards such as buried boulders must be detected by WISDOM to be avoided.
The automated interpretation chain we developed will be able to detect diffraction curves corresponding to potential subsurface hazards in WISDOM radargrams, and characterize the shape of these diffraction curves to estimate the dielectric constant of the subsurface, and therefore the depths of the hazards.
For most GPR radargrams operating on Earth, the antennas being directly coupled to the surface, the diffraction curves from point scatters are mathematically perfect hyperbolas (see Figure 1). In the case of WISDOM, the engineering constraints of the ExoMars mission imposed a distance of 38 cm between the bottom of the antennas and the Martian surface. In this air-coupled situation, with the refraction of electromagnetic waves at the surface, the diffraction curves are no longer perfect hyperbolas [3], and another model is required (see Figure 2).
As a consequence, we adapted the Hough transform that was already implemented to detect hyperbolas in GPR radargrams in ground-coupled situations [4], for the detection of diffraction curves in WISDOM radargrams. Promising preliminary results have been obtained on numerically simulated radargrams, and applications to experimental radargrams is ongoing.
Method
The Hough transform is a classic image processing technique, originally invented to detect lines in an image, and later adapted to the detection of any shape with an analytic definition, such as hyperbolas. The idea behind the detection of hyperbolas is the following one: any hyperbola can be defined by a unique triplet of parameters, or by any triplet of points in the hyperbola. For a hyperbola in ground-coupled GPR radargram, the 3 parameters are the horizontal position of the antennas X, the time delay at the apex of the hyperbolas T, and the dielectric constant of the subsurface 𝜀.
First a detection of echoes is applied to the radargram, to obtain a cloud of points with horizontal and vertical positions corresponding to the horizontal distance and time delays of these echoes. For every triplet of points in the radargram, the parameters (X, T, 𝜀) of the hyperbola passing through this triplet is calculated, and a 3D accumulator is incremented +1 at the position corresponding to (X, T, 𝜀). Maxima in the accumulator are expected to correspond to the hyperbolas present in the radargram.
To adapt the technique to WISDOM radargrams, where diffraction curves are not perfect hyperbolas, the presented “air-coupled” model had to be employed to determine a first estimate of parameters (X, T, 𝜀) of the diffraction curves corresponding to the different triplets of points. The equation presented in Figure 2 being far more complicated to analytically inverse than the equation of a hyperbola, an optimization technique (the Nelder-Mead algorithm [5]) is used.
Preliminary results
In order to validate the technique before its application to experimental WISDOM radargrams, different numerical simulations (with a Finite Difference in Time Domain code) have been performed on subsurface models with a selected homogeneous dielectric constant, and buried targets. The geometry of the antennas, and the equivalent time-domain signal emitted by the radar have been modelled for these simulations to be as representative as possible of the WISDOM radargrams.
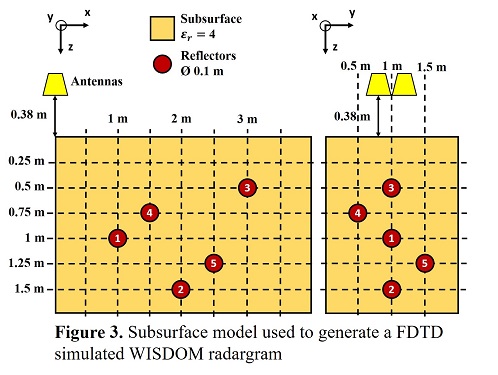
As an example, we show here a simulation generated for 5 underground targets in a subsurface of dielectric constant 4 (see Figure 3). In addition to the echoes detected in the simulated radargram, 500 parasitic points with random positions have been added to the cloud of points to which we applied the Hough transform (see Figure 4). The idea is to see if the implemented tool is able to detect diffraction curves among other echoes.
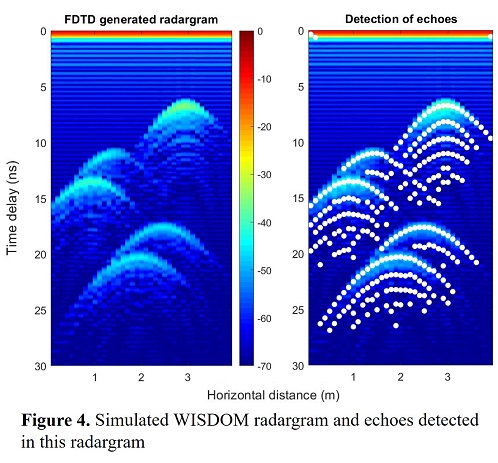
With the classic Hough transform (using the model presented in Figure 1), the estimated dielectric constants were 1.3, 1.8, 2.2, 1.9 and 2.3, leading to estimated depths of 0.88, 1.23, 1.47, 1.78, and 2 m, to be compared to the expected 0.50, 0.90, 1, 1.35, and 1.5 m. An over-estimation of the depth of a subsurface hazard could obviously be dangerous for the rover drill during the ExoMars 2022 mission.
After the application of the corrected Hough transform we implemented, the estimated dielectric constants are 4, 3.8, 3.8, 3.7 and 3.8 (much closer to the expected 4), and the estimated depths are now 0.50, 0.85, 1.04, 1.37 and 1.56 m (see Figure 5). The estimation is now accurate with error levels of only a few cm. This result validates the ability of the implemented technique to automatically detect diffraction curves in WISDOM radargrams, accurately estimate the dielectric constant of the associated subsurface material, and eventually estimate the depth of the associated reflector on Mars.
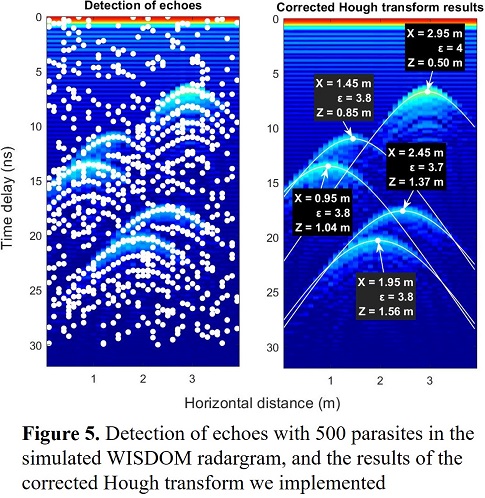
Will be presented the results of this interpretation tool applied to other simulations, some of them generated with more complex subsurface models (heterogeneous materials, two underground layers…), and eventually to experimental WISDOM radargrams where diffraction curves are visible.
References
[1] Vago et al., Astrobiology, 2018
[2] Ciarletti et al., Astrobiology, 2018
[3] Persico et al., Near Surface Geophysics, 2015
[4] Capineri et al., Imaging Systems and Technology, 1998
[5] Nelder and Mead, Computer Journal, 1965
How to cite: Oudart, N., Ciarletti, V., Le Gall, A., and Hervé, Y.: Automated detection and characterization of diffraction curves in WISDOM/ExoMars radargrams, Europlanet Science Congress 2021, online, 13–24 Sep 2021, EPSC2021-293, https://doi.org/10.5194/epsc2021-293, 2021.
The Martian Moon eXploration mission (MMX), currently developed by the Japan Aerospace Exploration (JAXA) will aim at studying Mars satellites and return samples from Phobos to decipher the history of the Martian system. MMX mission is to be launched in September 2024 and arrive in Mars system on August 2025, will stay three years in Quasi Satellite Orbits (QSO) around Phobos, and will land for several hours on Phobos to collect at least 10g of Phobos regolith before returning to Earth.
Among the mission instrument suite is the near-Infrared Spectrometer MIRS (MMX InfraRed Spectrometer) provided by CNES and built at LESIA-Paris Observatory in collaboration with four other French laboratories (LAB, LATMOS, LAM, IRAP-OMP) and in close collaboration with JAXA and MELCO. MIRS is an imaging spectrometer from 0.9 to 3.6 µm, with a spectral resolution better than 20 nm. The IFOV is 0.35 mrad and FOV of +/-1.65°. The SNR is higher than 100 up to 3.2 µm in a maximum integration time less than 2s. For Mars observation MIRS is expected to perform observations at 10 km spatial resolution, with a spectral radiometric absolute and relative accuracies of 10% and 1% respectively.
Given MIRS spectral range, expected Signal-to-Noise ratio, and observation windows, a certain numbers of high priority targets have been set to achieve MMX goal of Constrain transport processes for dust and water near the Martian Surface, continuous observations of the mid-to low-latitude distributions of dust storms, ice clouds and water vapor in the Martian atmosphere (Barucci et al. 2021, Ogohara et al. 2021), summarized in Table 1. Simulated spectra of Martian atmosphere as observed by MIRS are provided in Figure 1.
Table 1: List of MIRS main science targets for Mars observations (adapted from Barucci et al. 2021).
|
Target |
Parameters |
Spectral range |
|
Ice cloud formation and evolution |
Water ice |
1.5, 2 and 3 µm |
|
Dust clouds / storms formation and evolution |
Dust |
CO2 band @2.7 µm 0.9-3.6 µm continuum |
|
Water cycle |
H2O vapor |
2.6 µm |
|
Atmospheric dynamics and composition |
Surface pressure |
CO2 band @ 2.0 µm |
|
CO |
2.3 µm |
|
|
Limb observations for middle atmosphere |
O2 day-glow |
1.27 µm |
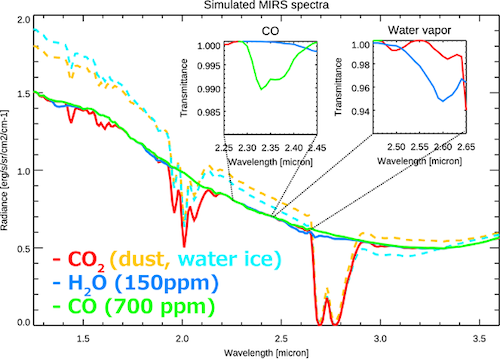
Figure 1: Simulated MIRS spectra for typical Mars observation (from Barucci et al. 2021). Plain curves correspond to clear sky conditions, and the dashed ones include the effects of dust or water ice clouds. For gases, CO2, CO, and water vapor are calculated separately and reported in red, orange, and blue curves, respectively.
MMX QSO around Phobos will result in a quasi-circular orbit around Mars with a period of ~7h, providing more than 3 hours window to Mars observation when Phobos observation is not possible. Several observation strategies, still in discussion, will be possible to maximize either temporal or spatial coverage of Mars and its atmosphere by MIRS. These strategies span from observations with a 30 minutes temporal resolution of a limited zone, to a complete coverage for low and mid latitude in a few orbits (Ogohara et al. 2021, Barucci et al. 2021). Limb observations may also be performed to obtain high vertical resolution observations of the Martian atmosphere.
MIRS observations will provide further constraints on dust and water transport processes in the Martian atmosphere, by monitoring the distributions of dust content and storms, water ice clouds and water vapor. CO2 (and thus pressure) will be monitored through the CO2 2.0 µm band. Water vapor will be monitored on a daily basis using its 2.6 µm band (Maltagliati et al. 2008) and water ice clouds through their spectral features between 0.9 and 3.6 µm (Olsen et al. 2019). MIRS should also be able to detect CO 2.35 µm and O2 at 1.27 µm. MIRS spectra will also allow for estimations of the water adsorbed in the surface regolith. Finally, MIRS will be operated in close collaboration with the OROCHI (Optical Radiometer composed of Chromatic Imagers) and TENGOO (Telescopic Narrow Angle Camera) instruments. This will enable efficient monitoring and reactivity to investigate short lifespan events in Martian atmosphere. This will also render possible the investigation of CO2 clouds following the procedure proposed by Vincendon et al. 2011 for Mars Express observations.
The reflectance spectrum from the light backscattered by atmospheric aerosols can be obtained by comparing successive observations of identical zones on Mars within a short time and with varying phase angles. Such a set of measurements permits to decorrelate the surface reflectance signal from the light scattered by the aerosols suspended in the atmosphere and gives information on the aerosols size and their composition properties averaged over the line of sight. Previous measurements showed a particle size distribution having an effective radius of 1.2±0.2 μm (Erard et al. 1994). The retrieved parameters include the scattering albedo, the phase function of the aerosols, the optical thickness, τ, of the atmosphere at the time of observation and the aerosols size distribution.
In summary, MIRS observations, together with the ones from MSA, OROCHI and TENGOO, will help better understand the interdependencies of species and their roles in the Martian water, CO2 and dust cycles, thanks to long term monitoring of these key constituents of Mars atmosphere.
References
Barucci et al. 2021, MIRS an Imaging Spectrometer for the MMX mission, accepted for publication in Earth Planets and Space
Erard, S., Mustard, J., Murchie, S., Bibring, J. P., Cerroni, P., & Coradini, A. (1994). Martian aerosols: Near-infrared spectral properties and effects on the observation of the surface. Icarus, 111(2), 317-337.
Ogohara et al. 2021, The Mars system revealed by the Martian Moons eXploration mission, accepted for publication in Earth Planets and Space
Vincendon et al. 2011, New near-IR observations of mesospheric CO2 and H2O clouds on Mars, JGR Planets 116, 0-02.
How to cite: Doressoundiram, A., Gautier, T., Barucci, M. A., Aoki, S., Lasue, J., Réess, J.-M., Bernardi, P., Le Du, M., Sawyer, E., Iwata, T., Nakagawa, H., and Nakamura, T. and the MIRS Team: Observation opportunities for Mars atmosphere with the MIRS instrument aboard the Martian Moon eXploration mission, Europlanet Science Congress 2021, online, 13–24 Sep 2021, EPSC2021-124, https://doi.org/10.5194/epsc2021-124, 2021.
ESA’s current Mars exploration programme consists of the flying orbiters Mars Express and the ExoMars TGO, while the ExoMars rover is planned for launch in 2022. The Nov 2019 ESA Council of Ministers meeting, Space19+, has approved ESA contributions to a Mars Sample Return Campaign, led by NASA, with a launch of the sample retrieval missions planned to occur as early as 2026.
The ExoMars and Mars Sample Return (MSR) missions will expand our understanding of Martian history, potential for life and environmental conditions. These missions will develop European technologies and capabilities to enable access to Mars orbit, Mars surface and shallow sub-surface as well as a round-trip journey. However, key strategic knowledge gaps will still remain for the human exploration of Mars following successful ExoMars and MSR missions. These include the understanding of the long-term behaviour of the atmosphere, wind profiles, dust properties and transport and origin of dust storms.
A study was undertaken in the Concurrent Design Facility (CDF) at ESA, ESTEC in order to address this important knowledge gap through a reference mission architecture that would be the first coordinated global, regional and local network of atmospheric science and weather stations at Mars. The reference launch date for the mission is in the early-mid 2030’s.
The selected mission architecture comprises several elements, including:
- A Low Mars Orbiter (LMO), in a high-inclination orbit;
- An Areosynchronous Orbiter (ASO) situated at the same longitude as the landers
- Four identical Mars landers comprising:
- 3 “local” landers in a triangular configuration situated 20km-150km apart
- 1 “regional” lander situated ~800km West of the local lander network
- Two carrier spacecraft each carrying two Mars landers from Earth to Mars atmospheric entry.
The primary science objectives focus on meteorology, wind and dust transport measurements from the orbital and landed assets. In addition, the landers also contain a radio science, seismology and heat flow payload suite to address secondary science objectives. Due to the scale of the mission and large number of sizeable mission elements, the architecture was spilt into a two-launch scenario where the first launch comprises the two orbiter spacecraft, and the second launch (in the next launch window opportunity) comprises the two carrier spacecraft each carrying two landers. Due to this large scope, the CDF study focussed on the design of the four Mars landers and the Areosynchronous orbiter, the definition of the science payloads, the overall concept of operations, cost and programmatics.
The study results show the technical feasibility of such a mission to be undertaken in the 2030’s at landing sites between 0°N and 20°N latitude whilst utilising existing European heritage in chemical propulsion Orbiters and ballistic Entry, Descent and Landing (EDL) technology. Challenges for the lander elements include the need for radioisotope heater units (RHUs), large solar arrays and energy-efficient platform and payload operations, all driven by the need to survive for multiple Mars years on the surface including science operations through potential global dust storms. Further work to refine the mission concept is planned.
Figure 1: Mars Long-Lived Weather Network Mission Architecture
Figure 2: Conceptual design of one of the four Mars landers showing the location of the science instruments
How to cite: Parfitt, C., McSweeney, A., Ball, A., Orgel, C., Svedhem, H., and Vijendran, S.: Mars Long-Lived Weather Network Mission Study, Europlanet Science Congress 2021, online, 13–24 Sep 2021, EPSC2021-52, https://doi.org/10.5194/epsc2021-52, 2021.
To date, Mars’s weather has been monitored mainly from spacecraft in polar or quasi-polar orbits, which sample only a narrow range of local times, or several local times over multiple sols with discontinuous spatial coverage (Fig.1). When observations have been made and/or analyzed at different local times, a high magnitude of diurnal variability often has been found [see e.g. 1 to 5]. The significance of diurnal meteorological variability at Mars argues for orbital observations that span the diurnal cycle. The rapid dynamics of meteorological phenomena such as dust storms (typical timescale of a few hours) and water/CO2 ice clouds (typical timescale of half an hour or less), together with their spatial extension (up to the planetary scale for dust events) and duration/repeatability, argues for continuous and simultaneous observations across the planet (Fig.1). As it happened for the study of meteorology on Earth in the 1970s, now is the right time to introduce monitoring to the observation paradigm for the martian atmosphere, so far almost exclusively focused on mapping.
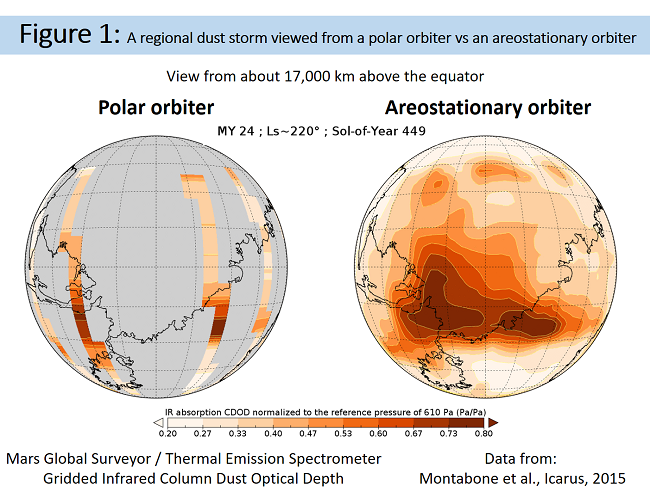
The Emirates Mars Mission (EMM), which entered Mars’s orbit in February 2021, is the first orbiter fully dedicated to the study of its climate. Thanks to its high, eccentric, low inclination orbit, it is also the first satellite that can reasonably observe the evolution of meteorological phenomena over multiple local times simultaneously, thus operating the transition from the mapping to the monitoring paradigm. Although unique so far, EMM alone cannot provide what has been identified as a high priority requirement to improve the spatiotemporal coverage of existing data and to enable future human exploration missions, i.e. global, continuous, and simultaneous monitoring, leading to forecasting of meteorological phenomena [6].
Quasi-global monitoring (excluding the polar regions) can be achieved by a constellation of areostationary platforms, i.e. satellites in equatorial, circular orbits in which the orbital period of the satellite matches the rotational period of Mars. The minimum number required for covering all equatorial longitudes is three [7]. The required number to cover all longitudes in a continuous latitude band extending from nearly 80°S to nearly 80°N with some large overlapping in longitude is four (Fig.2). If the areostationary constellation is coupled with at least one satellite in low polar orbit, the continuous (high cadence) and simultaneous (all locations at once) monitoring becomes nearly global [8].
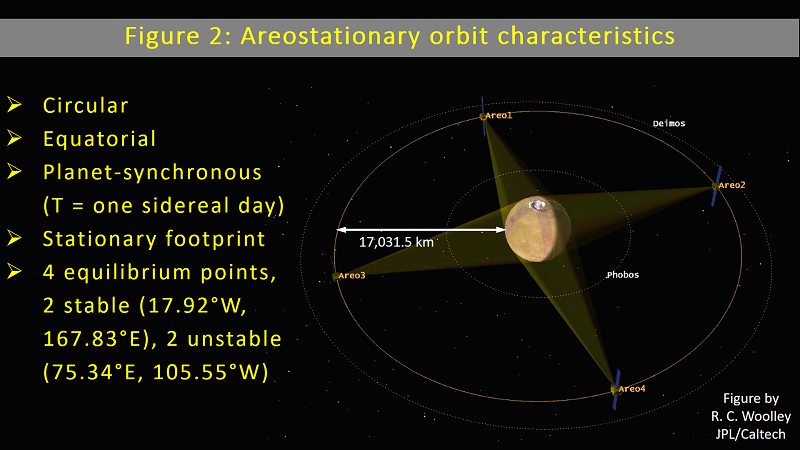
Areostationary observations would revolutionize Mars weather forecasting as geostationary satellite imagery did for Earth weather forecasting in the 1970s. The quasi-global, continuous, and simultaneous view that observations from an areostationary network provide would allow forecast initialization from atmospheric states that properly account for teleconnections, large-scale weather and dust events, tides, and other diurnally varying, global-scale phenomena (Fig. 3). Operational monitoring coupled to modelling will enable forecasting, allowing to take preventive actions and minimize risks. It will take several attempts to optimize an operational monitoring and forecasting system, primarily because extreme events such as dust storms attaining the planetary scale occur at irregular times. It is thus essential to send precursor missions aimed at developing the operative infrastructure well in advance of the first human mission.
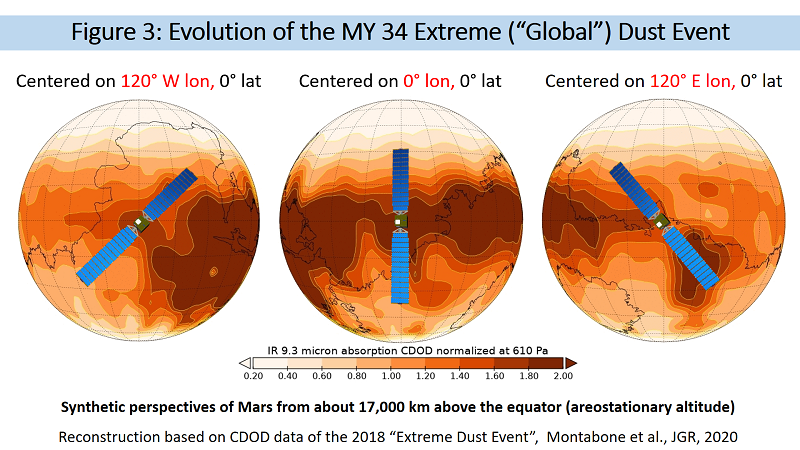
Areostationary platforms do not only offer advantages in meteorology. Satellites in areostationary orbit would spend nearly 75% of their time outside the bow shock of Mars, offering monitoring of the upstream solar wind at an unobstructed vantage point (Fig. 4). The high distance of an areostationary orbit from Mars could also allow for globally mapping the escape of atmospheric species in response to changes in upstream drivers, a task only partially fulfilled by EMM. Last but not the least, areostationary relay satellites could advance telecommunication capabilities for future robotic and human Mars missions far beyond current capabilities [9 to 11]. They are also ideal to support the communication requirements of a future generation of small, low-cost Mars science orbiters and be part of a Global Navigation Satellite System (GNSS), which would greatly improve mission safety and reliability for sustainable, long-term exploration [12]. See [7] for more information on the benefits and applications of satellites in areostationary orbit. Furthermore, the architecture of the constellation, and recent advancements on on-board computational capabilities, would enable significant degrees of autonomy, such as coordination of observations, event-driven operations, and goal-based monitoring.
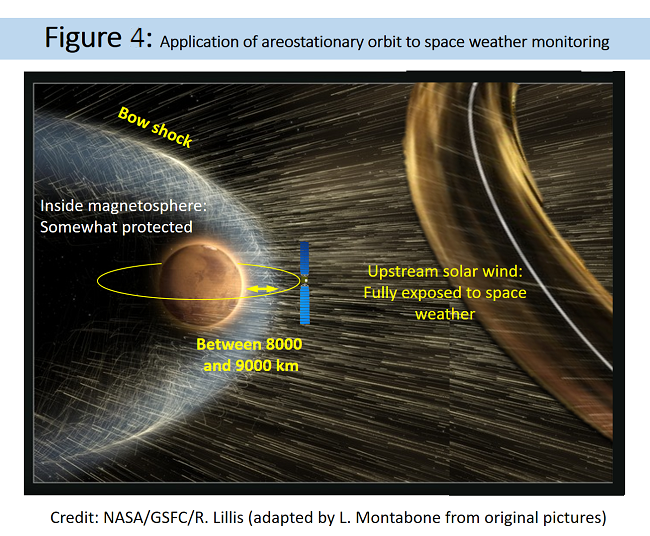
In order to fully shift paradigm from mapping to monitoring, therefore, we have developed a mission concept to send a constellation of at least three satellites in the second half of the current decade, place them in an areostationary orbit, and monitor atmospheric and space weather over the course of at least two Martian years. We name our concept MACAWS, which stands for "Monitoring Areostationary Constellation for Atmosphere and Weather in Space" (Fig. 5). The nature and objectives of this novel mission lend themselves to the use of SmallSats to reduce costs and accept higher risks, while maximizing impact. The scientific and operational achievements of this precursor mission will directly feed into the subsequent planning of larger-scale monitoring constellations.
The stated goal of MACAWS is to be a low-cost, precursor, orbital mission to monitor atmospheric and space weather events continuously and simultaneously at most locations on the planet and in the upstream solar wind, in preparation for the human exploration of Mars. The scientific payload, mission architecture, and ConOps are defined accordingly (Fig. 6). The planned outcomes are a better scientific understanding of the dynamics of such events, and the development of an operational forecasting system in order to reduce the risks for humans when in orbit around Mars or on the ground.
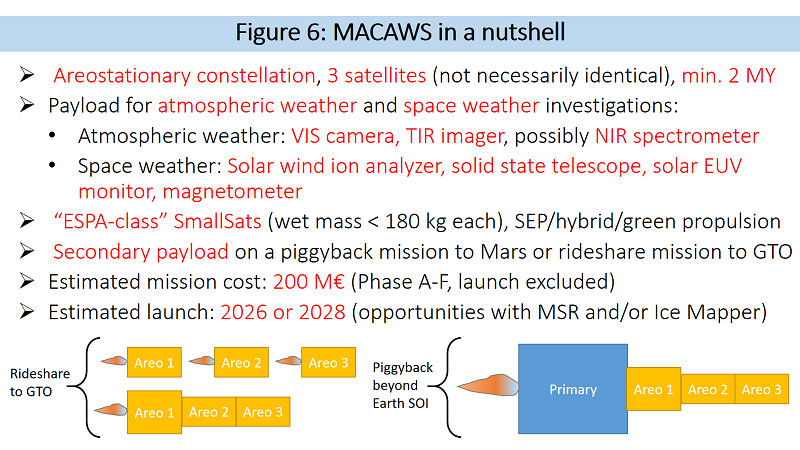
REFERENCES
[1] Glenar+ 2003 Icarus 161 297, https://doi.org/10.1016/S0019-1035(02)00046-5
[2] Zent+ 2016 JGR Plan. 121 626, https://doi.org/10.1002/2015JE004933
[3] Wolkenberg & Giuranna 2020 Icarus 113823, https://doi.org/10.1016/j.icarus.2020.113823
[4] Kleinboehl+ 2020 JGR Plan., e2019JE006115, https://doi.org/10.1029/2019JE006115
[5] Montabone+ 2020 JGR Plan., e2019JE006111, https://doi.org/10.1029/2019JE006111
[6] Banfield+ 2020 MEPAG Science Goals, https://mepag.jpl.nasa.gov/reports/MEPAGGoals_2020_MainText_Final.pdf
[7] Montabone+ 2020 White Paper PSA Decadal Survey, https://bitly.com/areowhitepaper
[8] Lillis+2021, Planet. Sci. J., in press
[9] Breidenthal+2018 SpaceOps Conf. 2426, https://doi.org/10.2514/6.2018-2426
[10] Edwards+2016 Proc. IEEE Aerosp. Conf., https://doi.org/10.1109/AERO.2016.7500680
[11] Lock+2016 Proc. IEEE Aerosp. Conf., https://doi.org/10.1109/AERO.2016.7500899
[12] Pirondini & Fernandez 2003 ESA Executive Summary, https://esamultimedia.esa.int/docs/Aurora/execsummaries/Interplanetary_GNSS.pdf
How to cite: Montabone, L., Capderou, M., Cardesin-Moinelo, A., Feruglio, L., Forget, F., Guerlet, S., Heavens, N., Lillis, R., Millour, E., Parfitt, C., Topputo, F., Vijendran, S., and Young, R.: A Paradigm Shift in Mars Meteorology: Towards Monitoring and Forecasting with Areostationary SmallSats, Europlanet Science Congress 2021, online, 13–24 Sep 2021, EPSC2021-625, https://doi.org/10.5194/epsc2021-625, 2021.
INTRODUCTION
Radio Occultation (RO) is a remote sensing technique that infers physical parameters of density, temperature, and pressure in the neutral atmosphere and electron density in the ionosphere based on the Doppler shift of radio signals [1]–[3]. It provides high vertical resolution and is insensitive to aerosols. RO can fill in a number of existing observational gaps gaps in the Martian atmosphere that have been emphasized by the science community [5].Traditionally, RO is accomplished via a link between the orbiting spacecraft and the Deep Space Network (DSN) [2]–[4]. However, the spacecraft-to-DSN link limits the viewing geometry and overall coverage. A dedicated fleet of Smallsats offers a low-cost solution to yield an unprecedented number of RO profiles to achieve high temporal and spatial coverage, which can significantly augment existing and future Mars missions. In particular, the constellation can support and augment atmospheric observations required in Entry, Descent and Landing (EDL) and Ascent from the Surface (AST) operations.
MISSION CONCEPT
Preliminary requirements for the mission identify a minimum number of 100 RO observations per day globally, temperature uncertainty of 1 K between 6-12 km altitude, and number density uncertainty in the ionosphere of 5%. The mission concept proposed utilizes a fleet of 6 smallsats in high inclination orbits to maximize the number of global observations per day. The ideal orbital configurations were simulated using the Systems ToolKit (STK). The configuration which allows for ~200 RO observations per day consists of inner (300 km) and outer (2,400 km) 3/3/1 Walker orbits at 87° inclination (Figure 1).
RO APPROACH AND EXPECTED PERFORMANCE
A dual frequency one way approach is implemented for the RO observations [3]. A relationship exists between refractivity, pressure, and temperature in the neutral atmosphere, radio frequency and electron number density in the ionosphere [4]. Using a linear combination of X and UHF bands, the ionosphere and neutral atmosphere components can be effectively separated. The vertical resolution is determined based on the orbital velocity data from STK. We simulated the link and retrieval performance considering the expected thermal noise of the communications system, and clock noise of the ultra-stable oscillator (USO) based on commercial off the shelf (COTS) parts. Converting bending angle profiles to refractivity and finally pressure and temperature, we find that USO performance with Allan deviations on the order of 10-13 s/s meet the requirements of 1 K temperate uncertainty between 6-12 km altitude above the surface and < 5% error in the ionosphere. Future work will consider an alternative approach to RO observations via a dual one-way method which employs only a single radio band transmitting and receiving at slight offset frequencies. This approach will allow for the implementation of a less stable USO without increasing the clock noise.
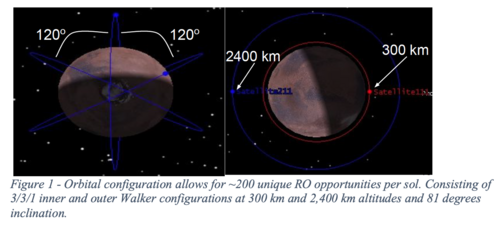
References: [1]D. P. Hinson et al. (2014) Icarus 243, doi: 10.1016/j.icarus.2014.09.019. [2] M. F. Vogt et al. (2016) J. Geophys. Res. Space Physics 121, , doi: 10.1002/2016JA022987. [3] P. Withers (200) Advances in Space Research 46(1) doi: 10.1016/j.asr.2010.03.004. [4]G. A. Hajj, E. R. Kursinski, L. J. Romans, W. I. Bertiger, and S. S. Leroy, (2002) Journal of Atmospheric and Solar-Terrestrial Physics 64 (4) , doi: 10.1016/S1364-6826(01)00114-6. [5] D. Banfield (2020) MEPAG Goals Document.
How to cite: Sweeney, D., Ao, C., Vergados, P., Rennó, N., Kass, D., and Martínez, G.: A Mars Smallsat Radio Occultation Mission Concept for Addressing High-Priority Mars Science and Exploration , Europlanet Science Congress 2021, online, 13–24 Sep 2021, EPSC2021-401, https://doi.org/10.5194/epsc2021-401, 2021.
ABSTRACT
This work will calculate the power generated by static solar panels at different elevation angles as a function of location and solar longitude on Mars. The generated power at each latitude will then be compared to the theoretical maximum extractable power from active sun-tracking panels. Solar energy from 200 nm to 2000 nm will be considered using a radiative transfer code that includes atmospheric scattering and gaseous absorption. The results of this analysis will provide information for the optimization of energy generation on future solar-powered Mars surface missions.
1. INTRODUCTION
The optimization of solar power generation on Mars is important for the planning of future surface missions. Given the low wind and lack of geothermal energy on the surface of Mars, solar radiation is the optimal renewable energy source for use on the surface. Difficulty of transport caused by mass budgets and engineering concerns make traditional fuels a poor choice for use on surface missions. While recent missions have been effectively powered by radioisotope thermoelectric generators, solar power is an option which does not depend on the extremely limited available supply of Pu-238 while also providing a longer lasting stable power source for long duration missions. Our research aims to determine the optimal angular position of static solar panels for various latitudes and compare the loss in available energy compared to using a more complex sun-tracking panel. This will be accomplished using a 1-dimensional radiative transfer model for solar radiation entering the Martian atmosphere at all combinations of latitude and solar position. Since a previous analysis of solar energy available for use carried out in Delgado-Bonal et al. (2016) concluded that solar panel effectiveness is dominated by incoming solar radiation rather than environmental factors such as temperature differentials, determining optimal solar panel placement is the an important aspect of maximizing available energy for future solar-powered Mars missions. This work will provide currently unavailable data on extractable solar energy for non-horizontal panels at any given location on Mars, allowing power generation to be considered alongside science value during mission site selection.
2. METHODS
We employ the 1-dimensional radiative transfer model previously developed by Moores, Smith and Schuerger (2017) and Smith and Moores (2020) to calculate available solar radiation fluxes at the Martian surface. This model builds upon the doubling and adding code of Griffith et al. (2012), having extended wavelength ranges and absorption parameters adapted to the Martian atmosphere. The model considers radiation from both the sky and surface reflections to compute a full hemispherical angular grid of radiances. Fluxes were calculated for wavelengths from 200nm to 2000nm, which account for approximately 93% of the inbound solar flux. Wavelengths below 200nm experience extremely high CO2 absorption and wavelengths longer than 2000nm only account for 6.2% of total solar energy, making these limits an effective choice for computational efficiency (Smith and Moores, 2020). The model includes Rayleigh scattering for the major atmospheric components CO2, N2, Ar, and O2 alongside absorption from CO2 and O2. Absorption for wavelengths outside of 400-1000nm for CO2 and 650-880nm for O2 were ignored due to negligible contributions (Smith and Moores, 2020). Mie scattering from aerosols was considered across the entire wavelength range, with aerosols modelled as cylindrical particles and the Martian surface modelled as a Hapke surface (Smith and Moores, 2020). Outputs integrated across the whole sky are used to determine the available solar energy as a function of Martian latitude and solar longitude.
Directional dependence of solar energy will be calculated from sky and ground radiance map outputs of the radiative transfer model. Calculations will first be performed for a static panel at a variety of angles from the horizontal receiving energy from portions of the sky within its line of sight along with reflections from the surface. Topography will be ignored due to the large variance in possible landing sites. Solar flux data will then be adjusted for solar panel efficiencies at each wavelength band in the 200-2000nm range to determine total available energy. Once static panel calculations are complete, a sun-tracking panel with elevation angle always equal to that of the sun will be tested. Optimal static angles for a given latitude will then be compared to the sun-tracking results.
3. RESULTS AND DISCUSSION
Currently the horizontal panel total solar flux has been calculated and work is under way to model directional dependence of the flux. Once completed, this work will provide direction as to both the best positioning of solar panels and the gains provided by upgrading to a sun-tracking solar panel. The benefit of the active solar panel can then be weighed against engineering and mass budget costs in the planning of future Mars missions. Since the results will be computed across the entirety of the planet, available energy data will be usable during initial site selection for missions instead of requiring a site-specific analysis after selection. This will be particularly relevant for missions seeking to use solar panels at latitudes far from the equator where horizontal solar panels are much less effective, such as would be the case for small Martian meteorological stations.
REFERENCES
1. C. L. Smith, J. E. Moores, Icarus. 338, 113497 (2020).
2. C. A. Griffith et al., Icarus. 218, 975–988 (2012).
3. A. Delgado-Bonal et al., Energy. 102, 550–558 (2016).
4. J. E. Moores, C. L. Smith, A. C. Schuerger, Planetary and Space Science. 147, 48–60 (2017).
How to cite: Kerr, J., Smith, C., and Moores, J.: Optimal solar panel positioning on the surface of Mars, Europlanet Science Congress 2021, online, 13–24 Sep 2021, EPSC2021-369, https://doi.org/10.5194/epsc2021-369, 2021.
Please decide on your access
Please use the buttons below to download the presentation materials or to visit the external website where the presentation is linked. Regarding the external link, please note that Copernicus Meetings cannot accept any liability for the content and the website you will visit.
Forward to presentation link
You are going to open an external link to the presentation as indicated by the authors. Copernicus Meetings cannot accept any liability for the content and the website you will visit.
We are sorry, but presentations are only available for users who registered for the conference. Thank you.
Please decide on your access
Please use the buttons below to download the presentation materials or to visit the external website where the presentation is linked. Regarding the external link, please note that Copernicus Meetings cannot accept any liability for the content and the website you will visit.
Forward to session asset
You are going to open an external link to the asset as indicated by the session. Copernicus Meetings cannot accept any liability for the content and the website you will visit.
We are sorry, but presentations are only available for users who registered for the conference. Thank you.

