
Synthetic Analogs for the Surface of Mercury: FTIR Studies of Smooth Plains Analogs
 1,5,6
1,5,6- 1WWU Münster, Institut für Planetologie, Münster, Germany (morlok70@mac.com)
- 2University of Liege, Department of Geology, 4000 Sart-Tilman, Belgium
- 3Institut für Mineralogie, Corrensstrasse 24, 48149 Münster
- 4Department of Earth and Environmental Sciences, KU Leuven, 3001 Leuven
- 5INAF-Istituto di Astrofisica e Planetologia Spaziali, Via del Fosso del Cavaliere, 100, I-00133 Rome
- 6Institute for Planetary Research, DLR, Rutherfordstrasse 2, 12489 Berlin, Germany
Introduction: The IRIS (Infrared and Raman for Interplanetary Spectroscopy) laboratory at the Institut für Planetologie in Münster produces a database of mid-infrared spectra for the ESA/JAXA BepiColombo mission to Mercury. The MERTIS (Mercury Radiometer and Thermal Infrared Spectrometer) instrument onboard the BepiColombo Mercury Planetary Orbiter allows mapping spectral features in the 7-14 µm range, with a spatial resolution of about 500 meters [1,2].
In addition to a variety of natural terrestrial and meteoritic materials for the comparison of the expected results, we started using synthetic analogues based on the chemical composition of Mercury measured by MESSENGER. This allows to produce infrared spectra of bodies from which no material as returned samples or meteorites is available so far [3-5]. Advanced modelling based on the chemistry of Mercurian lavas and high-temperature experiments to simulate the mantle formation and the crystallization of lavas at the surface resulted in prediction for modal mineral compositions for distinct surface regions [6-8]. This allows to produce synthetic mixtures of minerals and glass representative for these hermean regions.
Samples & Techniques: For the first round of mixing studies of powdered samples, sample compositions were selected from modal compositions based on experiments covering the dominant mineralogically diverse, 3.6–3.5 Gyr old volcanic smooth plains regions on Mercury [6,7]. The experimental conditions (for details see [7,8]) were temperatures between 1170-1360°C and highly reducing conditions (ΔIW of -4.9 to -6.2). Of the run products described in [7], we picked modal compositions covering a wide range of phase compositions, ranging from pure glass to the most crystalline composition modelled (crystalline content from 9-58 wt%).
The analogues were prepared using mixtures of synthetic glass material based on hermean compositions [7-9] and natural crystalline forsterite, enstatite, diopside and plagioclase, with compositions in the range that was observed in the petrological experiments [7]. All materials were sieved into 4 size fractions before (0-25 µm, 25-63 µm, 63-125 µm, 125-250 µm), and the analogue mixtures composed directly from the size fractions.
Diffuse reflectance mid-infrared spectra were made with a Bruker Vertex 70 infrared system using a Cooled MCT detector. Analyses of the powders were made at low pressure (10-3bar) to reduce atmospheric bands from 2-20 µm. For calibration, a diffuse gold standard was used for ratioing, to guarantee low noise, we integrated 512 scans for each spectrum. Spectral features of interest are the Christiansen Feature (CF), a characteristic reflectance low that also serves as proxy for the bulk composition; the Transparency Feature (TF), typical and indicator for the finest grain size fraction (0-25 µm); and the Reststrahlen Bands (RBs), the molecular vibration modes.
Results: In the range of interest for MERTIS (7-14 µm), the entirely glassy end member shows a simple spectrum with a strong RB at 9.6 µm, a CF at 7.9 µm and the TF at 11.77 µm [4]. Increased crystalline content (9 wt% forsterite, 91 wt% glass) in sample ID 345 Smooth Plains has two RB appearing at 9.6 µm and 10.5-10.6 µm, and a weaker RB at 10.2 µm. The CF is at 7.9-8 µm, the TF at ~11.7 µm.
Sample ID 344 Smooth Plains contains several crystalline species (5 wt% forsterite, 2 wt% diopside, 28 wt% plagioclase and 11 wt% enstatite). This results in a feature-rich spectrum, with RBs at 9.5 µm, 9.9 µm, 10.2 µm, 10.5 µm, 10.8 µm, 11.1 µm and 11.3-114 µm. The CF is found at 7.8-7.9 µm, the TF is at 11.7 µm.
The crystalline-rich end member ID 343 Smooth Plains has only 42 wt% glass components with 6 wt% forsterite, 11 wt% diopside, 34 wt% plagioclase and 7 wt% enstatite. RBs are seen at 9.4 – 9.6 µm, 9.9 µm, 10.2 µm, 10.5 µm, 10.8 µm and 11.3 µm. The TF is at 11.6 µm, the CF at 7.9 - 8 µm.
Discussion: Spectra show increasing RB features with decreasing content of glass (Fig.1). However, a comparison of the finest size fractions (0-25 µm) (Fig.2) of the 4 samples shows astonishingly similar spectra, basically the smooth glass spectra of with relatively weak RB on top, with the spectrum dominated by the TF. This could make distinguishing of such spectra of a continuum of similar composition difficult.
Contrasts between the spectra are stronger at the larger grain size fractions (>25µm), where the RB features are stronger. Variations in band intensities between the different samples – particular the high intensity of the ID 344 Smooth Plains spectrum – could be results of a highly reflective component (Enstatite?) or indicator of insufficient mixing of the phases.
Summary & Conclusions: We will continue by mixing further samples based on the hermean surface models and experiments [7], with the aim to have series of samples representative for each of the terranes. Future spectral unmixing models will test if the individual mineral components can be extracted by modelling form the spectra.
References: [1] Benkhoff J. et al. (2020) Planetary and Space Science 58, 2-20 [2] Hiesinger H. et al. (2020) Planetary and Space Science 58, 144–165 [3] Morlok et al. (2020) Icarus 335, 113410 [4] Morlok et al. (2019) Icarus 324, 86-103 [5] Weber et al. (2020) Earth and Planetary Science Letters 530, 115884 [6] Weider S.Z. et al. (2015) Earth and Planetary Science Letters 416, 109-120 [7] Namur and Charlier (2017) Nature Geoscience 10, 9-15 [8] Namur O. et al. (2016) Earth and Planetary Science Letters 448, 102-114 [9] Nittler L.R. et al. (2018) Mercury: The View after MESSENGER. Cambridge University Press, Cambridge, pp. 30-51.
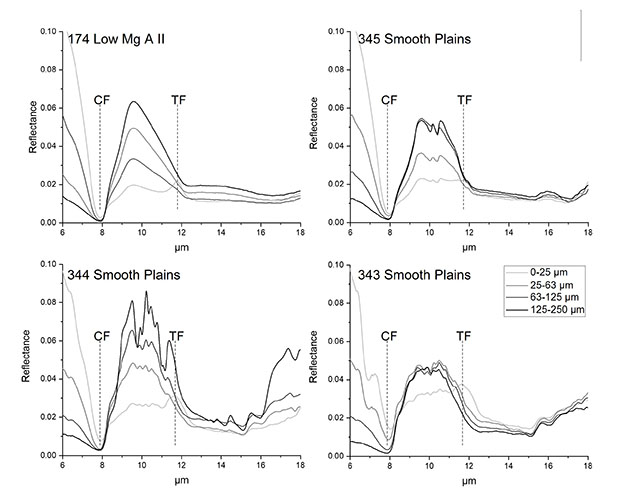
Figure 1. Mid-infrared diffuse reflectance spectra of 4 size fractions. CF: Christiansen Feature, TF: Transparency Feature.

Figure 2. Mid-infrared diffuse reflectance spectra of the 0-25 µm size fractions.
How to cite: Andreas, M., Charlier, B., Renggli, C., Klemme, S., Namur, O., Weber, I., Stojic, A. N., Reitze, M. P., Bauch, K. E., Schmedemann, N., Carli, C., Hiesinger, H., and Helbert, J.: Synthetic Analogs for the Surface of Mercury: FTIR Studies of Smooth Plains Analogs, Europlanet Science Congress 2021, online, 13–24 Sep 2021, EPSC2021-294, https://doi.org/10.5194/epsc2021-294, 2021.