Detailed structural mapping of the Tempe Terra region, Mars
- 1Institute of Applied Geoscience, School of Earth and Environment, University of Leeds, UK (eecjo@leeds.ac.uk)
- 2Institute of Geophysics and Tectonics, School of Earth and Environment, University of Leeds, UK
- 3Planetary Research Group, Department of Marine, Earth, and Atmospheric Sciences, North Carolina State University, USA
Introduction
The structurally complex region of Tempe Terra, at the north-eastern edge of the Tharsis Rise, is of substantial interest for understanding the tectonic history of Tharsis, and Mars more broadly. Tempe Terra is a plateau consisting largely of Noachian to Hesperian volcanic and highland units [1], and it preserves evidence of tectonic activity across the lifespan of the Tharsis complex, from faulting of ancient Noachian crust to volcanic and tectonic activity through the Amazonian [2]. Fundamental work on the structural evolution of Tempe Terra [e.g. 2–5] was done with Viking Orbiter imagery and the 1986 geological map of Scott and Tanaka [6]. But in light of revised geological unit ages [1] and the higher-resolution image data now available, that structural evolution requires revisiting.
We present an updated inventory of structures in the Tempe Terra region, based on interpretation of recent, high resolution data. We utilised a detailed mapping approach at a regional scale to capture the area’s full tectonic complexity. Our work includes qualitative analysis of the regional structural trends, revised groupings and chronologies of constituent tectonic structures, and statistical characterisation of the fault populations present. First analysis shows that the total population of fault lengths is best described by a lognormal distribution, potentially indicating the impact of geological layering on development of the system. This work will lead to a revised structural history and assessment of stress regime evolution for Tempe Terra.
Methods
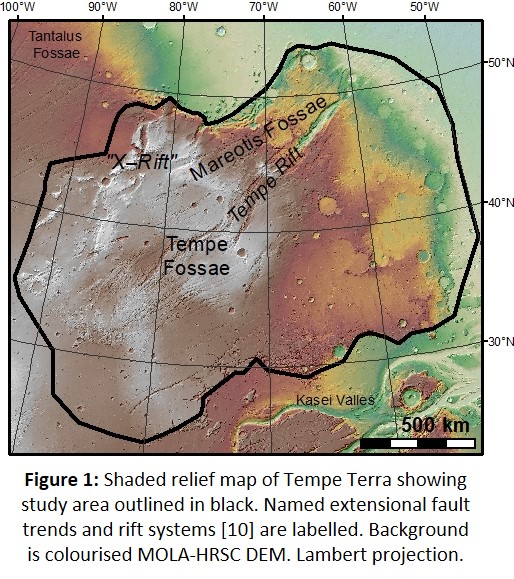
We undertook photogeological mapping at a scale of 1:300,000 across a study area 2.3 million km2 in extent (Fig. 1), primarily using High Resolution Stereo Camera (HRSC) images (of resolution 12–25 m/pixel, Mars Express). Thermal Emission Imaging System (THEMIS) image mosaics (at 100 m/pixel, Mars Odyssey) were used to aid mapping interpretation in areas of poor HRSC data quality. The focus of the mapping was normal faults, although other features including pit crater chains, wrinkle ridges, and chasms were also identified (but are not further discussed here). We mapped faults in a direction consistent with the right-hand rule for fault dip (i.e. 45° strike for a SE-dipping fault, 225° strike for a NW-dipping fault). Faults were grouped into sets, taking into consideration their orientation, morphology, crosscutting relations, absolute model age from associated geological units, and genetic relations (e.g. circumferential faults around volcanic centres). Erosional processes have affected existing structures at the plateau edges to the north and south, making some landforms ambiguous and their interpretation challenging.
Each mapped fault was assigned values for strike, length, and inferred dip direction (taken as 90° to the right of the fault strike), to help quantitatively characterise each fault set. We also assessed fault scaling properties by comparing functions for the cumulative frequency distribution of fault lengths with the Maximum Likelihood Estimators (MLE) function of the FracPaQ toolkit in MATLAB [7, 8]. Such analyses can help establish the mechanical properties of faulted rock, with power-law (fractal) distributions of fault lengths commonly described for deeply penetrating structures, and exponential distributions for faults in a brittle layer of restricted thickness [9].

Results
We mapped ~27,000 faults across the study area, allowing for detailed characterisation of the structural complexity of Tempe Terra. The dominant regional fault orientations are NE to ENE (Fig. 2), broadly similar to the long-recognised Tempe Fossae and Mareotis Fossae fault systems (Fig. 1), respectively [6]. We classified the total fault population we mapped into 20 separate fault sets, some of which are regionally extensive whereas others are locally confined. The bulk of extensional structures are concentrated through the centre of the region in a wide NE-trending zone; with few faults visible to the south-west, where crustal shortening structures (dominantly wrinkle ridges) are the principal feature, and to the north-west, likely because of burial by more recent lava flows.
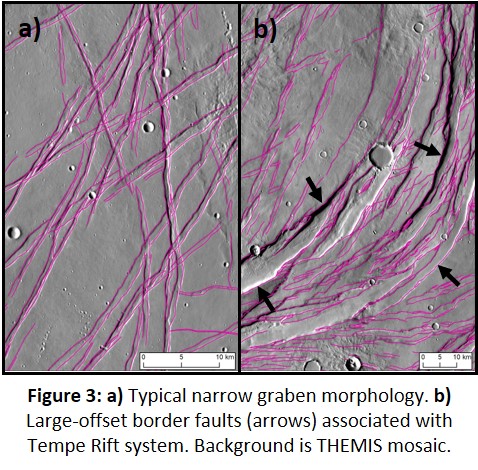
Normal faults across Tempe Terra occur as clearly defined graben (Fig. 3a), which are typically long and narrow (1–2 km wide on average), with segmented bounding faults. The exception to this trend is extensional faulting associated with the Tempe Rift and ‘X-Rift’ systems (Fig. 1, [10]), which in places form wider and deeper rift graben with multiple larger-offset (up to 3 km throw) border faults linked by relay ramps (Fig. 3b). This dominance of full-graben geometry across the region is also reflected by the bimodal distribution of fault orientations.

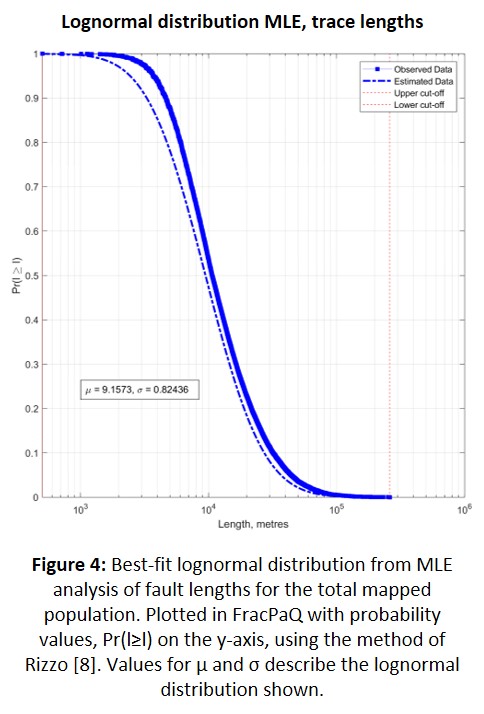
Mapped fault lengths range from 800 m to 202 km, although only 34% of the faults are ≥10 km long. MLE analysis of all fault lengths indicates the total population is not well described by an exponential distribution, nor by a power-law distribution without significant truncation of the small size fraction of the data. The best fit is a lognormal distribution (Fig. 4), which indicates either a truncated power-law population with underrepresentation of very small faults due to mapping resolution bias, or a true representation of the system with the observed length scale resulting from geological layering [9, 11].

Summary
Detailed fault mapping has allowed us to begin to characterise the full complexity of structures at, and geological evolution of, Tempe Terra. Ongoing analysis will lead to a new, comprehensive understanding of the history of this region, including an assessment of how regional and local stress regimes have evolved and interacted through time.
References
[1] Tanaka K.L. et al. (2014) USGS Scientific Investigtions Map 3292.
[2] Scott D.H and Dohm J.M. (1990) LPSC XX pp. 503-513.
[3] Fernández C. and Anguita F. (2007) JGR: Planets Vol 112(E9).
[4] Golombek M. et al. (1996) JGR: Planets Vol 101(E11) pp. 26119-26130.
[5] Hauber E. and Kronberg P. (2001) JGR: Planets Vol 106(E9) pp. 20.587-20602.
[6] Scott D.H. and Tanaka K.L. (1986) USGS I-Map 1802-A.
[7] Healy D. et al. (2017) JSG Vol 95 pp. 1-16.
[8] Rizzo R.E. et. Al. (2017) JSG Vol 95 pp. 17-31.
[9] Schultz R.A. et al. (2010) JSG Vol 32(6) pp. 855-875.
[10] Hauber E. et al. (2010) EPSL Vol 294 pp. 393-410.
[11] Bonnet E. et al. (2001) Reviews of Geophysics Vol 39(3) pp. 347-383.
How to cite: Orlov, C., Bramham, E., Thomas, M., Byrne, P. K., Mortimer, E., and Piazolo, S.: Detailed structural mapping of the Tempe Terra region, Mars, European Planetary Science Congress 2021, online, 13–24 Sep 2021, EPSC2021-315, https://doi.org/10.5194/epsc2021-315, 2021.

