
Billion-year trends in the aridity of river-forming climates on Mars

- University of Chicago, Geophysical Sciences, Chicago, United States of America (kite@uchicago.edu)
Summary. We analyzed a global database of constraints on Mars paleolake size relative to topographic catchment area (aridity index) and found evidence for climate zonation during the late-stage river-forming climates. Aridity increased over time in southern midlatitudes, but wetter climates (semiarid to arid) persisted near the equator and in the northern midlatitudes.
1. Introduction. Mars’ geology records multiple eras of precipitation-fed water runoff (e.g. [1,2]). Regionally integrated Valley Networks (VNs) formed early, ~3.6 Ga. Later, river-forming climates created deltas and alluvial fans up to 1.1 km thick [3,4]. This late-stage river-forming era consisted of multiple, intermittent, river-forming climates [5]. Within craters, most of the fluvial sediment transport was driven by runoff from crater sidewalls. Crater-lake levels could also have been maintained by water conveyed from crater sidewalls (by overland flow or shallow groundwater flow) or alternatively, by deep sourced groundwater sourced from rain/melt recharge at ~102-103-km scales.
2. Results. To constrain late-stage river-forming climates, we carried out a global survey within large, young impact craters (n = 212; from [6]) for geologic constraints on crater lake size (i.e., aridity index) and lifetime. Survey results (Figs. 1-4) disfavor the hypothesis that late-stage lakes were caused by individually brief (<10 yr duration) wet events (for example, driven by impact kinetic energy). For example, we found 12 prefluvial/synfluvial impact craters. To accumulate so many prefluvial/synfluvial craters would have required ≥0.2 Gyr. 0.2 Gyr is far too long for river formation by localized impact-induced effects (consistent with [5]). We also surveyed constraints on late-stage lake area, A, and topographic catchment area, D (finding n = 118 basins with useful constraints). To constrain paleolake area A, we used flat crater-bottom deposits matching expectations for lake deposits, as well as the elevations of the following features: alluvial fan toes, scarp-fronted deposits interpreted as deltas, and channel-stop elevations, internal spillways, and a candidate shoreline. D/A – 1 (equal to the hydrologic X-ratio, XH ) is approximately equal in closed-basin hydrological steady state to the Aridity Index (AI) (ratio of potential evaporation to water discharge, neglecting runoff production on the lake and net of infiltration) [7,8]. Low XH corresponds to relatively large lakes and a wetter climate. If wet climates were brief, then because small sinks fill quicker than big sinks, XH should be higher for bigger craters (XH ∝ Rcrater2/3). To the contrary, our data indicate lower XH for bigger craters (Fig. 2a), with XH < 10 found mainly in large craters. This disfavors the scenario in which late-stage river-forming climates were powered by the greenhouse forcing from a single volcanic eruption, or the energy of a distant impact. Our results provide additional support for the inference (e.g., [3]) that an arid but essentially Earth-like hydrologic cycle fueled late-stage rivers.
Our aridity analysis shows that late-stage XH < 10 is less common S of 10°S (Fig. 2). This late-stage climate zonation might be caused by the effect on the global circulation and/or water cycle of latitudinal gradients in elevation. Elevation control on late-stage river abundance is consistent with elevation control on paleolake levels and on climate zonation. Climate zonation helps to understand the changes over Gyr timescales (that are revealed by our database) in the aridity index of paleolake basins. For early-stage Valley-Network era (~3.6 Ga), the typical XH reported lakes is XH,ancient = 5±2 ([7]; consistent with ref. [8]; but see also [9]). Late-stage XH was 7-38 (median fan toe constraint to median lake deposit constraint), corresponding to arid-to-hyperarid conditions, with deltas and overspill channels recording semi-arid conditions (median XH=4). These data indicate a climate trend, to more arid climate (our preferred explanation), or alternatively toward briefer wet events (not ruled out by our data), on global average. This global trend can be decomposed, taking account of climate zonation, into a shift where southern midlatitudes show a shift towards smaller lakes over time, but intermittent wet climates (semiarid to arid) persisted in the equatorial region and the northern midlatitudes.
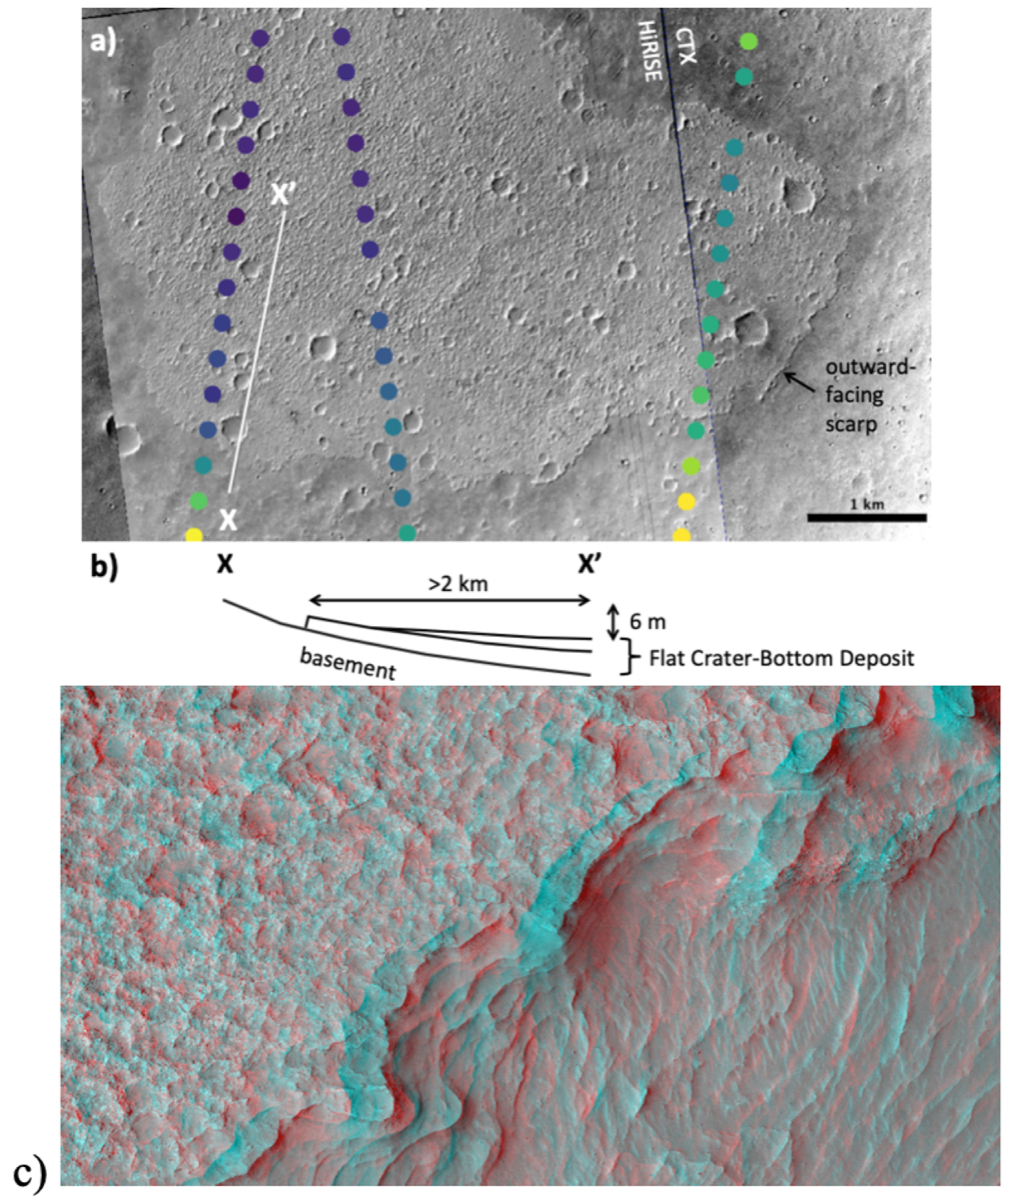
Fig. 1. (a) Example of a flat crater-bottom deposit (interpreted as a lake deposit). ESP_062496_1880. Color scale (MOLA) runs from -180 m (yellow) to ‑220 m (deep blue). (b) Sketch cross-section of profile X‑X’ in (a). (c) Anaglyph of the margin of a flat crater-bottom deposit (ESP_065480_1495), showing nearly-horizontal mid-toned layers exposed beneath the lighter-toned erosionally-resistant cap. 920 m across.
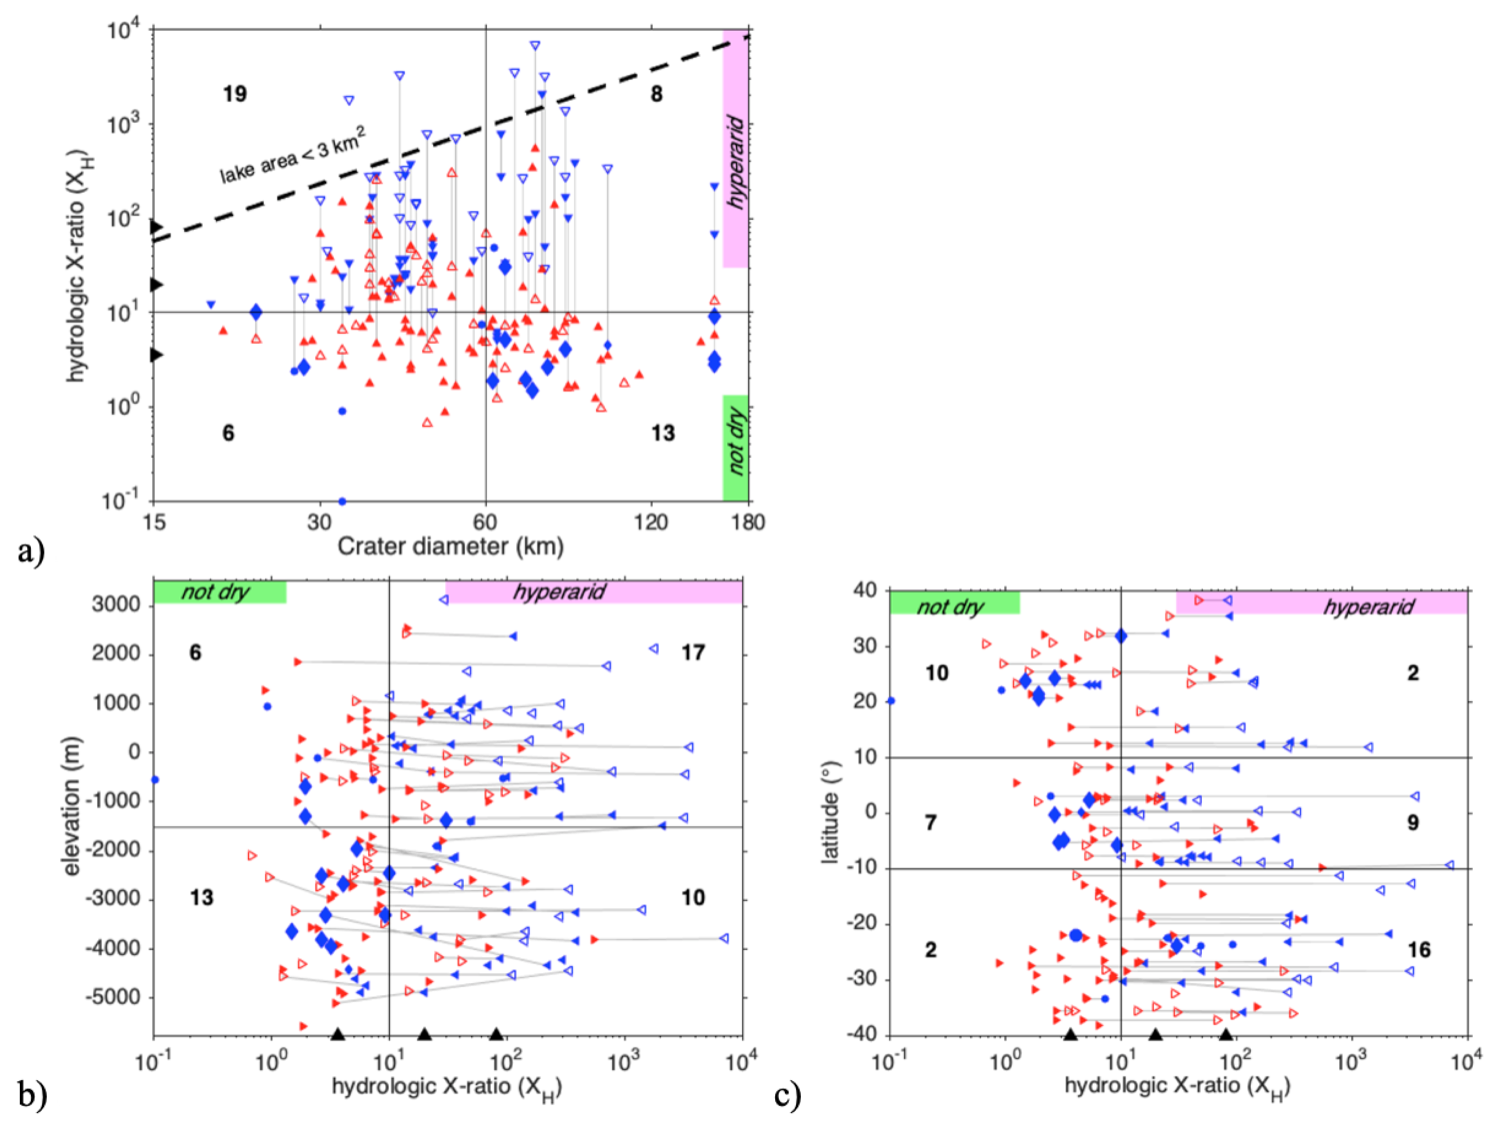
Fig. 2. Late-stage aridity constraints: (a) XH vs. crater diameter. Blue triangles=flat crater-bottom deposits (interpreted as lake deposits) (unfilled=candidate), blue diamonds = deltas/shorelines, blue circles = internal spillways, red filled triangles = alluvial fan toes, and red unfilled triangles = channel-stops. Numbers: # of constraints lying entirely inside a rectangular region. Gray lines connect lowest and highest constraint for a single basin. Black triangles correspond to aridity indices (from ref. [7]) for (from wet to dry) Great Basin wet period; Nevada, present; Death Valley, present. (b) XH vs. elevation. (c) XH vs latitude.
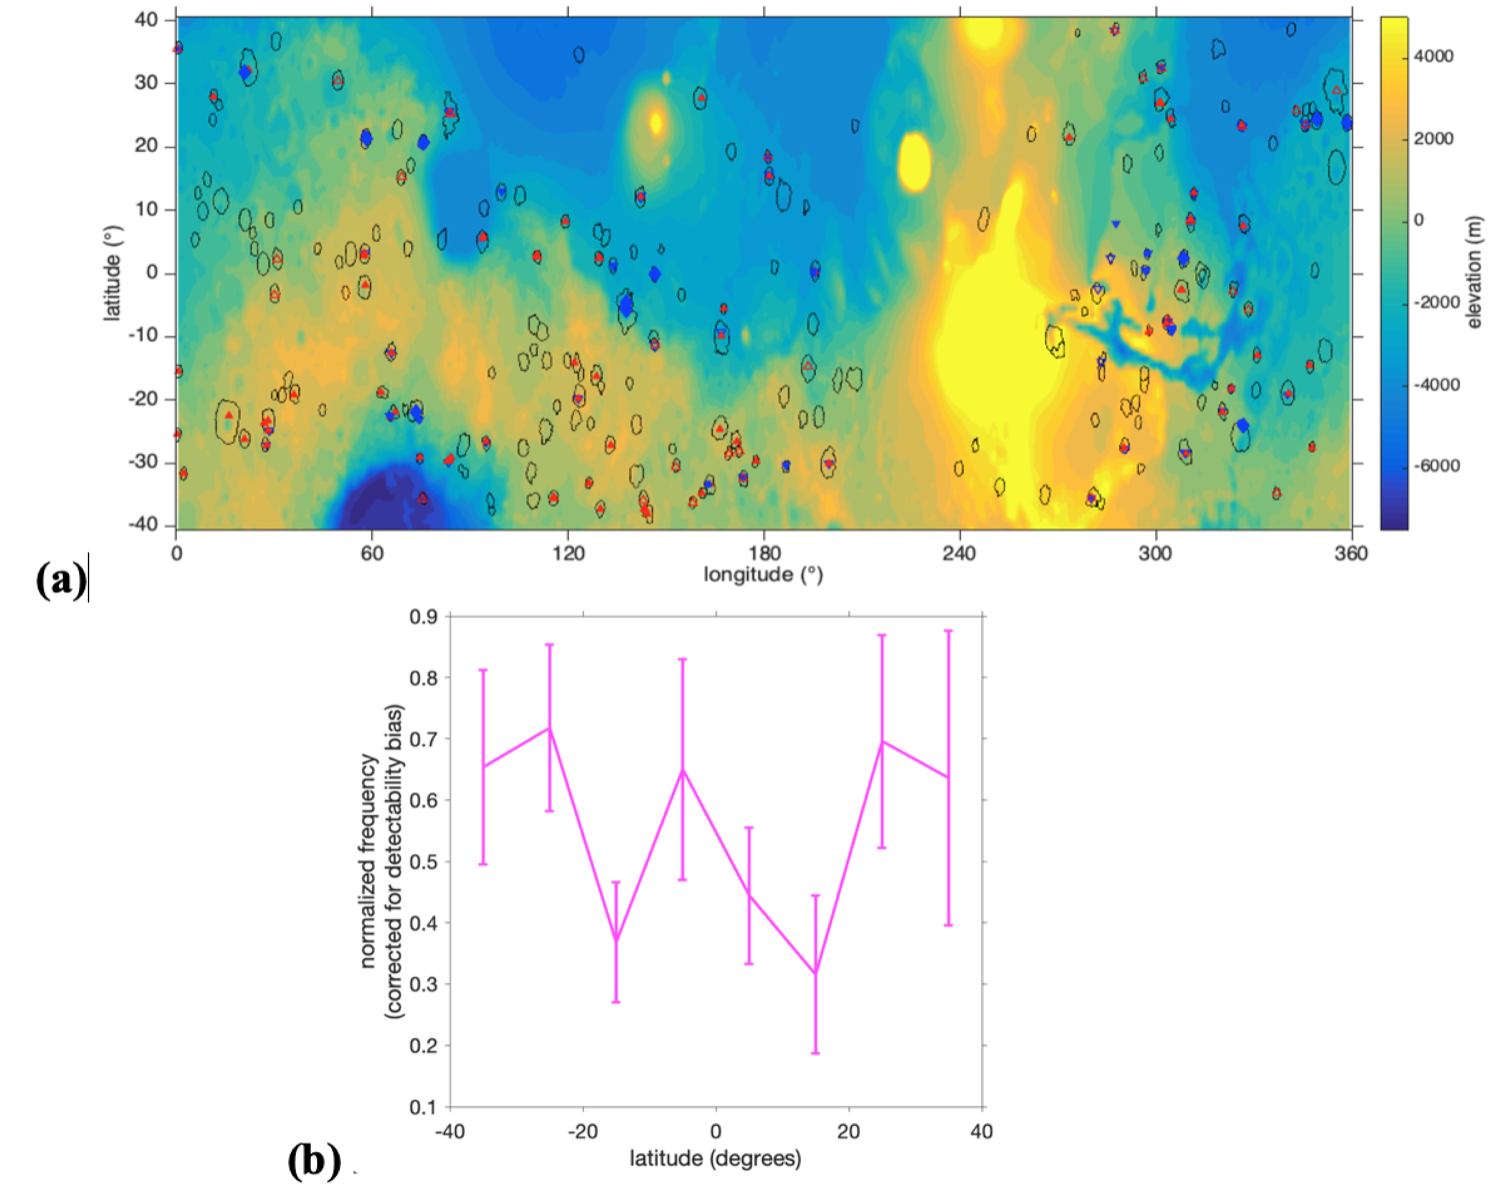
Fig. 3. (a) Survey map. Black contours outline the young geologic units (“AHi” from [6]) that were inspected for paleohydrology constraints. Symbols: as in Fig. 2. (b) Distribution of craters with paleohydrologic evidence with latitude (expressed as a fraction of the number of surveyed craters in that latitude band).
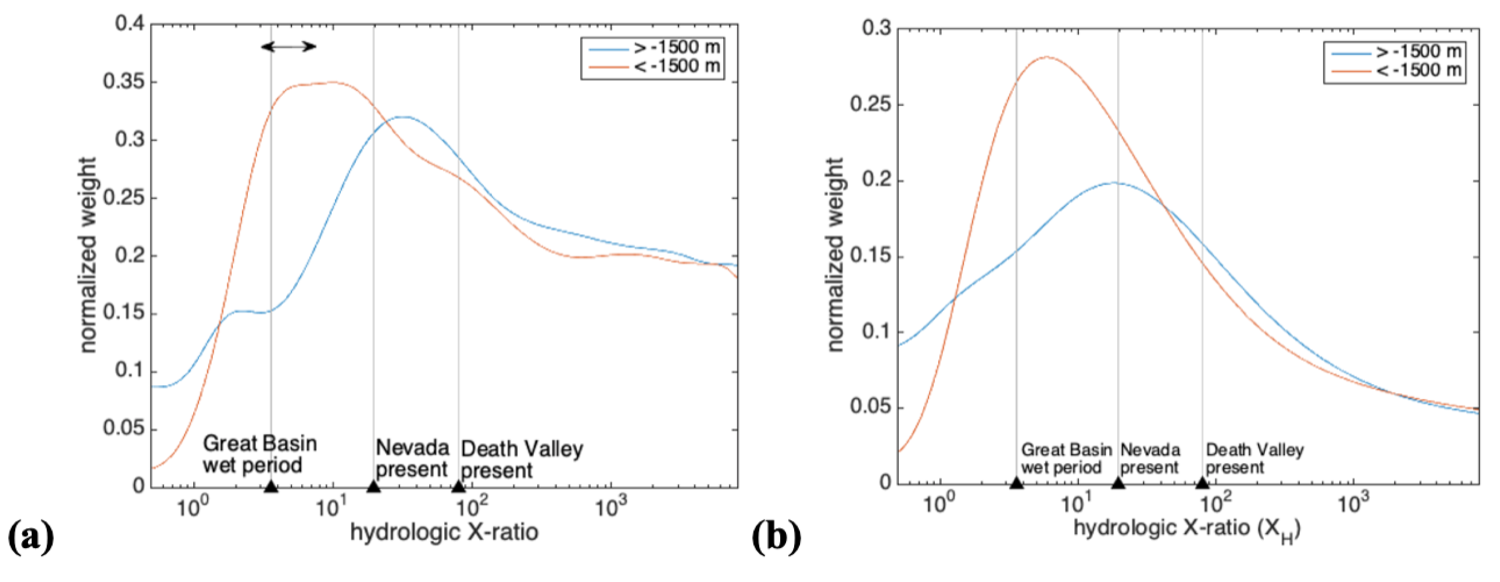
Fig. 4. (a) Kernel density estimate of late-stage XH changes with elevation. Double‑headed arrow corresponds to estimate for early-stage rivers (XH ,ancient = 5±2) from [7]. The modern-Earth aridity values shown by black triangles here are also from [7]. Log‑uniform prior on XH = {0.1, 104}. (b) As (a), but with a log-uniform prior on XH = {0.1, 1014}.
References:[1] Grant & Wilson, GRL 38, CiteID L08201 (2011).[2] Kite, Space Sci. Rev., 215:10 (2019).[3] Irwin et al., Geomorphology, https://doi.org/10.1016/j.geomorph.2014.10.012 (2015).[4] Kite et al., GRL 44, 3991-3999 (2017).[5] Kite et al., Science Advances, 5(3), eaav7710 (2019). [6] Tanaka et al., Geologic map of Mars:USGS Scientific Investigations Map 3292 (2014).[7] Matsubara et al., JGR 116, E4, E04001 (2011).[8] Stucky de Quay et al., Geology 48 (12): 1189–1193 (2020).[9] Fassett & Head, Icarus 198(1), 37–56 (2008).
Grants:NASA(80NSSC20K0144+80NSSC18K1476).
How to cite: Kite, E.: Billion-year trends in the aridity of river-forming climates on Mars, European Planetary Science Congress 2021, online, 13–24 Sep 2021, EPSC2021-345, https://doi.org/10.5194/epsc2021-345, 2021.